
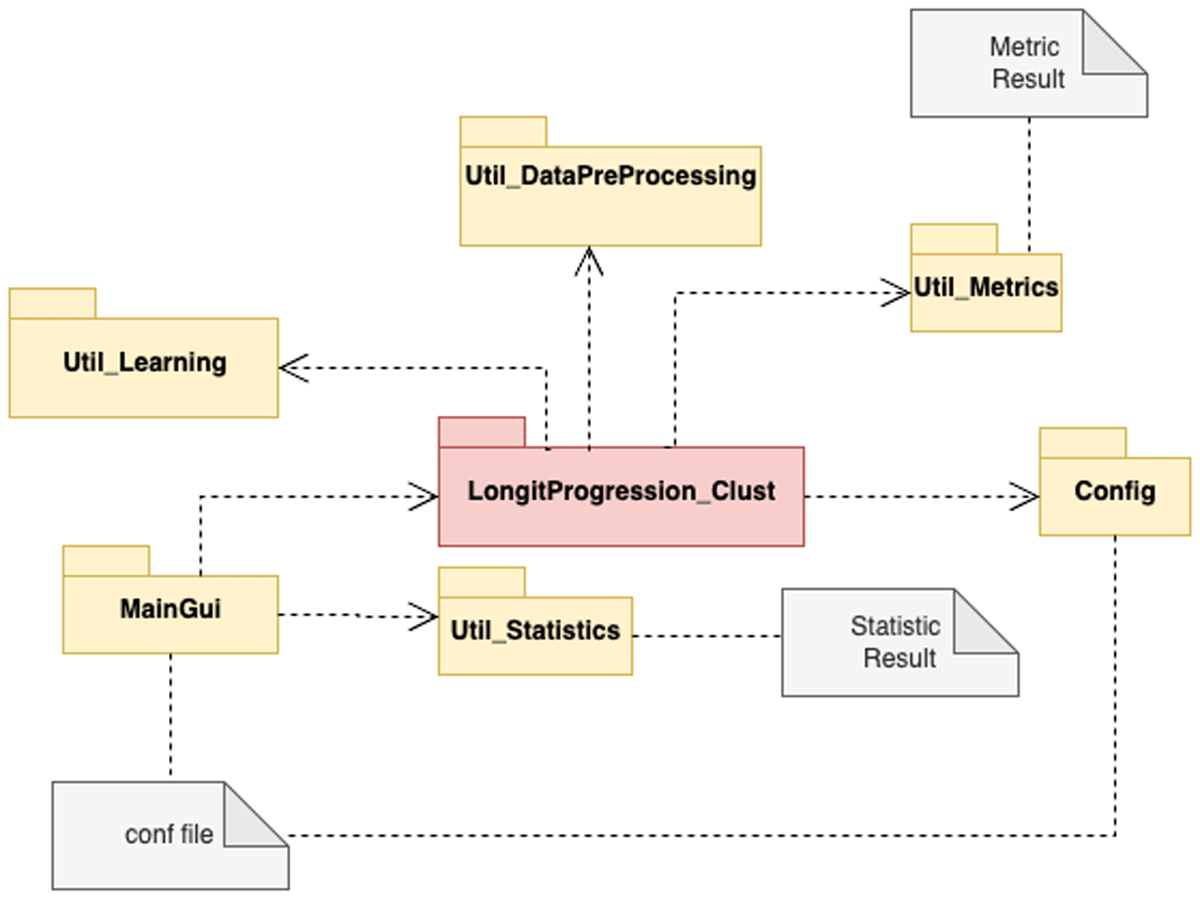
Figure 1
LongitProgression packages diagrams.
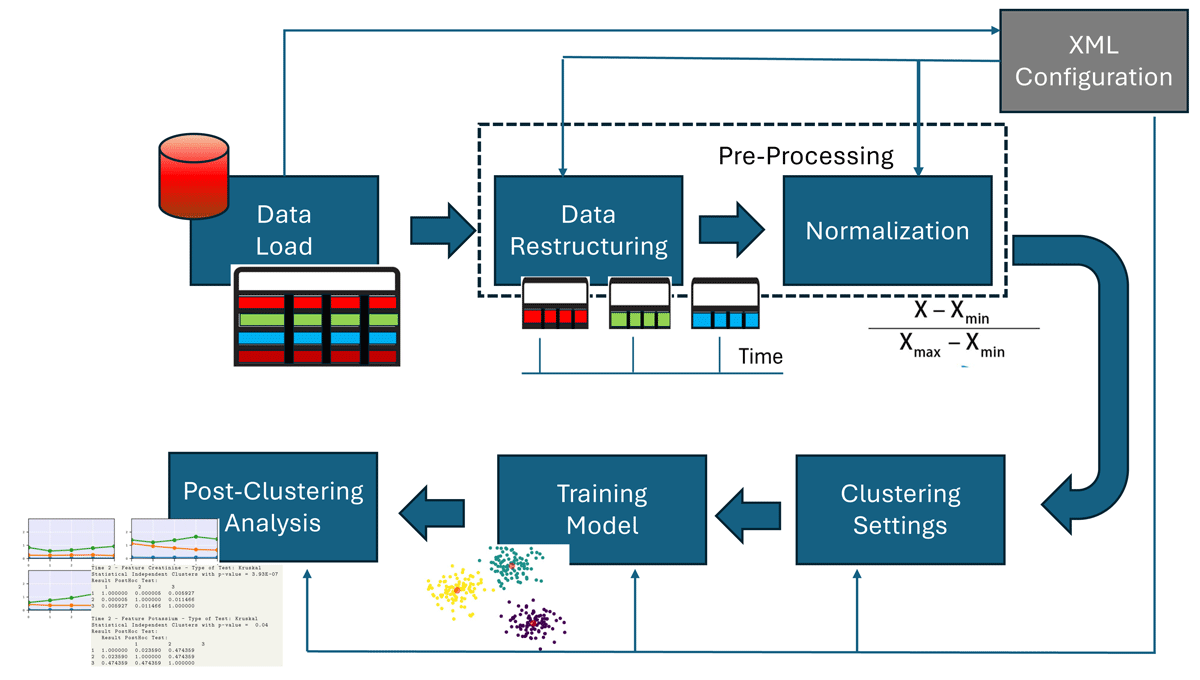
Figure 2
LongitProgression pipeline, from data load to final plots.
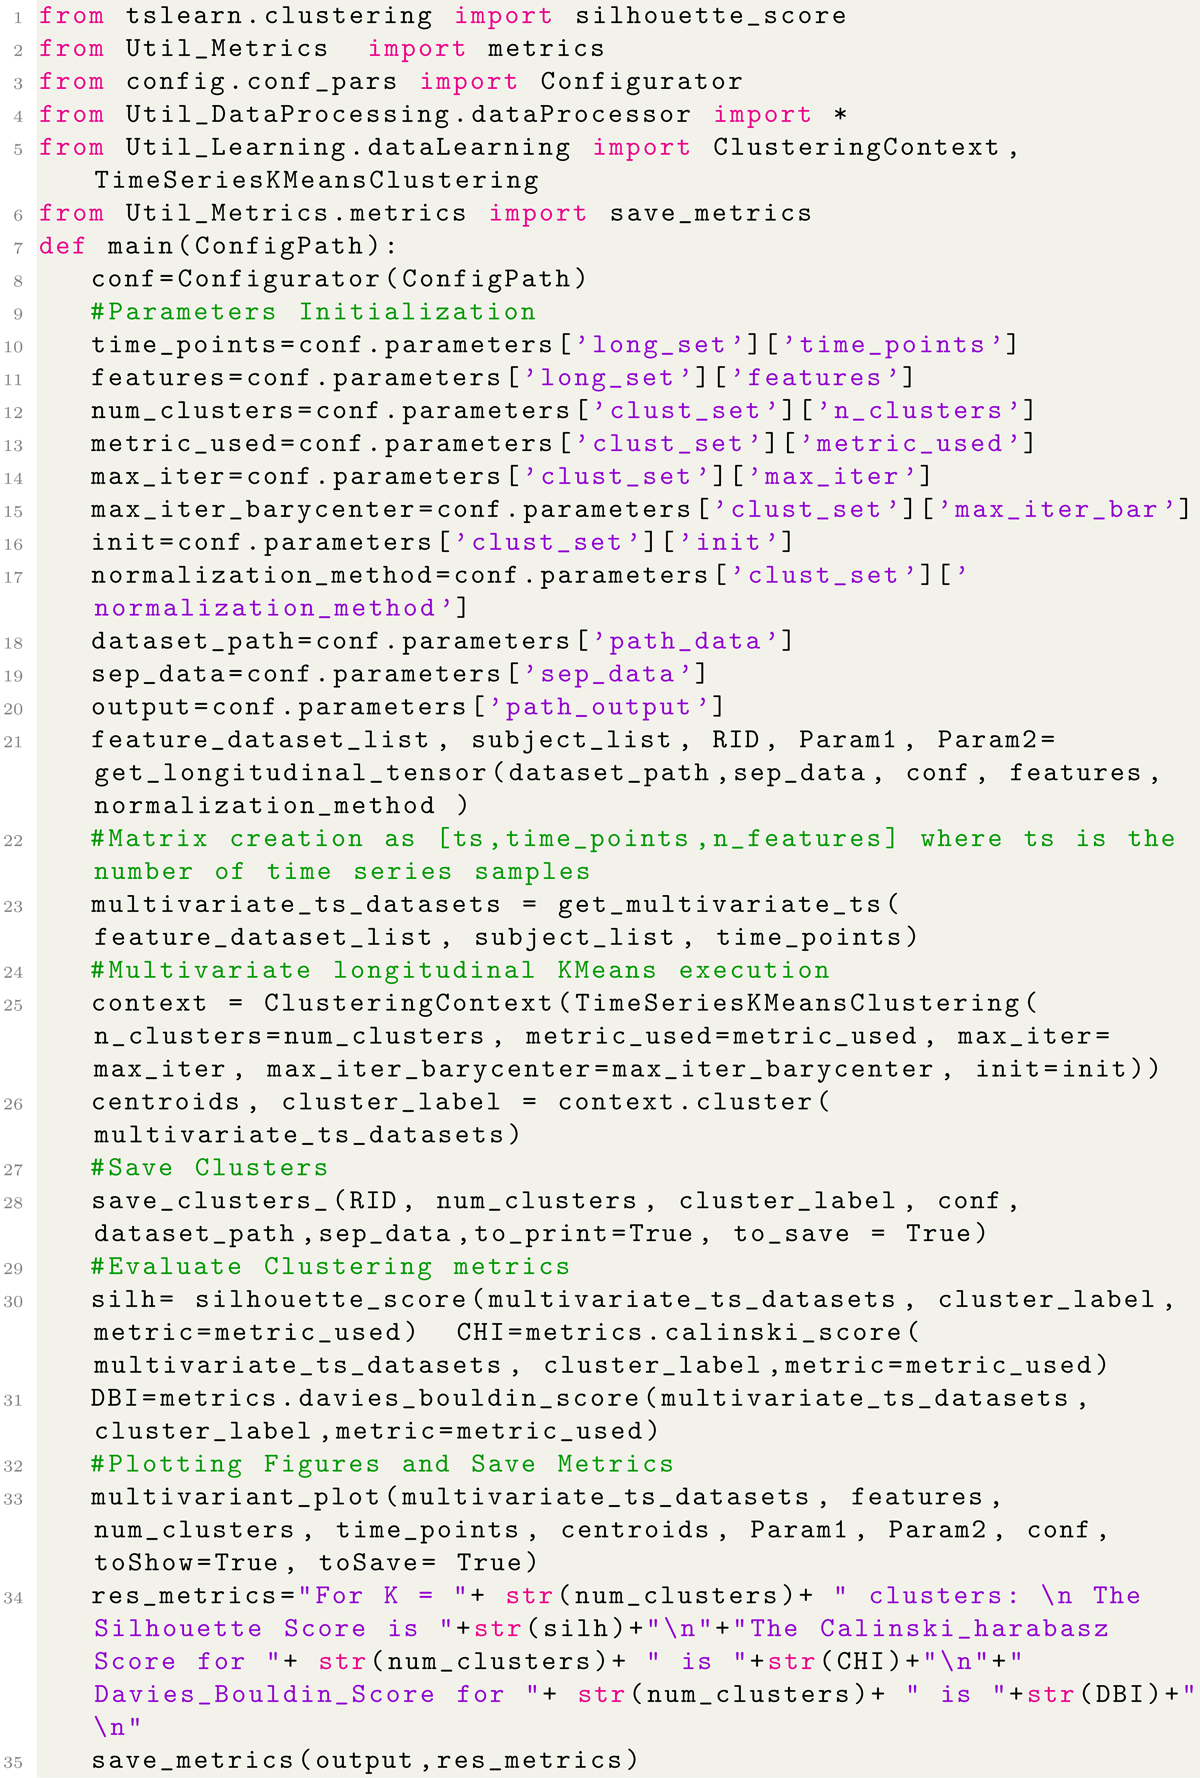
Listing 1
Longitudinal Clustering.
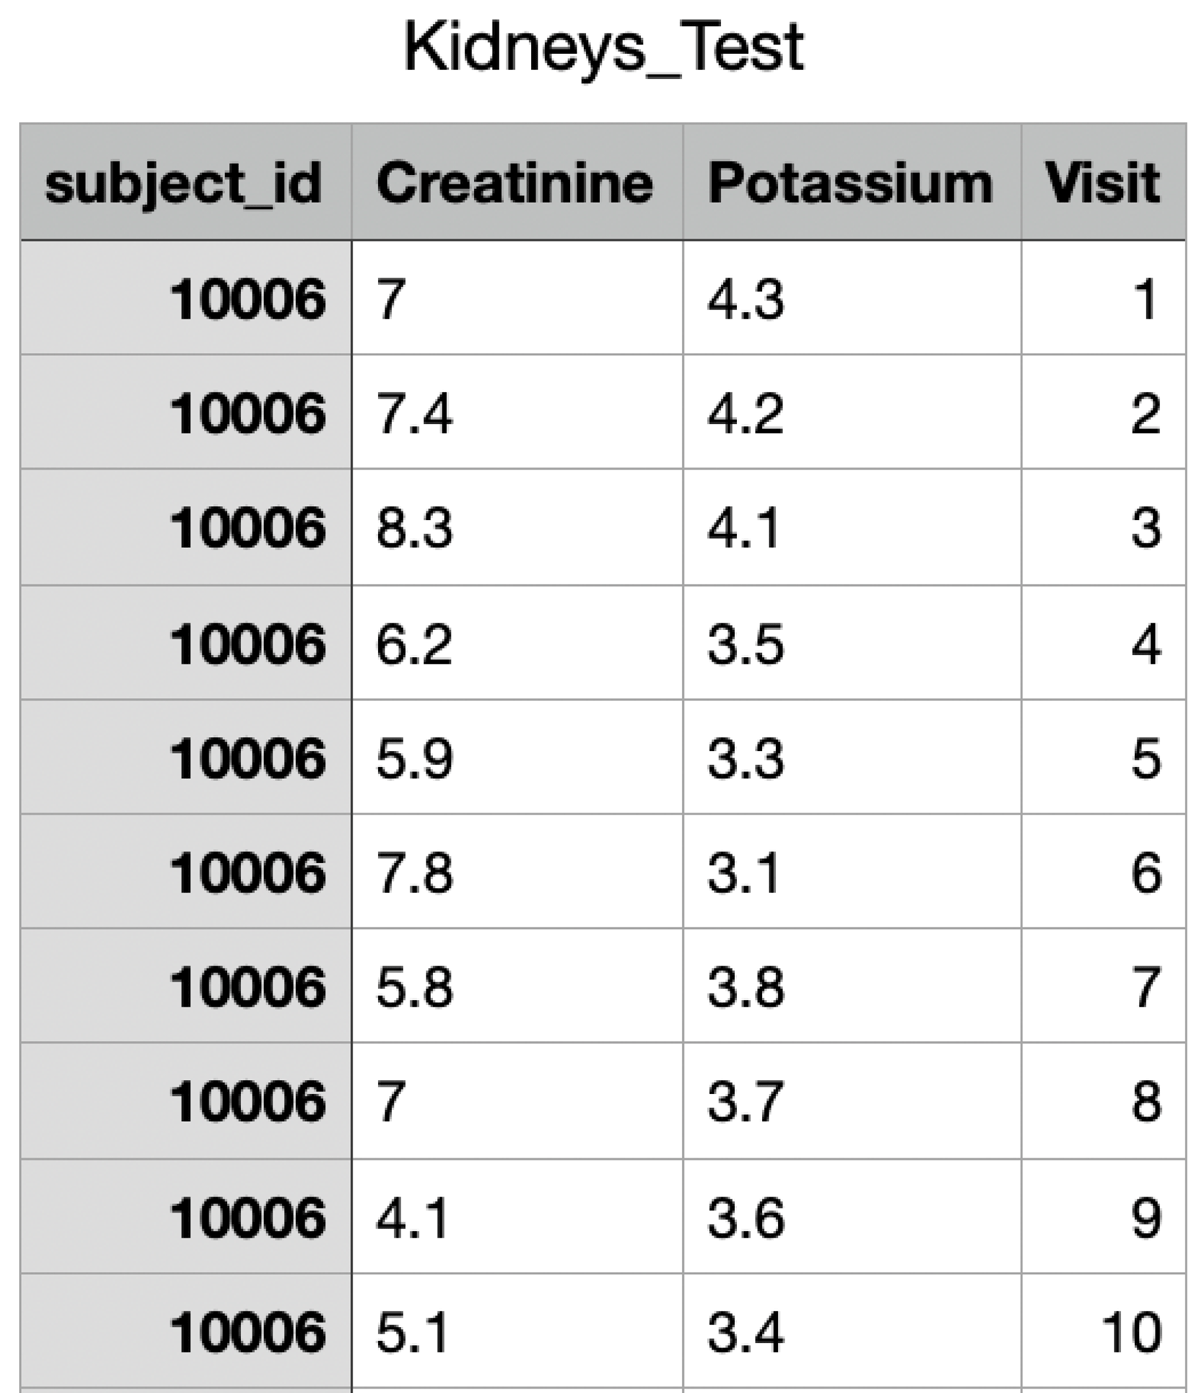
Figure 3
Creatinine and Potassium values over ten time points for Patient 10006.
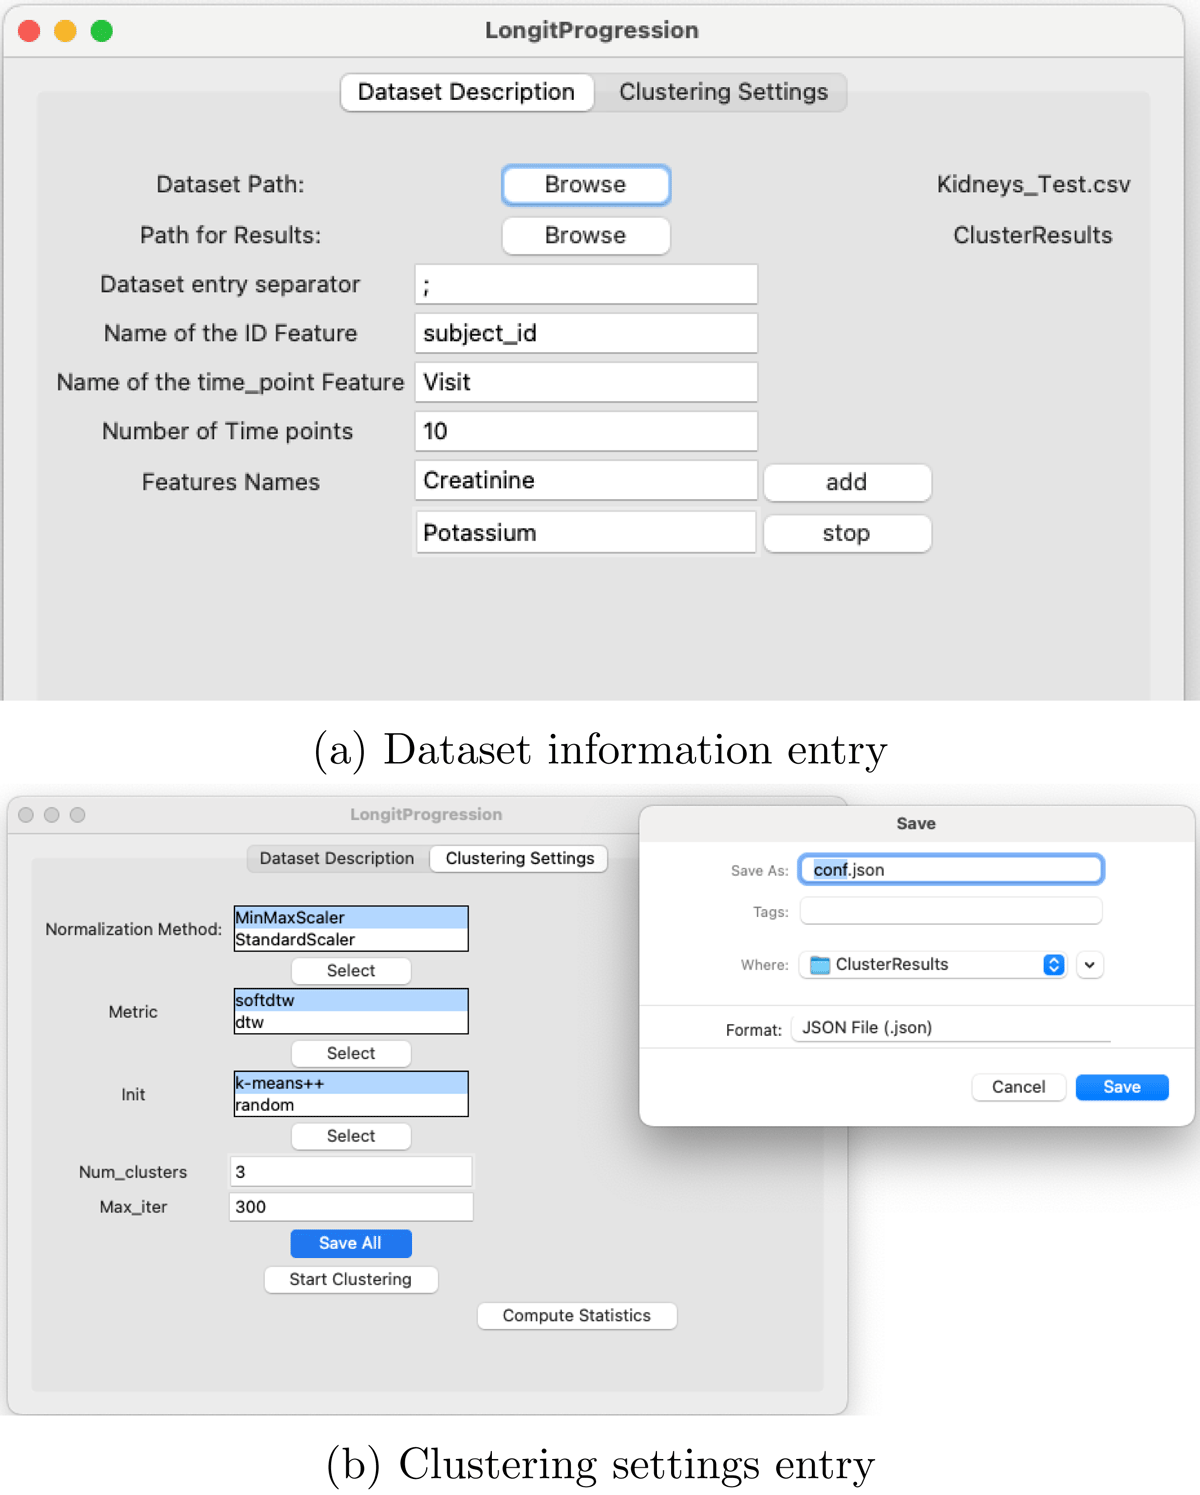
Figure 4
Preparatory steps for performing longitudinal clustering analysis.
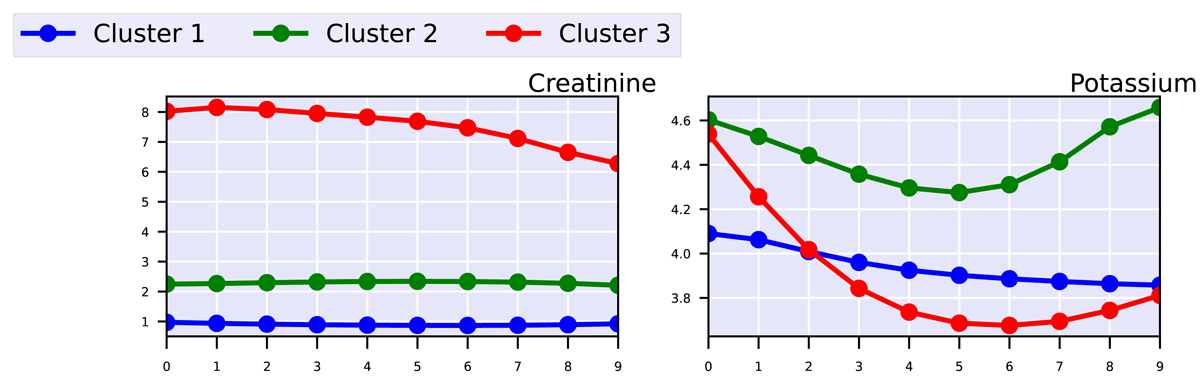
Figure 5
Progression of clinical markers for the three clusters
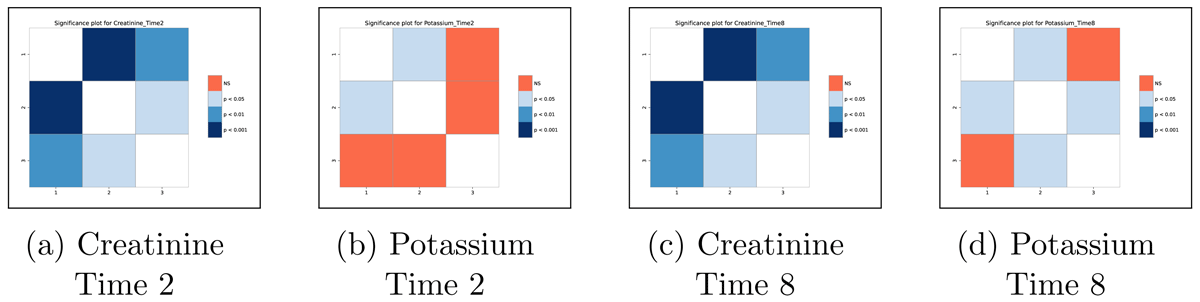
Figure 6
Significance matrices showing the statistical difference among the 3 clusters for Creatinine and Potassium at time points 2 and 8.