
(1) Overview
Introduction
A health-based longitudinal study is a research methodology that involves the systematic collection of participant outcomes, biological markers, and clinical indicators across multiple follow-up assessments, thus resulting in a substantial number of measurements over time for each participant.
The longitudinal nature of repeated measures data requires the implementation of specialized statistical methodologies to address the inter-individual correlation effectively. This approach is imperative for preserving the validity of the analytical results and the interpretations derived from the data.
Identifying clinically relevant subgroups of patients through the analysis of longitudinal data is essential for developing tailored therapeutic interventions, enhancing the quality of care for various diseases, and optimizing the allocation of healthcare resources for patients and their caregivers.
Medical research frequently employs cluster analysis to identify distinct subgroups within study populations based on several patient characteristics. Clustering is an unsupervised learning technique within machine learning that has garnered significant interest in current research and applications.
A fundamental research goal is to identify various developmental factors by analysing longitudinally collected data. This facilitates a more comprehensive understanding of patients’ health conditions among researchers. This method is mainly useful for investigating complex and heterogeneous diseases characterized by a diverse array of symptoms and features. Consequently, integrating diverse features collected over time to develop comprehensive patient profiles is crucial for accurately predicting future outcomes and enhancing clinical decision-making processes.
Compared to single-longitudinal feature clustering, multiple-longitudinal feature clustering allows for a more thorough analysis of patterns that may co-occur across various dimensions of interest. Multivariate longitudinal clustering facilitates the identification of complex interrelationships and strengthens the robustness of the findings. This methodology promotes the incorporation of an extensive array of data and information into the modelling process, which may lead to more precise group classifications and a deeper understanding of their health and medical implications.
This paper presents LongitProgression, a Python software tool created to help researchers cluster multivariate longitudinal data and identify joint trajectories of disease-progression markers. The software integrates the k-means clustering algorithm with time-series analysis to capture the temporal dynamics of medical data and reveal hidden behavioural patterns.
To the best of our knowledge, only an R package named kml3d provides an implementation of k-means specifically designed to work on joint trajectories [1]. Nevertheless, kml3d uses Euclidean distance as a metric to evaluate the distance between two joint trajectories [2], which has several limitations when used to compare trajectories. Indeed, it assumes perfect time alignment, making it sensitive to even slight temporal shifts. It also lacks flexibility in handling irregular sampling or missing data, ignores the overall shape and dynamics of the trajectories, and is highly sensitive to noise and outliers. These drawbacks make it less suitable for analysing complex, real-world longitudinal data.
Our approach overcomes this limitation by supporting not only the Euclidean metric, but also two other distance measures — Dynamic Time Warping (DTW) [3] and soft-Dynamic Time Warping (soft-DTW) [4] — so users may select the most appropriate method based on the specific analysis needs. Indeed, in contrast to Euclidean distance, DTW is capable of comparing time series of different lengths and remains robust to temporal shifts and distortions. Soft-DTW is a differentiable variant of classical DTW, enabling the use of gradient-based optimization methods in time series analysis.
Moreover, kml3d relies on R packages that are difficult to integrate into common machine learning (ML) libraries and clustering pipeline. R packages are designed with their own specific data structures and formats, whose integration into ML ecosystems, such as Scikit-learn or TensorFlow, requires additional preprocessing or wrapper functions to ensure compatibility. This can lead to inefficiencies, added complexity, and a greater likelihood of errors.
On the other hand, regarding longitudinal clustering methods that are not based on k-means, several alternative approaches have been proposed in the literature. These include probabilistic methods such as mclust [5], functional data analysis techniques like fdapace [6], and parametric trajectory-based models such as gbmt [7]. As reported in [8], a series of comparative experiments conducted to analyse sepsis progression demonstrated that our approach achieves superior performance compared to the cited methods. In addition, compared to these approaches, LongitProgression provides functionalities for preprocessing, clustering, visualization, and statistical analysis, allowing researchers to explore and interpret complex, multi-dimensional datasets efficiently. It also provides a set of well-known clustering metrics included in the tool to evaluate the performance of the clustering results.
Hence, the main innovative contribution of LongitProgression lies not only in offering a robust longitudinal clustering method, but also in being designed as a comprehensive tool that supports the entire clustering pipeline — from data preprocessing to result interpretation — unlike existing approaches that typically provide only the clustering algorithm itself.
Its applicability has already been demonstrated through real-world applications. Indeed, LongitProgression has been recently applied to study Alzheimer’s disease progression [9, 10], as well as to identify risk factors in septic patients [8, 11]. It will also be used to analyse the large volume of real-world data currently being collected from the ongoing Age-It project [12].
Finally, although the tool was initially developed with a focus on healthcare studies, its modular and flexible design makes it a versatile resource for researchers and practitioners across a wide range of disciplines. In particular, its applicability extends to fields such as social sciences and economics, where the analysis of longitudinal data and the identification of evolving patterns over time are equally critical. Moreover, it has also been explored in the field of energy sustainability, in a study—currently in press—focused on evaluating the temporal evolution of natural lighting in indoor environments.
Implementation and Architecture
LongitProgression is a Python tool for performing multivariate longitudinal clustering. It is designed to analyse complex datasets involving repeated measurements over time across multiple variables. It is an algorithm-based approach that leverages k-means-based clustering, which is well-known for partitioning a group of entities into K distinct, non-overlapping clusters based on the input variables.
The tool leverages the k-means-based clustering algorithm to identify latent groups of subjects, investigating their temporal patterns and correlations across multiple features. By integrating time-series analysis with clustering techniques, the tool can capture dynamic trends and variability in longitudinal data, facilitating the identification of meaningful subgroups within heterogeneous populations. The implementation supports a range of metrics for evaluating clustering performance for different types of longitudinal data. Its intuitive use allows seamless data preprocessing, clustering execution, and results analysis. The tool is open-source, easy to use, and customizable, with examples to support adoption and application in real-world datasets.
LongitProgression is structured in seven packages as shown in Figure 1:
The MainGui package provides graphical interfaces designed for customizing and setting up clustering tasks. It allows users to easily define and adjust various parameters essential for preprocessing, clustering, and visualization. It empowers researchers to customize their analysis pipelines without any deep expertise in algorithm tuning while still maintaining flexibility and control over the clustering process.
The LongitProgressionClust package is the core tool component, designed to group subjects into distinct clusters based on patterns in their multivariate time-series data. This module leverages the well-known k-means algorithm, explicitly adapted for longitudinal datasets, to identify latent subgroups exhibiting similar temporal behaviour across multiple variables.
The Config package provides the classes and methods to load configuration parameters that will be used by the LongitProgressionClust package.
The Util_Learning package provides learning methods for clustering, particularly the multivariate k-means. Its customizable parameters and distance metrics offer flexibility, allowing its application to analyse different datasets.
The Util_DataPreprocessing package is designed to prepare raw longitudinal data for clustering analysis by performing a series of essential data transformation steps. Its main goal is to ensure the data is properly formatted, normalized, and enhanced for effective clustering.
The Util_Metrics package provides a suite of evaluation metrics designed to assess the quality and interpretability of clustering results, specifically for longitudinal clustering. This package enables users to objectively assess how well the algorithm captures patterns within the data and the coherence of the resulting clusters.
The Util_Statistics package provides post-clustering evaluation tools to assist in interpreting the clustering results in the context of longitudinal patterns. Mainly, it provides two of the most common statistical methods for analysing the resulting clusters.
Software Functionalities
The pipeline of a longitudinal study with the LongitProgression tool, from data load to final results, is depicted in Figure 2. It involves several steps to process data, restructure it, normalize it, and set cluster parameters before applying a longitudinal clustering model and visualizing the results. Below are reported the software functionalities that subtend the workflow:
Data Load: This functionality allows users to specify data sources and to define the structure of longitudinal datasets, including time points and relevant variables for clustering. Users must also specify the keys used to identify the subjects and the time points in the dataset. These parameters must be saved in the file named conf.json (Figure 1).
Pre-processing – Data Restructuring: This functionality enables reshaping the data to meet the model’s requirements for longitudinal data. Starting from a dataset where each time point has its own row per individual and features, a matrix is created in the form of [ts, time\_points, n\_features] where ts is the number of time series, time_points are the points of the time series, and n_features are the number of the features to be considered for the clustering.
Pre-processing – Normalization: To ensure that variables with different units or scales do not disproportionately influence the clustering results, the tool includes functions for data normalization, such as z-score normalization and Min-Max scaling.
Clustering Settings – K-means Parameters Customization: This functionality allows users to specify the typical k-means parameters, such as the number of clusters (K), initialization methods for centroids (e.g., random initialization), and the maximum number of iterations.
Clustering Settings – Distance Metrics Choice for Longitudinal Data: A key feature of the tool is its support for specialized distance metrics that account for the temporal nature of the data. Users can select the distance metric that better captures the variations and trends in time-series data, such as Dynamic Time Warping (DTW) or softDTW, making k-means more suitable for longitudinal analysis.
Training Model: It applies clustering to group individuals based on their longitudinal data (i.e., time series). It iteratively assigns subjects to clusters based on their multivariate time-series data similarity, and optimizes the cluster centroids by minimizing the appropriate distances between data points and the centroids across all time points. Each cluster is saved in an appropriate CSV file containing all the features related to the subjects within the cluster, allowing for subsequent statistical analysis.
Post-Clustering Analysis – Clustering Performance Evaluation: The tool provides functionalities for evaluating the clusters’ quality by including metrics such as the Silhouette score, Davies-Bouldin Index, and Calinski-Harabasz Index, enabling users to assess how well the clustering solution fits the data and as well as to determine the appropriateness of the selected number of clusters.
Post-Clustering Analysis – Plotting: The tool allows for visualizing the cluster centroids’ trajectories over time, thus showing how the clusters evolve over time. This helps users interpret each cluster’s temporal dynamics and understand the underlying patterns in the data.
Post-Clustering Analysis – Statistical study: The tool also allows statistical analysis of the detected clusters. Primarily, the ANOVA and Kruskal-Wallis tests can be performed based on the normality of the distribution for each time point of the longitudinal data.
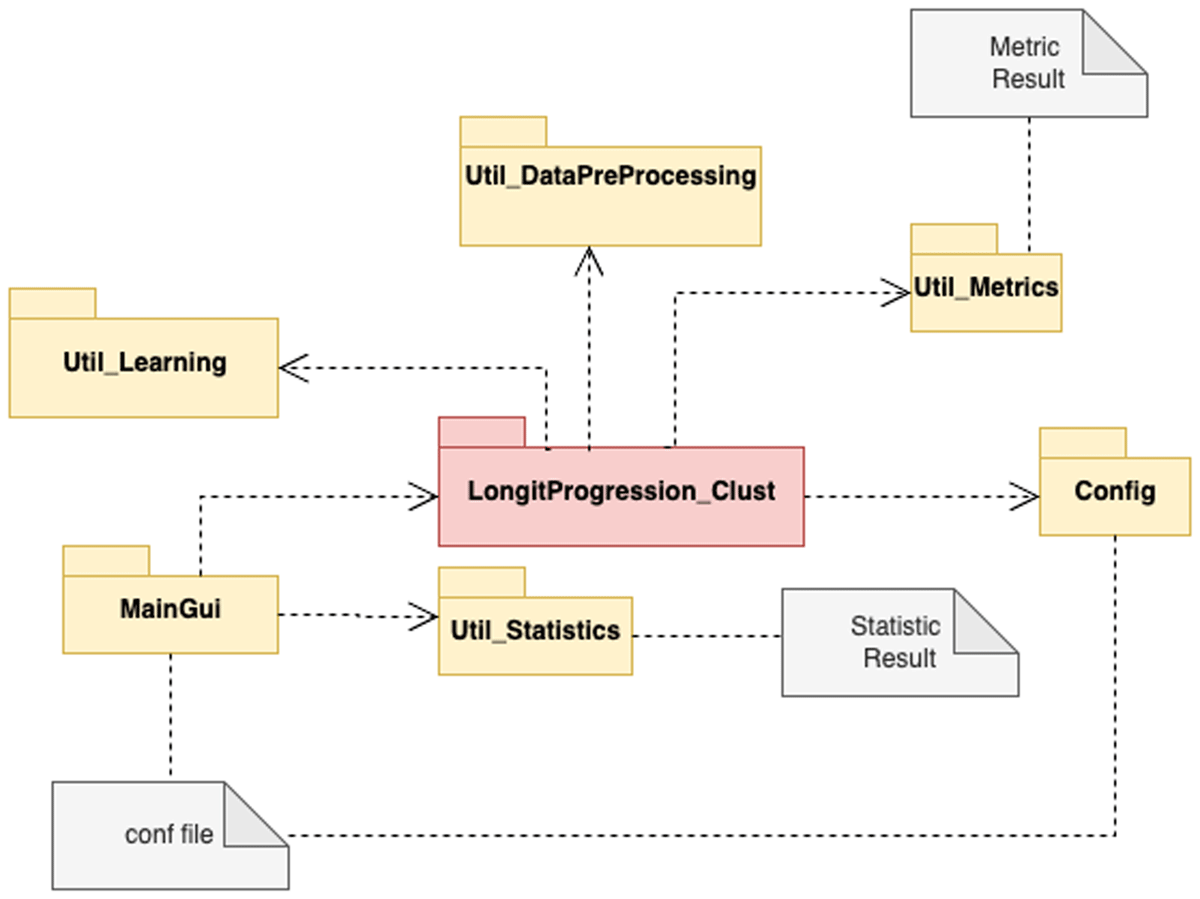
Figure 1
LongitProgression packages diagrams.
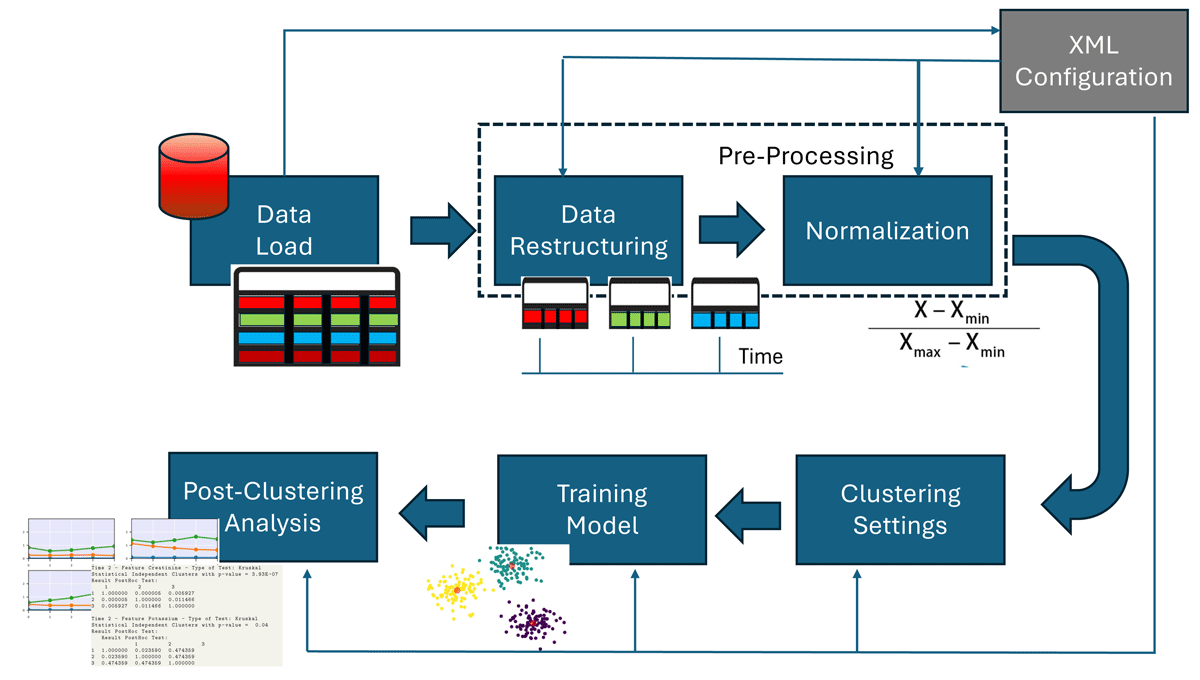
Figure 2
LongitProgression pipeline, from data load to final plots.
Sample code snippets analysis
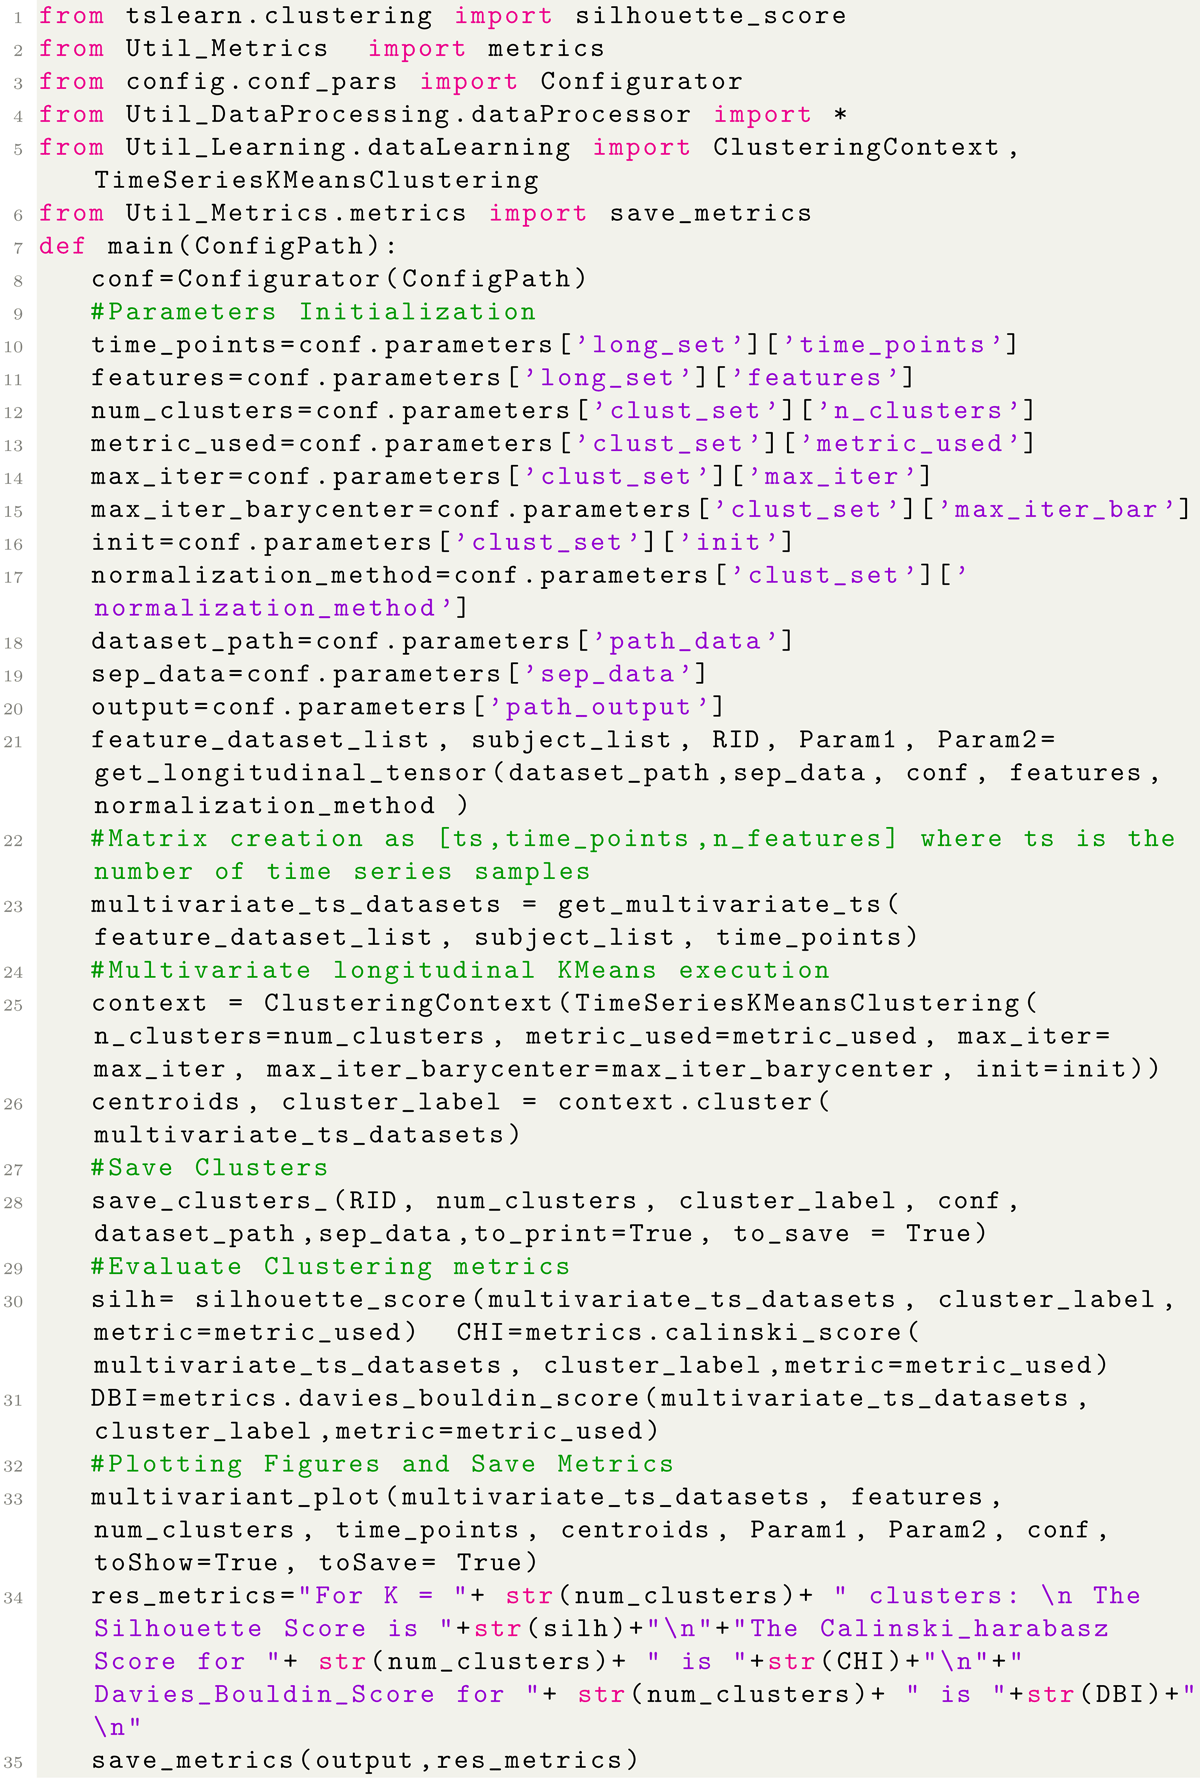
Listing 1 reports the main code for performing the longitudinal clustering. It implements the whole pipeline depicted in Figure 2.
Listing 1
Longitudinal Clustering.
Illustrative example
This section presents an illustrative example of using LongitProgression to discover joint trajectories of clinical markers in a kidney disease study. To exemplify, we use a portion of the data contained in the MIMIC III dataset [13]. MIMIC-III is a large, freely available database comprising de-identified health-related data associated with over 40,000 patients who stayed in critical care units of the Beth Israel Deaconess Medical Center between 2001 and 2012 [14]. The portion of the dataset has been obtained by extracting patients having no missing values of Creatinine and Potassium over ten time points, i.e., over ten successive visits. Each individual is identified by an ID (i.e., subject_id). The resulting dataset is saved in CSV format and is available on GitHub to allow users to replicate the entire example.
Figure 3 shows a portion of this dataset related to values of Creatinine and Potassium over ten time points of Patient 10006.
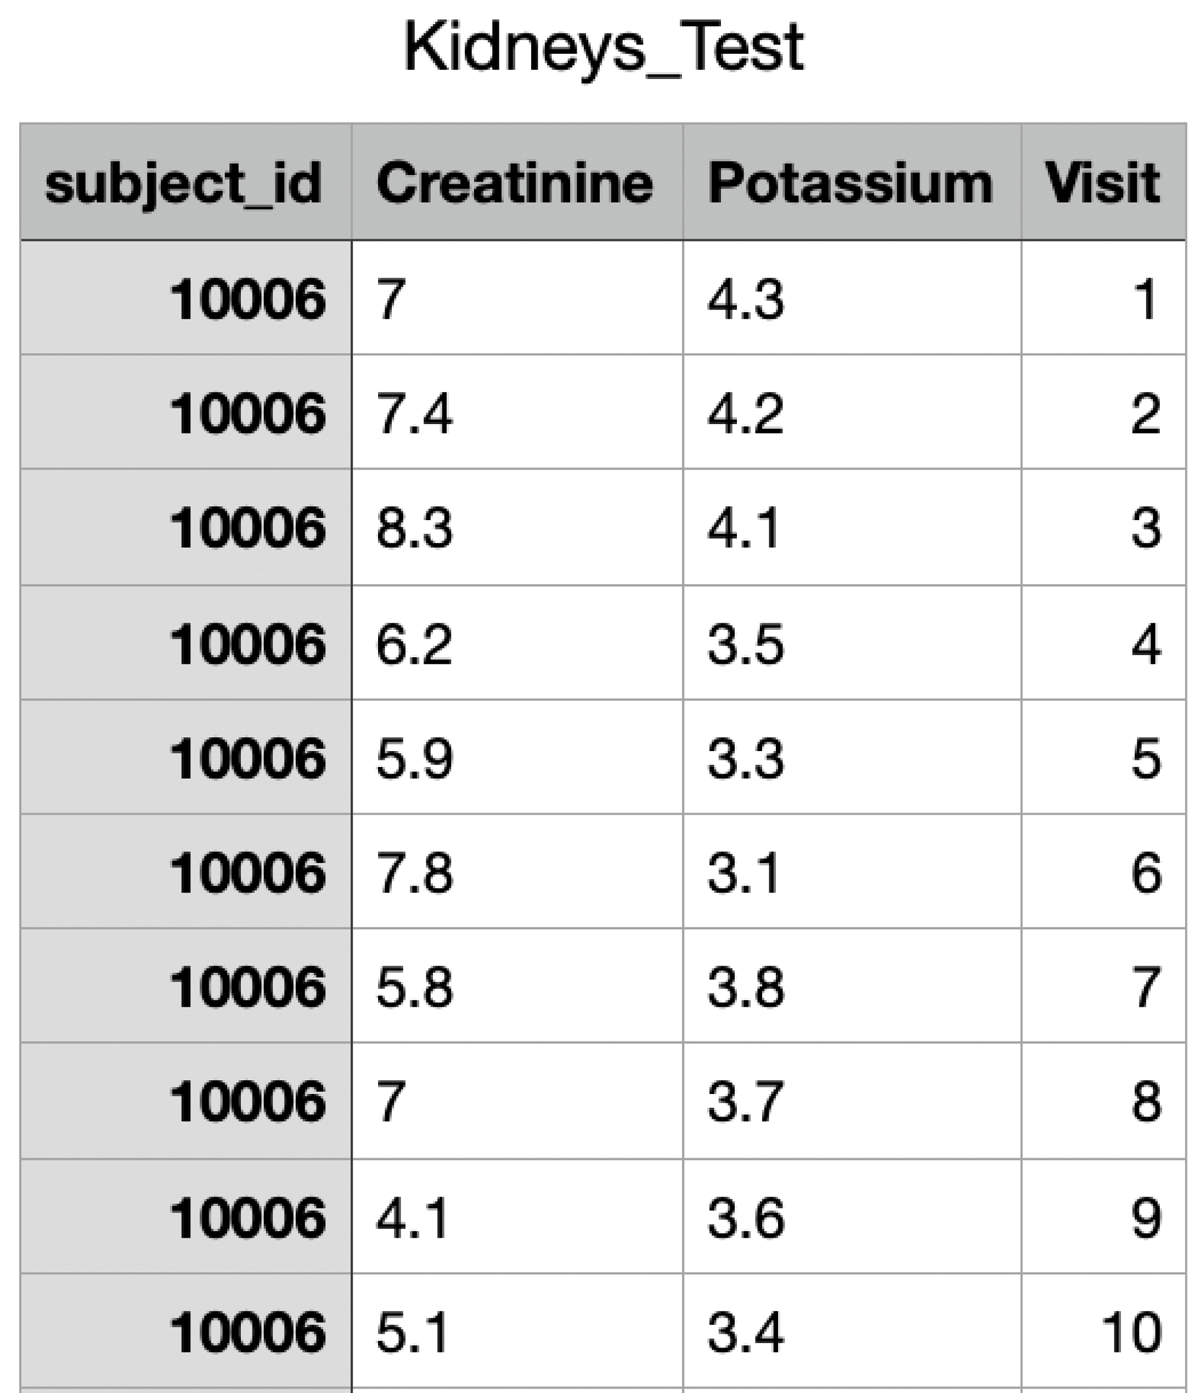
Figure 3
Creatinine and Potassium values over ten time points for Patient 10006.
The tool is launched by entering the following command in the terminal, after which the main user interface will be displayed.
1 python MainGui
The first step consists of importing the dataset and entering all relevant study-related information in the Dataset Description tab, as illustrated in Figure 4a.
Then, we proceed to configure the clustering parameters for the study (Figure 4b). For illustrative purposes, we choose to normalize the features using the MinMaxScaler, and adopt soft-DTW as the distance measure. The K-means++ algorithm is used for initialization, and the Num_clusters parameter is set to 3, meaning that the goal is to identify three distinct clusters of clinical marker trajectories. All these parameters must be saved in a configuration file named conf.json.
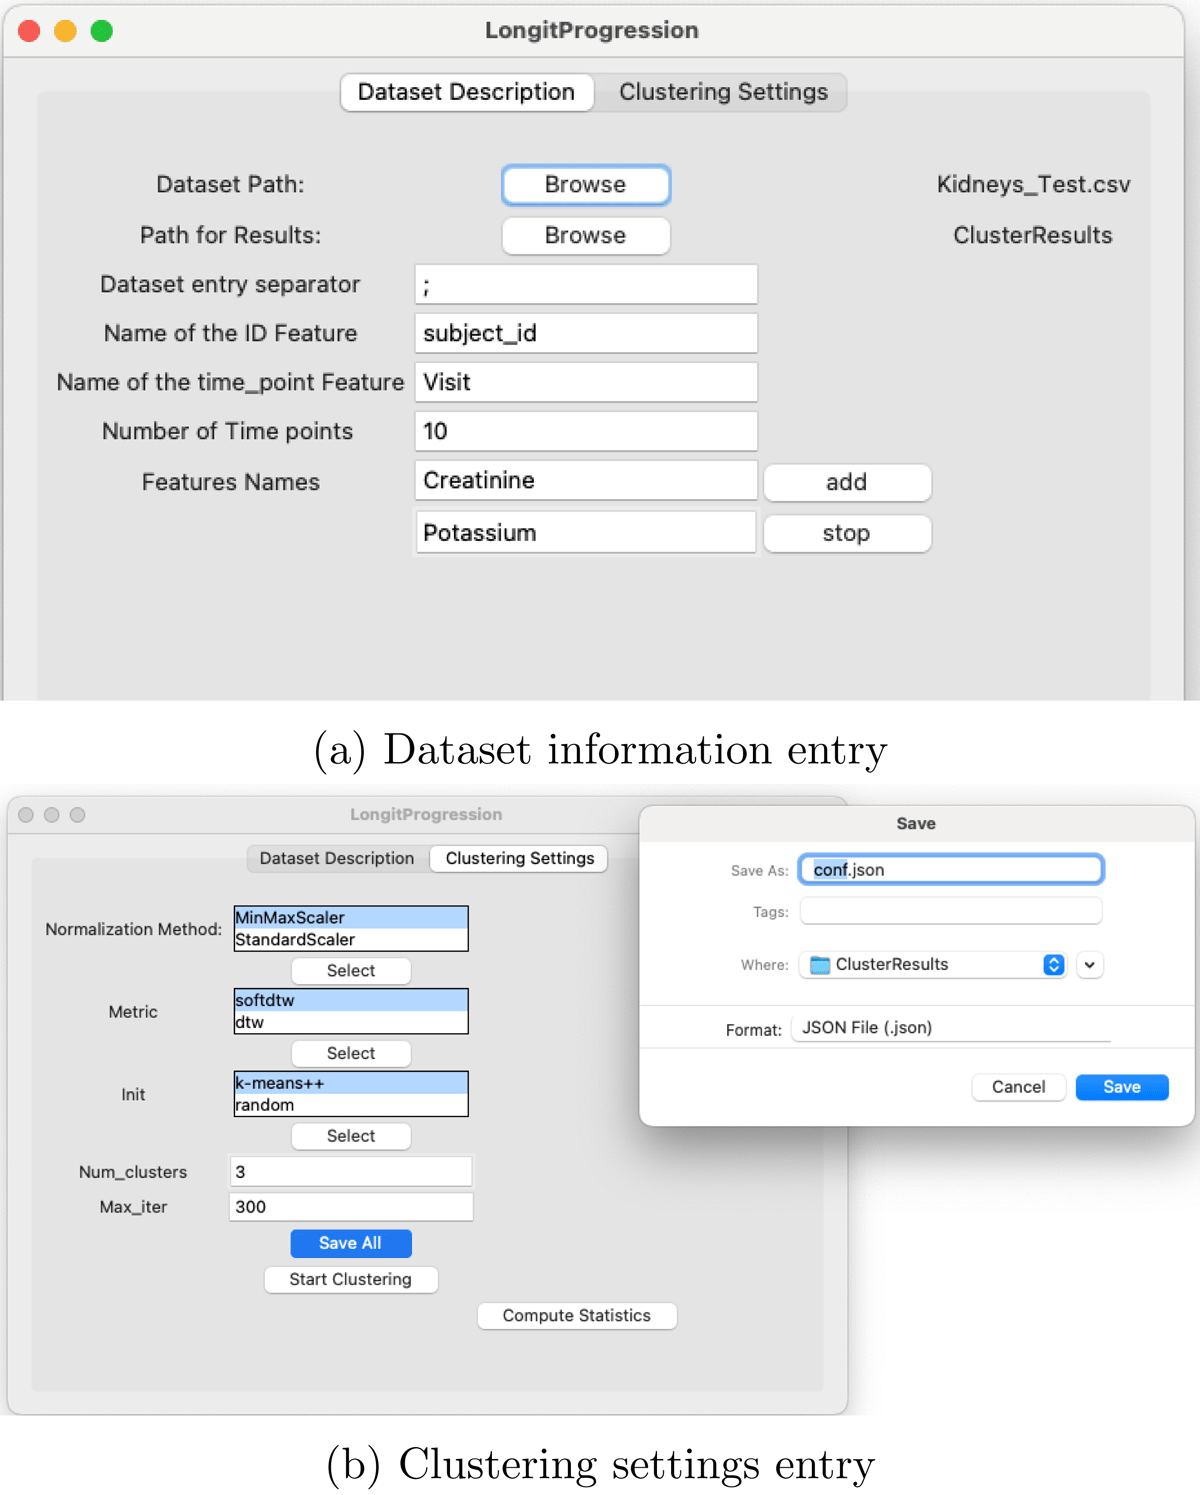
Figure 4
Preparatory steps for performing longitudinal clustering analysis.
The results of the longitudinal clustering are saved in the specified directory. After that, the clustering process can be initiated, and the user has the option to perform statistical analysis on the resulting clusters.
At the end of the process, the tool generates the following set of outputs:
CSV Cluster files: One CSV file (three in this example) is produced per cluster, each containing the records of individuals belonging to that cluster.
Trend of cluster trajectories: A PDF file is also generated, containing a visualization of the joint trajectories identified for each cluster. In our example, this is shown in Figure 5, which illustrates how the clinical markers (i.e., Creatinine and Potassium) evolve over time within each cluster, outlining three distinct subject profiles that reflect different patterns of kidney disease progression. In particular, in this example, Cluster 1 includes individuals without signs of kidney dysfunction, who maintain low creatinine and normal potassium levels over time. Cluster 2 groups individuals with mild kidney impairment, characterized by creatinine levels around two and fluctuating potassium levels; however, their condition appears stable. Finally, Cluster 3 includes individuals with initially severe kidney issues, whose condition shows moderate improvement, likely due to treatment administered during hospitalization.
Metrics_Result.txt: This file contains the evaluation metrics values corresponding to the specific instance of the longitudinal clustering performed. In our example, the results indicate that the identified clusters are well-defined, although they may not represent the optimal clustering solution. Multiple clustering runs can be performed to identify the configuration that yields the best overall performance.
1 The Silhouette Score is 0.646
2 The Calinski_harabasz Score is 70.040
3 Davies_Bouldin_Score for 3 is 0.743
Statistic_result.txt: This file contains the results of a statistical analysis performed on the identified clusters at each time point. An excerpt from this file, shown below for our example, demonstrates statistically significant differences among the three clusters. Furthermore, the post-hoc analysis highlights significant differences between specific pairs of clusters.
1 Time 2 - Feature Creatinine - Type of Test : Kruskal
2 Statistical Independent Clusters with p- value = 3.93E -07
3 Result PostHoc Test :
4       1       2       3
5 1 1.000000 0.000005 0.005927
6 2 0.000005 1.000000 0.011466
7 3 0.005927 0.011466 1.000000
8 Time 2 - Feature Potassium - Type of Test : Kruskal
9 Statistical Independent Clusters with p- value = 0.04
10 Result PostHoc Test :
11 Result PostHoc Test :
12      1       2       3
13 1 1.000000 0.023590 0.474359
14 2 0.023590 1.000000 0.474359
15 3 0.474359 0.474359 1.000000
Significance matrices: These are a set of PDF files displaying the statistical significance results for each post-hoc test performed. To illustrate, we present the matrices related to Creatinine and Potassium at time points two and eight (Figure 6). From these matrices, for example, researchers can observe that at time point two, there is a statistically significant difference among individuals in all three clusters regarding Creatinine. Conversely, for Potassium, a significant difference is observed only between Cluster 1 and Cluster 2. Similar conclusions can be drawn by examining the results at time point eight.
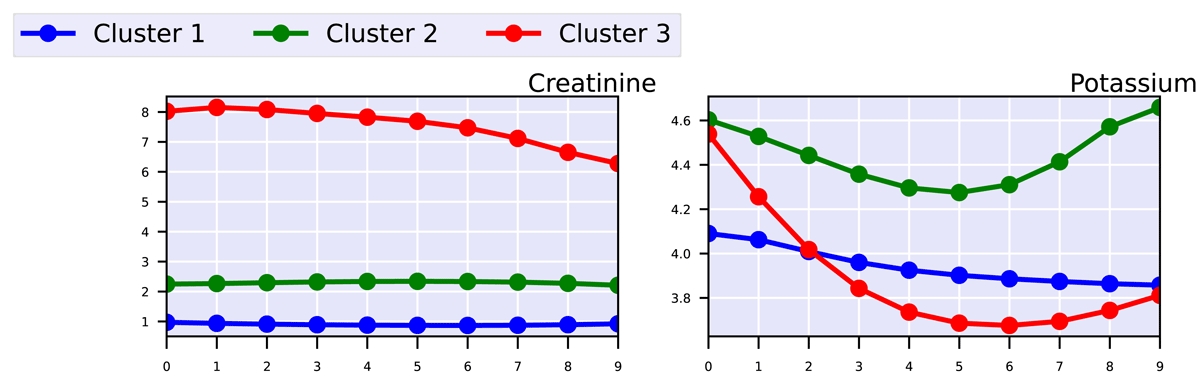
Figure 5
Progression of clinical markers for the three clusters
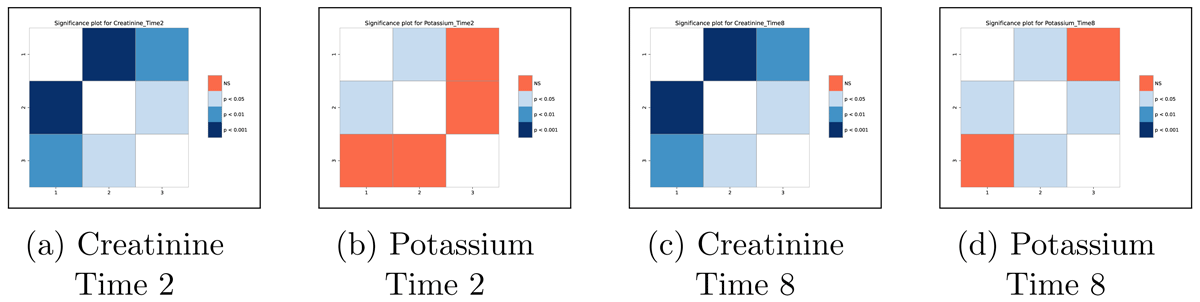
Figure 6
Significance matrices showing the statistical difference among the 3 clusters for Creatinine and Potassium at time points 2 and 8.
Quality control
LongitProgression has been used in several research papers to analyse Alzheimer’s disease progression and sepsis development, further demonstrating its applicability and reliability in real-world biomedical research settings and with different datasets [9, 10, 11, 15, 16]. Moreover, we compared the performance of LongitProgression for sepsis progression analysis with three complementary clustering approaches, mclust [5], fdapace [6], and gbmt [7] that represent distinct methodological paradigms widely applied in longitudinal healthcare research. These three methods collectively span probabilistic (mclust), functional (fdapace), and parametric trajectory-based (gbmt) approaches. We assessed the quality of each resulting clustering solution using the Adjusted Rand Index, an external validation metric that quantifies the agreement between the clustering assignments and a predefined target variable. The results of this comparison, reported in [8], show the robustness of our approach.
To ensure usability and correctness, we provide a well-documented example that serves as a functional demonstration of the software’s capabilities. This example guides users through the complete workflow, encompassing data preprocessing and clustering, as well as visualization and interpretation of results.
The software repository includes:
Sample input datasets, illustrating typical longitudinal data formats;
Step-by-step scripts, showing how to run LongitProgression from the start to the end of the pipeline;
Expected outputs (e.g., cluster assignments, plots, statistics), allowing users to verify that the software is working as intended in their environment.
This example is designed to be run with minimal setup, and it provides immediate feedback on whether the software is functioning correctly. Users can validate the installation and functionality simply by executing the provided example scripts and comparing their outputs with the reference results.
Testing Framework
This section describes the testing plan and each test designed to ensure the reliability and correctness of our time-series clustering pipeline. We performed formal testing using the Pytest framework. Test specifications and related code are available on the GitHub repository.
The testing framework includes module-level unit tests focused on the two main pipeline components, i.e., the Data Processing module of the Util_DataPreprocessing package and the Data Learning module of the Util_Learning package, complemented by a single end-to-end integration test for the LongProgressionClustering entry point of the LongitProgressionClust package.
These tests enhance confidence in both the functionality of individual components and the overall system’s ability to deliver stable and interpretable results.
Data Processing Module – The tests for data processing are designed to verify that the basic building blocks — normalizing values, assembling time-series tensors, plotting summaries, and exporting clusters — work as expected.
test_get_longitudinal_tensor_minmax_single_feature: it is used to verify the normalization for a single feature, by checking that Min–Max Scaling on a set of given numbers really stretches them into the 0–1 range and that Standard Scaling really re-centers them around zero with a sensible spread. They also confirm that the function remembers the original minimum/maximum or mean/standard deviation that will be used later to perform de-normalization.
test_get_longitudinal_tensor_two_features: it extends the previous test by considering two independent features with three subjects and two visits, deliberately assigning distinct value ranges to each feature. The test confirms that each feature is normalized with respect to its own extrema, unaffected by the scale of the other feature. It cross-checks the produced matrices against closed-form expectations and verifies, feature by feature, that the stored parameters reflect the correct minima and maxima.
test_get_multivariate_ts: it verifies the construction of the multivariate tensor. Using the Min–Max–normalized outputs, a test with one feature and three subjects verifies that the tensor shape (s,v,f) is compliant with the implementation requirements, i.e., the number of subjects (s), the number of visits (v), and the number of features (f), and it inspects the numerical agreement with the expected normalized values.
test_minimo_get_longitudinal_tensor: it provides a simple example of how to prepare longitudinal data. Firstly, it creates a small dataset comprising two individuals on two visits. Secondly, it calls the preparation routine that organises and scales those values over time. Then, it verifies that the transformed numbers are coherent, and the function also retains the essential information required to convert the results back to the original units at a later stage. Finally, it confirms that the list of all subjects, as well as those present at the first visit, matches the dataset. In short, it’s a quick sanity check to ensure that the reading, transformation, and summarisation of the data behave as expected in this simple case.
test_standard_scaler_min: This test involves a small example consisting of two people measured across two visits with a single measurement, and it runs the data-preparation step that standardizes the values. What is expected by this test is that after preparation, the numbers are distributed around a typical value and share a consistent scale, making different records directly comparable. The test also checks that the function keeps the key summary information it will need later to translate results back into the original units. Finally, it confirms that the list of all subjects and the subset present at the first visit matches the dataset. In short, it’s a quick confidence check that standardization and basic information storing behave sensibly on a small and clear case.
Data Learning Module – Tests of this module verify how clustering is performed by separating the orchestration process from the underlying technique. The tests demonstrate that the context effectively delegates work to the current strategy and that strategies can be swapped without affecting the rest of the code. The tests also verify that the time-series K-Means strategy i) is compliant with its settings (such as the number of clusters and the distance metric), ii) operates on the data it receives, and iii) returns coherent cluster barycentres and labels. The tests also cover practical scenarios, such as providing initial barycentres, changing parameters between runs, observing the changes, trying different metrics, and visualizing errors from the underlying model. In short, the tests ensure that the learning layer is both flexible and trustworthy: flexible thanks to the strategy pattern, and trustworthy in that it respects configuration and does not hide problems.
test_context_delegation_and_switch: the strategy pattern is validated first at the context level. Two synthetic strategies that return distinct outputs are provided in sequence to ClusteringContext. Invocations before and after switching the strategy confirm that the context delegates correctly and that the dynamic replacement of the strategy alters results as intended. The concrete strategy TimeSeriesKMeansClustering is then assessed without relying on the real tslearn dependency. Prior to importing the module under test, a stand-in TimeSeriesKMeans is injected, which records its constructor arguments, returns fixed labels, and exposes mock centroids. The strategy is instantiated with a known configuration and applied to a symbolic dataset. The test verifies that the underlying estimator is constructed with exactly the forwarded parameters, including the fixed random_state, that it receives the dataset through fit_predict, and that the strategy returns the expected pair of centroids and labels.
test_timeseries_kmeans_is_subclas: it verifies the conformance to the abstract interface by asserting that TimeSeriesKMeansClustering is a subclass of ClusteringStrategy, thereby ensuring that the concrete implementation satisfies the contractual requirements imposed by the context.
LongProgressionClustering Module – The integration tests simulate a complete run of the pipeline, from reading the configuration and preparing the data to running clustering and computing metrics. They replace complex processes, such as real clustering, plotting, and file I/O, with simple stand-ins. This ensures the tests remain fast and makes it easy to verify that information flows correctly through the system. First, the test code creates a few small ‘fake’ helper objects that behave like the real components that your pipeline would normally use. With these helpers in place, the main ‘happy path’ test calls the main function once and then verifies that each stage behaved as intended. It confirms that the clustering model was created with the correct settings (i.e., the number of clusters and the distance metric), that the dataset passed through clustering is the one produced by the data preparation step, and that the three quality metrics were requested with the correct inputs. The test also confirms that the outputs are correctly produced, i.e., i) the cluster saving routine receives the correct subjects, labels, and paths, ii) the plotting routine receives the correct centroids and display options, and iii) the final text summary of metrics matches the expected wording.
A second test focuses on failure handling. The clustering step is made to throw an error, which is then confirmed to reach the caller so that it is not silently hidden. It also ensures that the pipeline does not attempt to save a metrics summary after a failed run. This ensures that the overall process behaves sensibly in the event of an error.
A third test examines an important yet small detail: the operating system separator value accepted by your main function. The test runs the pipeline with different separators and ensures that this value is passed to all the necessary places (saving clusters, plotting, and saving metrics). This protects against subtle errors when creating file paths on different systems. In short, these integration tests realistically simulate the pipeline while ensuring it remains safe, fast, and observable. They confirm that i) configuration values are read, transformed, and passed correctly, ii) the clustering and metric steps are invoked with the right data, iii) outputs are formed as expected, and iv) errors and platform-specific details are handled properly.
(2) Availability
Operating system
This package is platform-independent, so it can be run on any operating system (GNU/Linux, Mac OSX, Windows) that supports Python.
Programming language
Python > = 3.12
Additional system requirements
None
Dependencies
NumPy version: 1.26.4 - Pandas version: 2.2.3 - Matplotlib version: 3.10.0 - Seaborn version: 0.13.2 - tslearn version: 0.6.3 - SciPy version: 1.14.1 - scikit-posthocs version: 0.11.2 - Tkinter version: 8.6
List of contributors
P.R. designed and developed the algorithm, preprocessed data, performed the tests, and contributed to the article’s writing. C.D.N. preprocessed data and contributed to the article’s writing. G.P. worked on the development of the algorithm, preprocessed data, and contributed to the article’s writing. M.M. preprocessed data and contributed to the article’s writing.
Software location
Archive
Name: Zenodo
Persistent identifier: https://doi.org/10.5281/zenodo.16419984
Licence: GNU General Public License (GPL-3.0)
Publisher: Patrizia Ribino
Version published: 1.0.0
Date published: 25/07/25
Code repository
Name: GitHub
Persistent identifier: https://github.com/PatriziaRibino/LongitProgression
Licence: GNU General Public License (GPL-3.0)
Date published: 15/01/25
Language
English
(3) Reuse potential
LongitProgression offers powerful capabilities for analyzing and interpreting complex time-series medical data, enabling the exploration of several important research questions. Key areas of investigation could include:
Early Detection of Disease Onset: Longitudinal clustering with LongitProgression can effectively identify prodromal symptoms of early stages of disease progression. By analysing temporal patterns in clinical or biomarker data, it is possible to detect early indicators of disease onset long before clinical diagnosis. Specific time points and trends in patient data can be identified as the most predictive markers for the emergence of early disease stages, as already demonstrated in [9, 11].
Patients Stratification and Heterogeneity: Longitudinal clustering with LongitProgression can reveal how different patient subgroups—defined by behavioural, clinical, or biomarker data—progress through disease stages over time. LongitProgression detects distinct patterns in the temporal progression of symptoms, allowing for the identification of patient subtypes incurring in different disease progressions, as already employed in [10, 15]. In this direction, the tool could uncover novel disease subtypes that are not detectable through traditional cross-sectional analysis and could respond differently to treatments, providing deeper insights into disease heterogeneity.
Treatment efficacy on Disease Progression: Longitudinal clustering with LongitProgression could effectively track the impact of treatments or interventions over time in patient subgroups. To cite a work, in [17], the longitudinal changes in the treatment effect of patients were clustered to identify key differences. LongitProgression can reveal both positive and negative treatment effects during disease progression by analysing temporal trends and patient data. Clustering techniques also pinpoint the effects of treatments at specific time points, helping to identify optimal windows for intervention and improving the precision of therapeutic strategies.
Development of Predictive Models: Time-series clustering is critical in developing predictive models that forecast disease progression by analysing early temporal patterns in medical data. By integrating the results of longitudinal clustering with neural network techniques, the prediction accuracy for future disease stages could be significantly enhanced, providing more reliable and timely forecasts [18, 19].
Moreover, the LongitProgression tool improves longitudinal clustering studies by providing:
an easy-to-use interface allowing for step-by-step execution of the different stages typical of the longitudinal clustering workflow;
an integrated tool for clustering, statistical analysis, and visualization;
a modular architecture that facilitates adaptation to different datasets and application domains;
seamless integration with widely adopted Python libraries to support advanced machine learning pipelines;
a freely accessible tool enabling both scientists and physicians to explore research questions that impact clinical practice and public health.
Beyond its application in the medical domain, LongitProgression can be adapted for use across various scientific and industrial fields that involve longitudinal or temporal data. Potential reuse includes:
Social Sciences and Education: Exploring how social behaviour, academic performance, or policy effects evolve across longitudinal cohorts.
Environmental and Climate Research: Clustering multi-dimensional environmental indicators (e.g., temperature, emissions, biodiversity) across temporal scales to study ecosystem changes or climate anomalies.
Economics and Market Research: Detecting temporal patterns in consumer behaviour, economic indicators, or financial trends.
Due to its open-source design, the tool can be extended in several ways:
Custom Clustering Algorithms: The default k-means clustering can be replaced with other algorithms (e.g., fuzzy clustering, Gaussian mixture models) to better accommodate different data characteristics such as heterogeneity, dimensionality, or variability.
Domain-Specific Preprocessing: The preprocessing pipeline can be customized to include tailored feature engineering, normalization, or filtering methods.
Advanced Visualization: The software can be extended to include interactive or web-based visualizations (e.g., using Plotly) for richer user interaction.
The software is completely open-source, downloadable from a publicly accessible GitHub repository, and linked to related publications. This enables users to benefit from the latest developments and contribute to its progressive refinement.
Researchers interested in adapting or extending LongitProgression, reporting issues, or collaborating on larger research initiatives are encouraged to contact the development team directly via email at patrizia.ribino@icar.cnr.it.
Acknowledgements
We would like to thank Francesca Gasparini and Davide Chicco for their valuable collaboration in research activities that used the LongitProgression software. Their contributions have played an important role in demonstrating and validating the applicability of the tool in real-world biomedical research settings.
Competing Interests
The authors have no competing interests to declare.