
Table 1
Overlapping Assessments Provided in Each Project.
| PROJECT | |||||||||
|---|---|---|---|---|---|---|---|---|---|
| ASSESSMENT | SUBTEST | 1 | 2 | 3 | 5 | 6 | 7 | 8 | 9 |
| CTOPP | X | X | X | X | |||||
| CTRS | X | X | |||||||
| KBIT | X | X | X | ||||||
| SSRS | X | X | X | X | X | X | X | X | |
| SWAN | X | X | X | X | X | ||||
| TOLD | X | X | X | ||||||
| TOPEL | Print Knowledge | X | X | ||||||
| TOSREC | X | X | X | ||||||
| WJ_III | Academic Knowledge | X | X | X | X | X | |||
| Applied Problems | X | ||||||||
| Letter-word ID | X | X | X | X | X | X | X | X | |
| Math fluency | X | ||||||||
| Passage Comprehension | X | X | X | X | X | X | X | X | |
| Picture Vocabulary | X | X | X | X | X | X | X | X | |
| Quantitative Concepts | X | ||||||||
| Sound awareness | X | X | X | ||||||
| Spelling | X | X | X | X | X | ||||
| Word Attack | X | X | X | X | X | X | X | X | |
| Writing Fluency | X | X | X | X | |||||
[i] Note: CTOPP = Comprehensive Test of Phonological Processing. CTRS = Conners Teacher Rating Scale. KBIT = Kaufmann Brief Intelligence Test. SSRS = Social Skills Rating Scale. SWAN = The Strengths and Weaknesses of ADHD Symptoms and Normal Behavior Scale. TOLD = Test of Language Development. TOPEL = Test of Preschool Early Literacy. TOSREC = Test of Silent Reading Efficiency and Comprehension. WJ-III = Woodcock Johnson Test of Achievement, third edition.
Table 2
Select Student Demographics.
| VARIABLE | PROJECT | 1 | 2 | 3 | 5 | 6 | 7 | 8 | 9 | TOTAL PHASE I | PHASE II |
|---|---|---|---|---|---|---|---|---|---|---|---|
| Gender | Female | 338 | 281 | 183 | 354 | 219 | 242 | 175 | 241 | 2033 | 216 |
| Male | 301 | 233 | 148 | 363 | 175 | 238 | 184 | 271 | 1913 | 223 | |
| Missing | 2 | – | – | 87 | 1 | – | – | – | 90 | 3 | |
| Race | American Indian/Alaskan Native | – | 3 | 2 | – | 1 | – | 1 | 1 | 8 | 1 |
| Asian | 12 | 7 | 11 | 12 | 18 | 22 | 12 | 9 | 103 | 9 | |
| Black | 340 | 298 | 149 | 334 | 154 | 183 | 182 | 25 | 1665 | 150 | |
| Hawaiian/Pacific Islander | 4 | 18 | – | – | – | 1 | – | 3 | 23 | 1 | |
| White | 222 | 150 | 151 | 245 | 182 | 233 | 113 | 419 | 1715 | 238 | |
| Multiracial | 6 | 23 | 13 | 6 | 12 | 21 | 17 | 31 | 129 | 16 | |
| Other | 3 | 10 | 2 | 24 | 5 | 20 | 32 | 19 | 115 | 14 | |
| Missing | 54 | 5 | 3 | 183 | 23 | – | 2 | 5 | 275 | 13 | |
| Ethnicity | Hispanic | 28 | 39 | 18 | 17 | 7 | 17 | 14 | 33 | 173 | 16 |
| Non–Hispanic | 534 | 472 | 292 | 621 | 370 | 463 | 344 | 474 | 3570 | 415 | |
| Missing | 79 | 3 | 21 | 166 | 18 | – | 1 | 5 | 293 | 11 | |
| FARL | Eligible | 316 | 260 | 86 | 391 | 146 | 126 | 146 | – | 1471 | 134 |
| Not eligible | 302 | 235 | 146 | 264 | 218 | 125 | 100 | – | 1390 | 159 | |
| Missing | 23 | 19 | 99 | 149 | 31 | 229 | 113 | 512 | 1175 | 149 | |
| LEP | Yes | 15 | 9 | 4 | 18 | 4 | – | – | – | 50 | 3 |
| No | 623 | 496 | 317 | 744 | 391 | 251 | 246 | – | 3068 | 311 | |
| Missing | 3 | 9 | 10 | 42 | – | 229 | 113 | 512 | 918 | 128 | |
| ESE | Receiving | 1 | – | – | – | – | – | – | 11 | 12 | 4 |
| Not receiving | 29 | 2 | – | 129 | 76 | 52 | 39 | 14 | 341 | 39 | |
| Missing | 611 | 512 | 331 | 675 | 319 | 428 | 320 | 487 | 3683 | 399 |
[i] Note: Due to its non-RCT status, Project 4 is not included.
FARL = Eligibility for Free or Reduced Lunch. LEP = considered limited proficient in English. ESE = Exceptional student education.
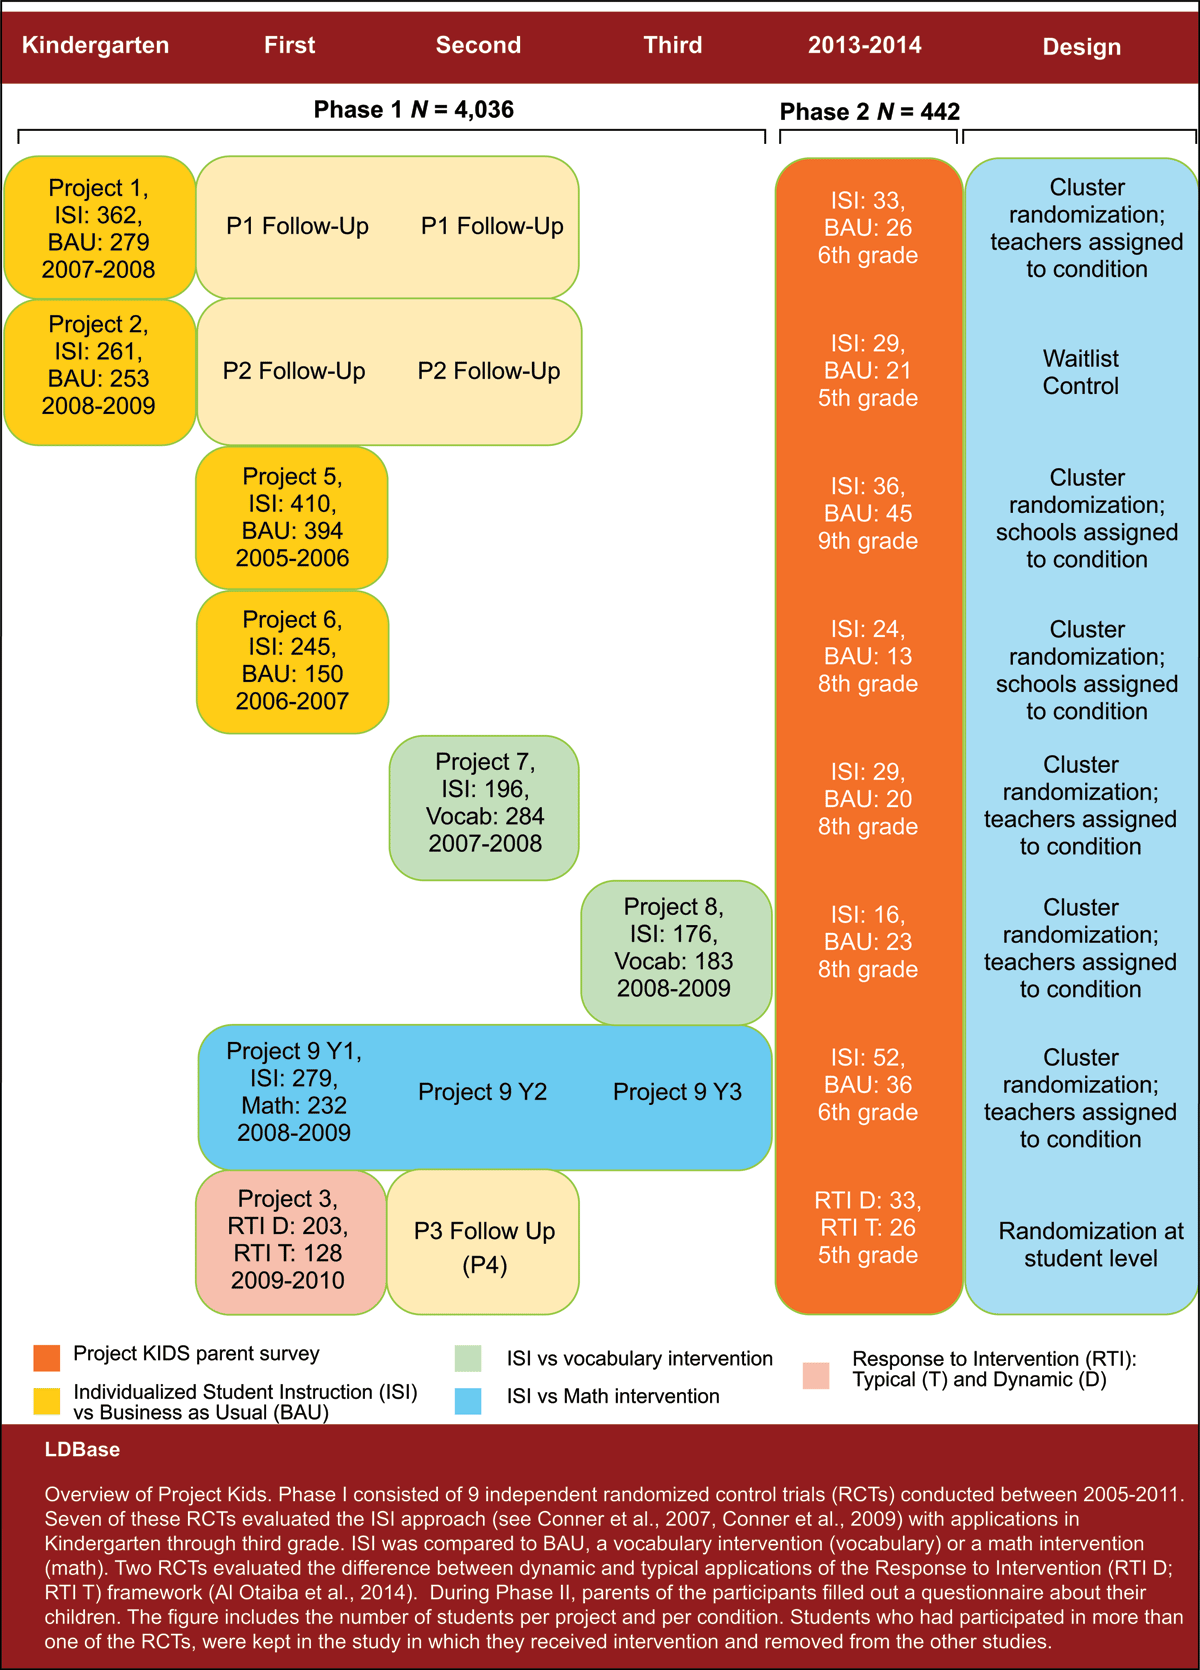
Figure 1
Overview of Project KIDS.
Note: Figure by van Dijk and colleagues [22], available at https://doi.org/10.6084/m9.figshare.16989652.v1 under a CC BY 4.0 license.