
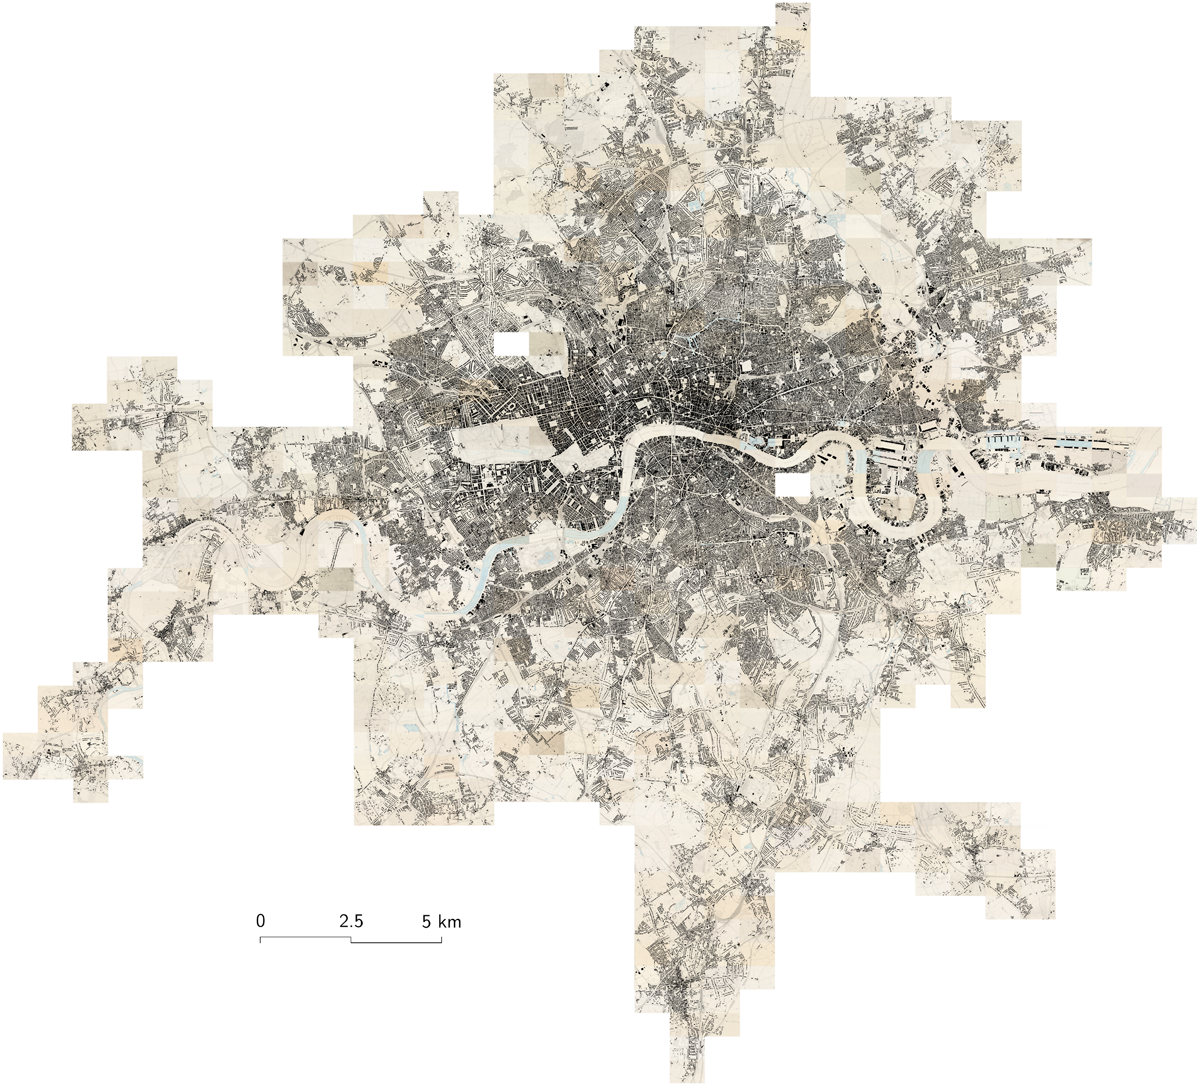
Figure 1
Overview of the London building footprints layer, overlaid on the georeferenced 1890s OS map. The building footprints are coloured in black.
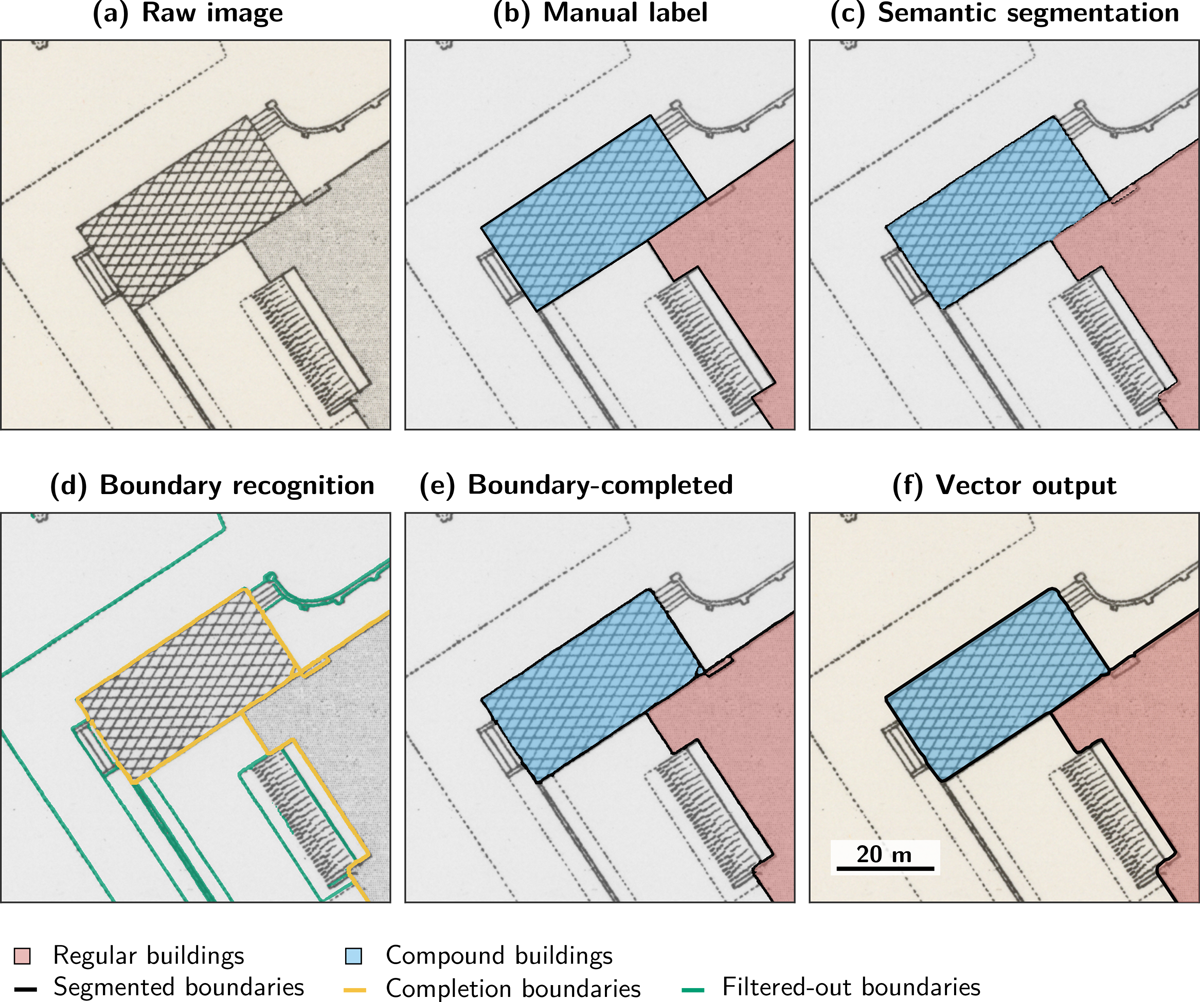
Figure 2
Overview of the footprint extraction method. (a) Initial map image; (b) Manual label of semantic classes (ground-truth); (c) Result of the London segmentation model; (d) Result of the specialist boundary-detection model, with selected boundaries in radius r ≤ 10 of building surfaces coloured in yellow and excluded ones in green; (e) Combined segmentation mask after boundary completion; (f) Final vector output.
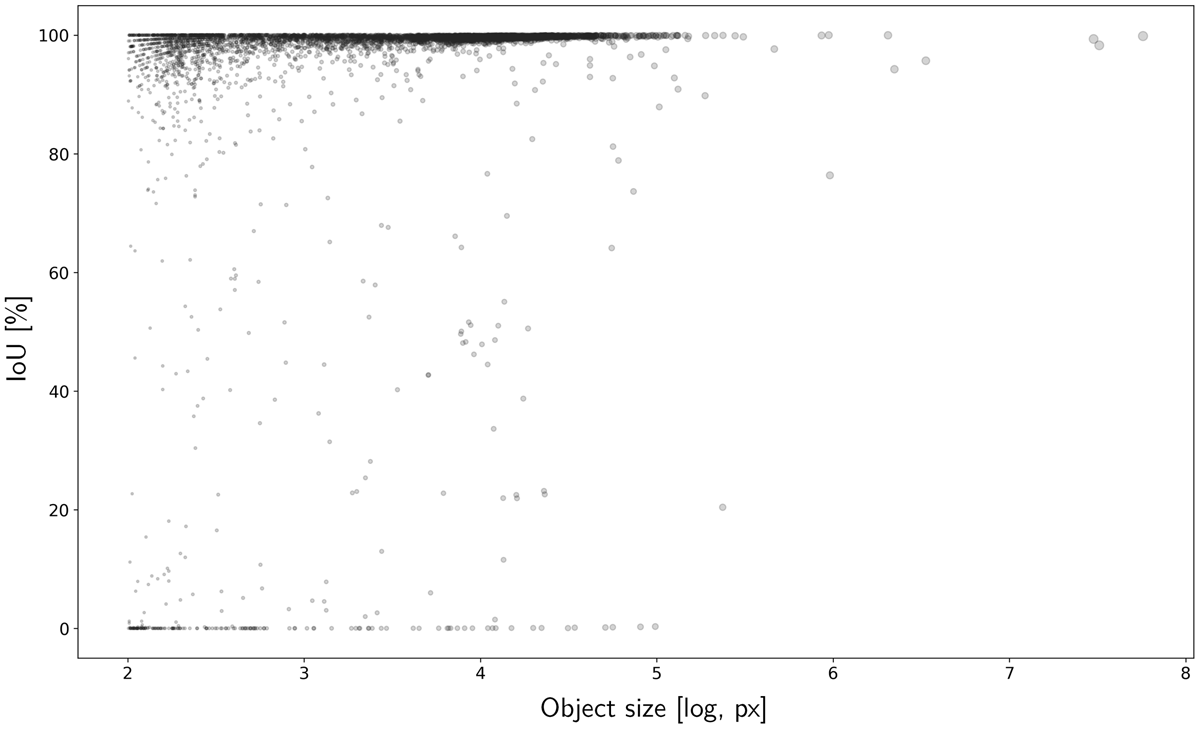
Figure 3
Evaluation of building detection, measured by the IoU, as a function of object size.
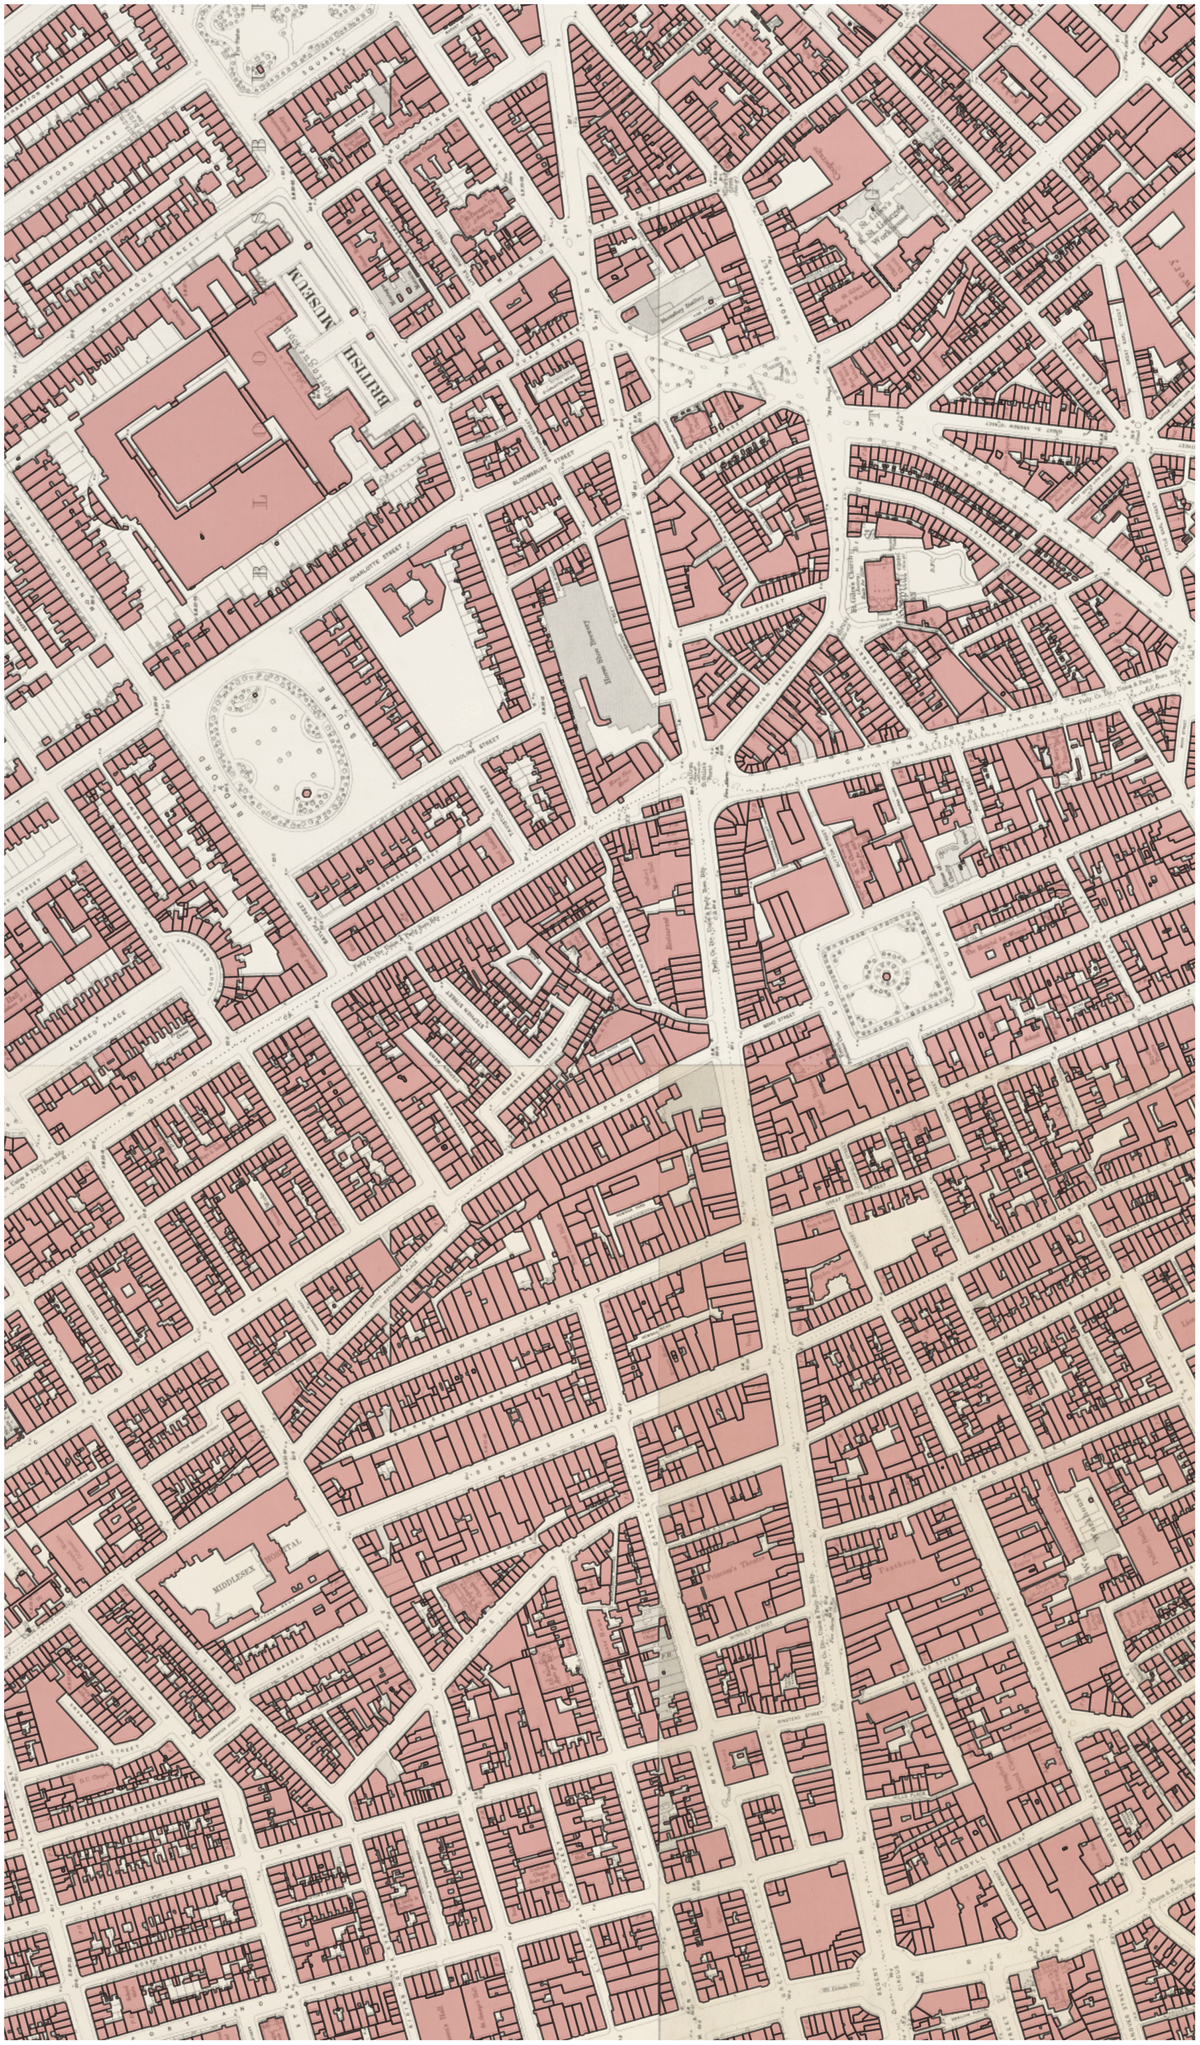
Figure 4
Example of vectorisation result, overlaid on the original georeferenced map layer.