
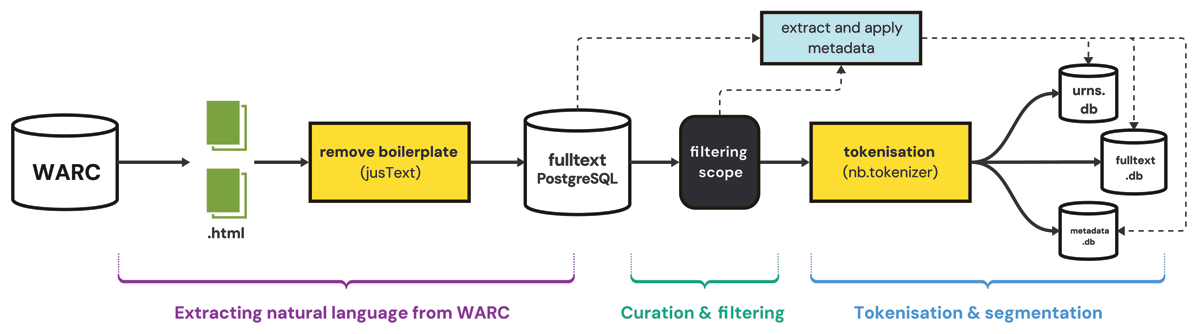
Figure 1
The key steps of the warc2corpus pipeline.
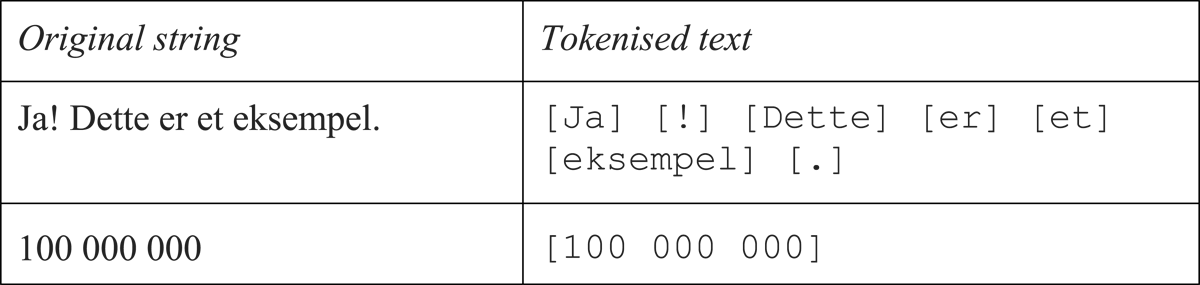
Figure 2
Comparison of text before and after tokenisation. Text within square brackets [] indicating separate tokens.
| Norwegian Bokmål: | 1 437 768 documents |
| Norwegian Nynorsk: | 111 892 documents |
| Northern Sámi: | 11 416 documents |
| Kven: | 302 documents |
| Southern Sámi: | 101 documents |
| Lule Sámi: | 78 documents |
| NRK: | 130 162 |
| VG: | 66 800 |
| Forskning.no: | 65 469 |
| TV2: | 55 367 |
| Dagens næringsliv: | 50 005 |
| Dagbladet: | 46 333 |
| Finansavisen: | 38 514 |
| Adresseavisen: | 33 640 |
| Aftenposten: | 31 075 |
| Khrono: | 29 794 |
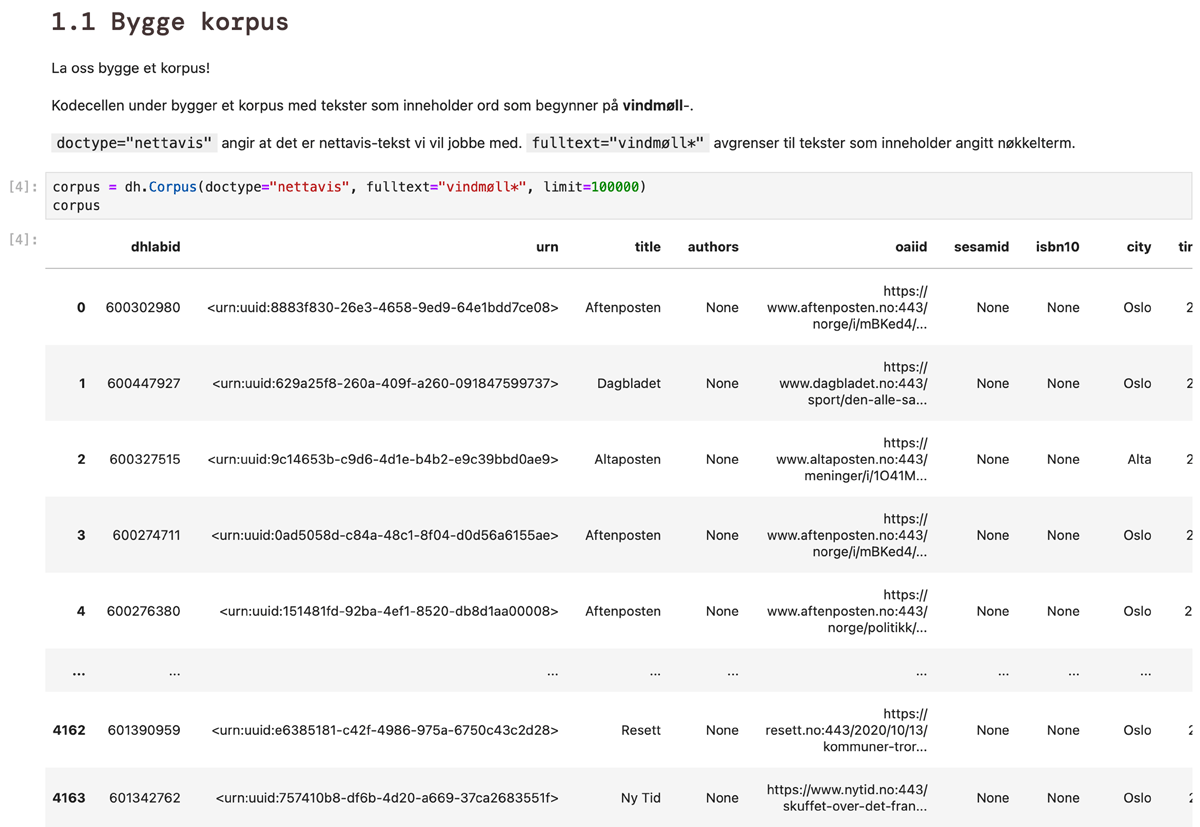
Figure 3
Displaying the dhlab data frame in a notebook.
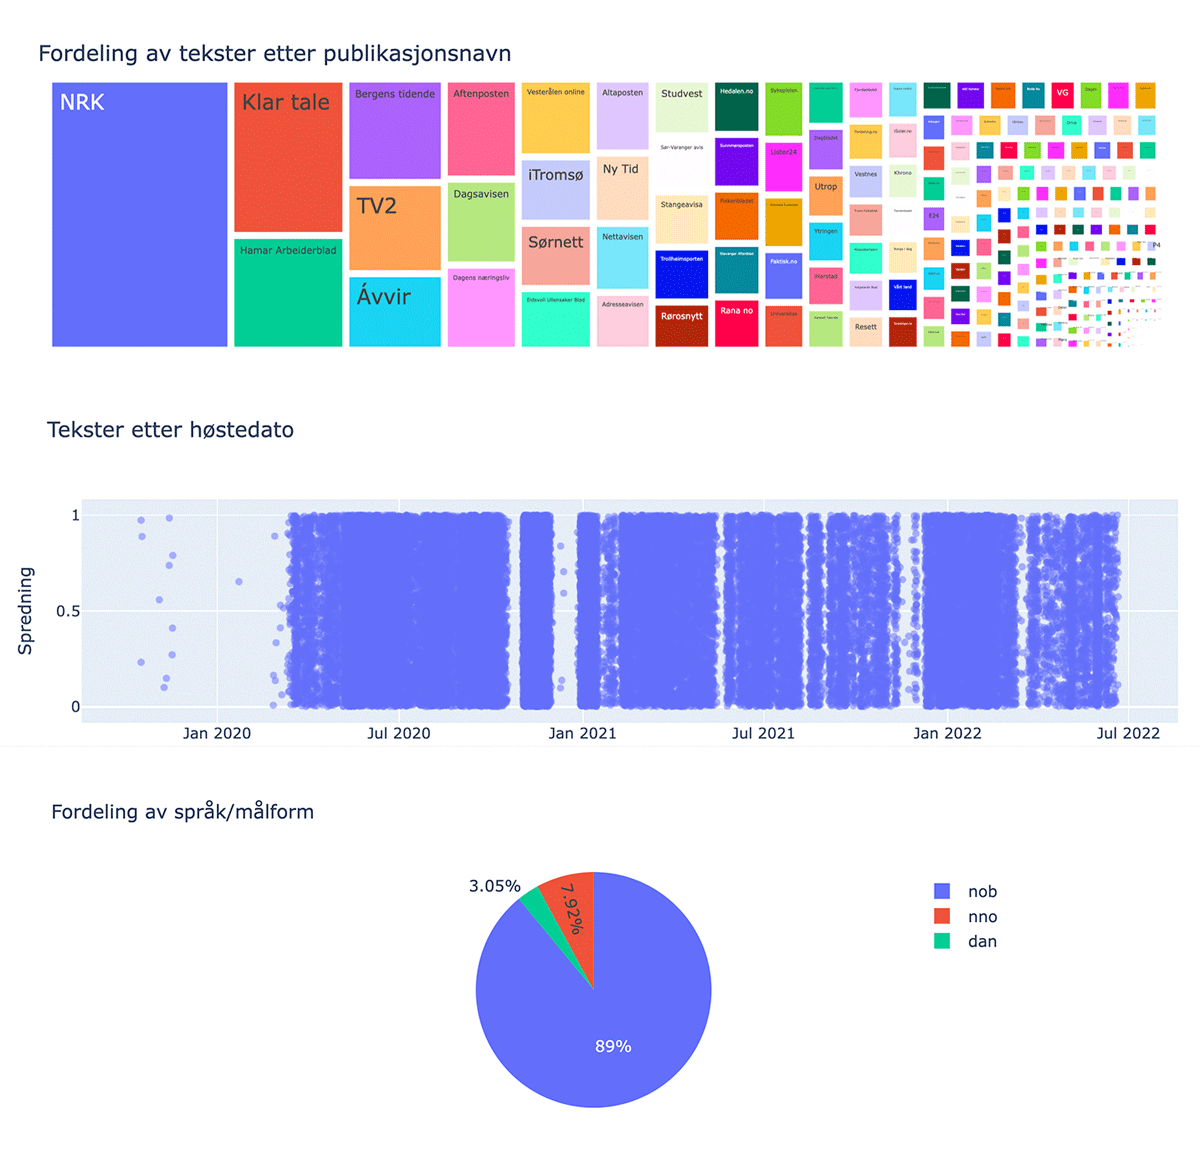
Figure 4
Visualising a corpus’ distribution of titles, harvesting dates and language.
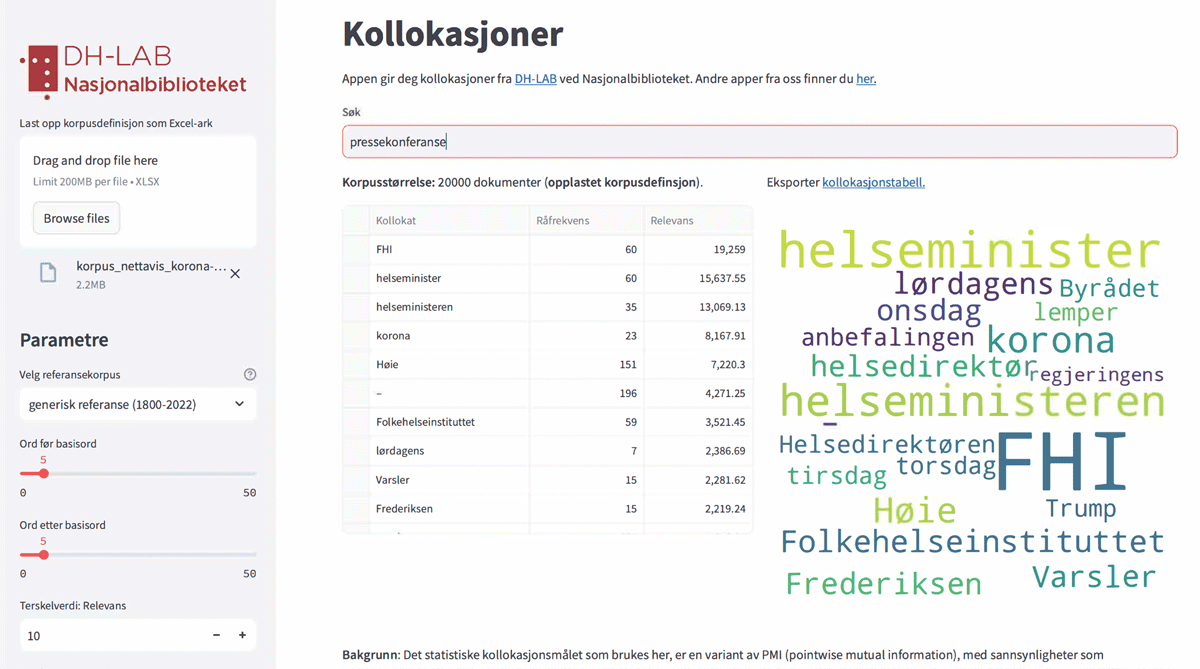
Figure 5
Interface of web application for collocation analysis. To the left, one can upload an Excel file with a corpus definition and adjust parameters. In the centre, one enters a keyword to retrieve the most frequent collocated words, before it is outputted in form of a table and a word cloud visualisation.