
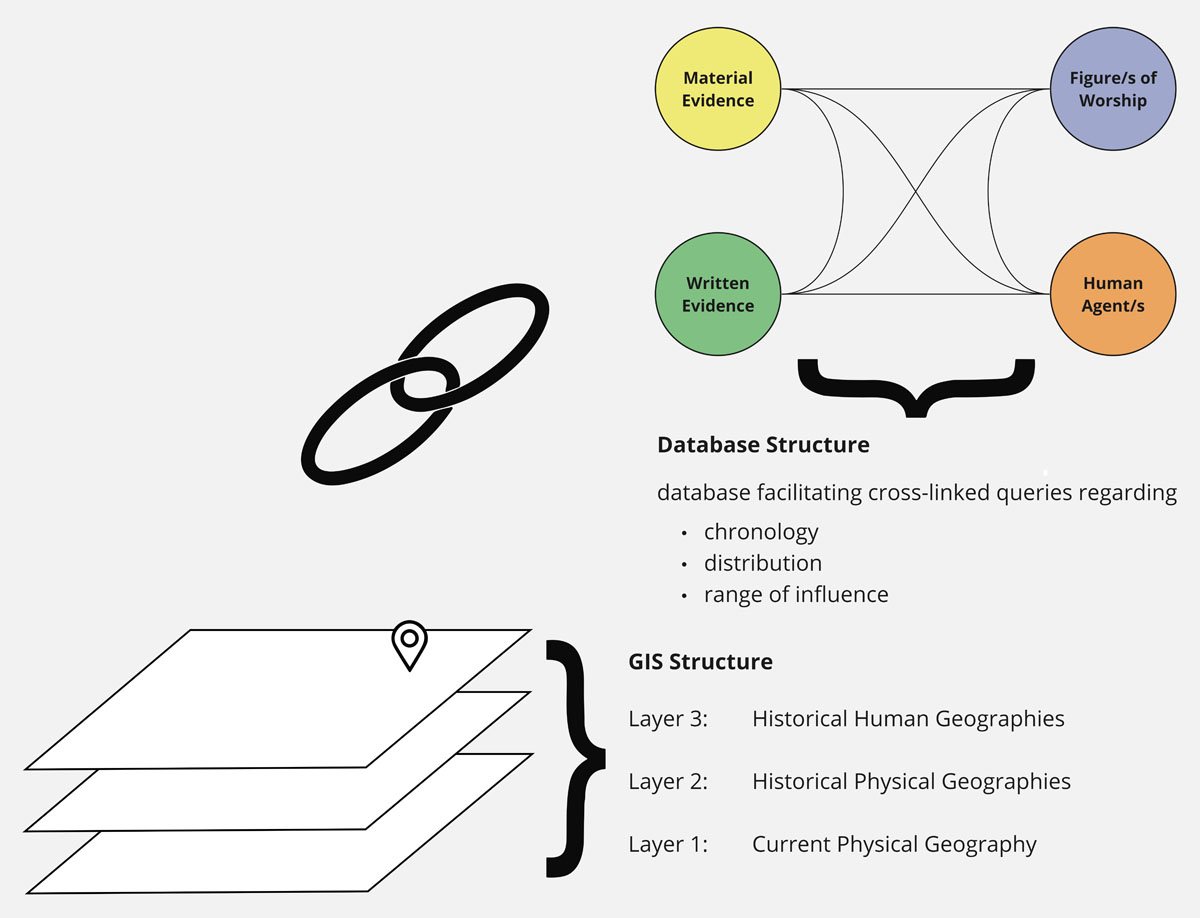
Figure 1
Simplified initial idea for the data structure.
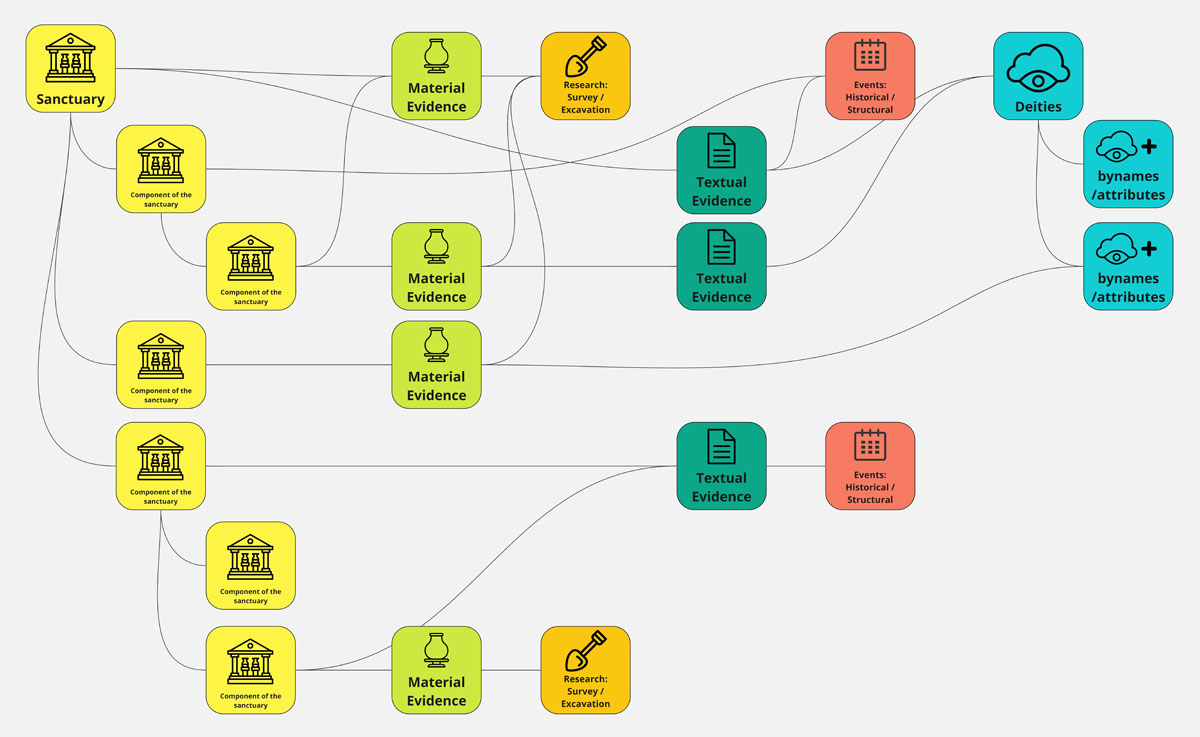
Figure 2
Schematic illustration of the structure of the data model, which visualizes the relationships between various data elements using an abstract example.
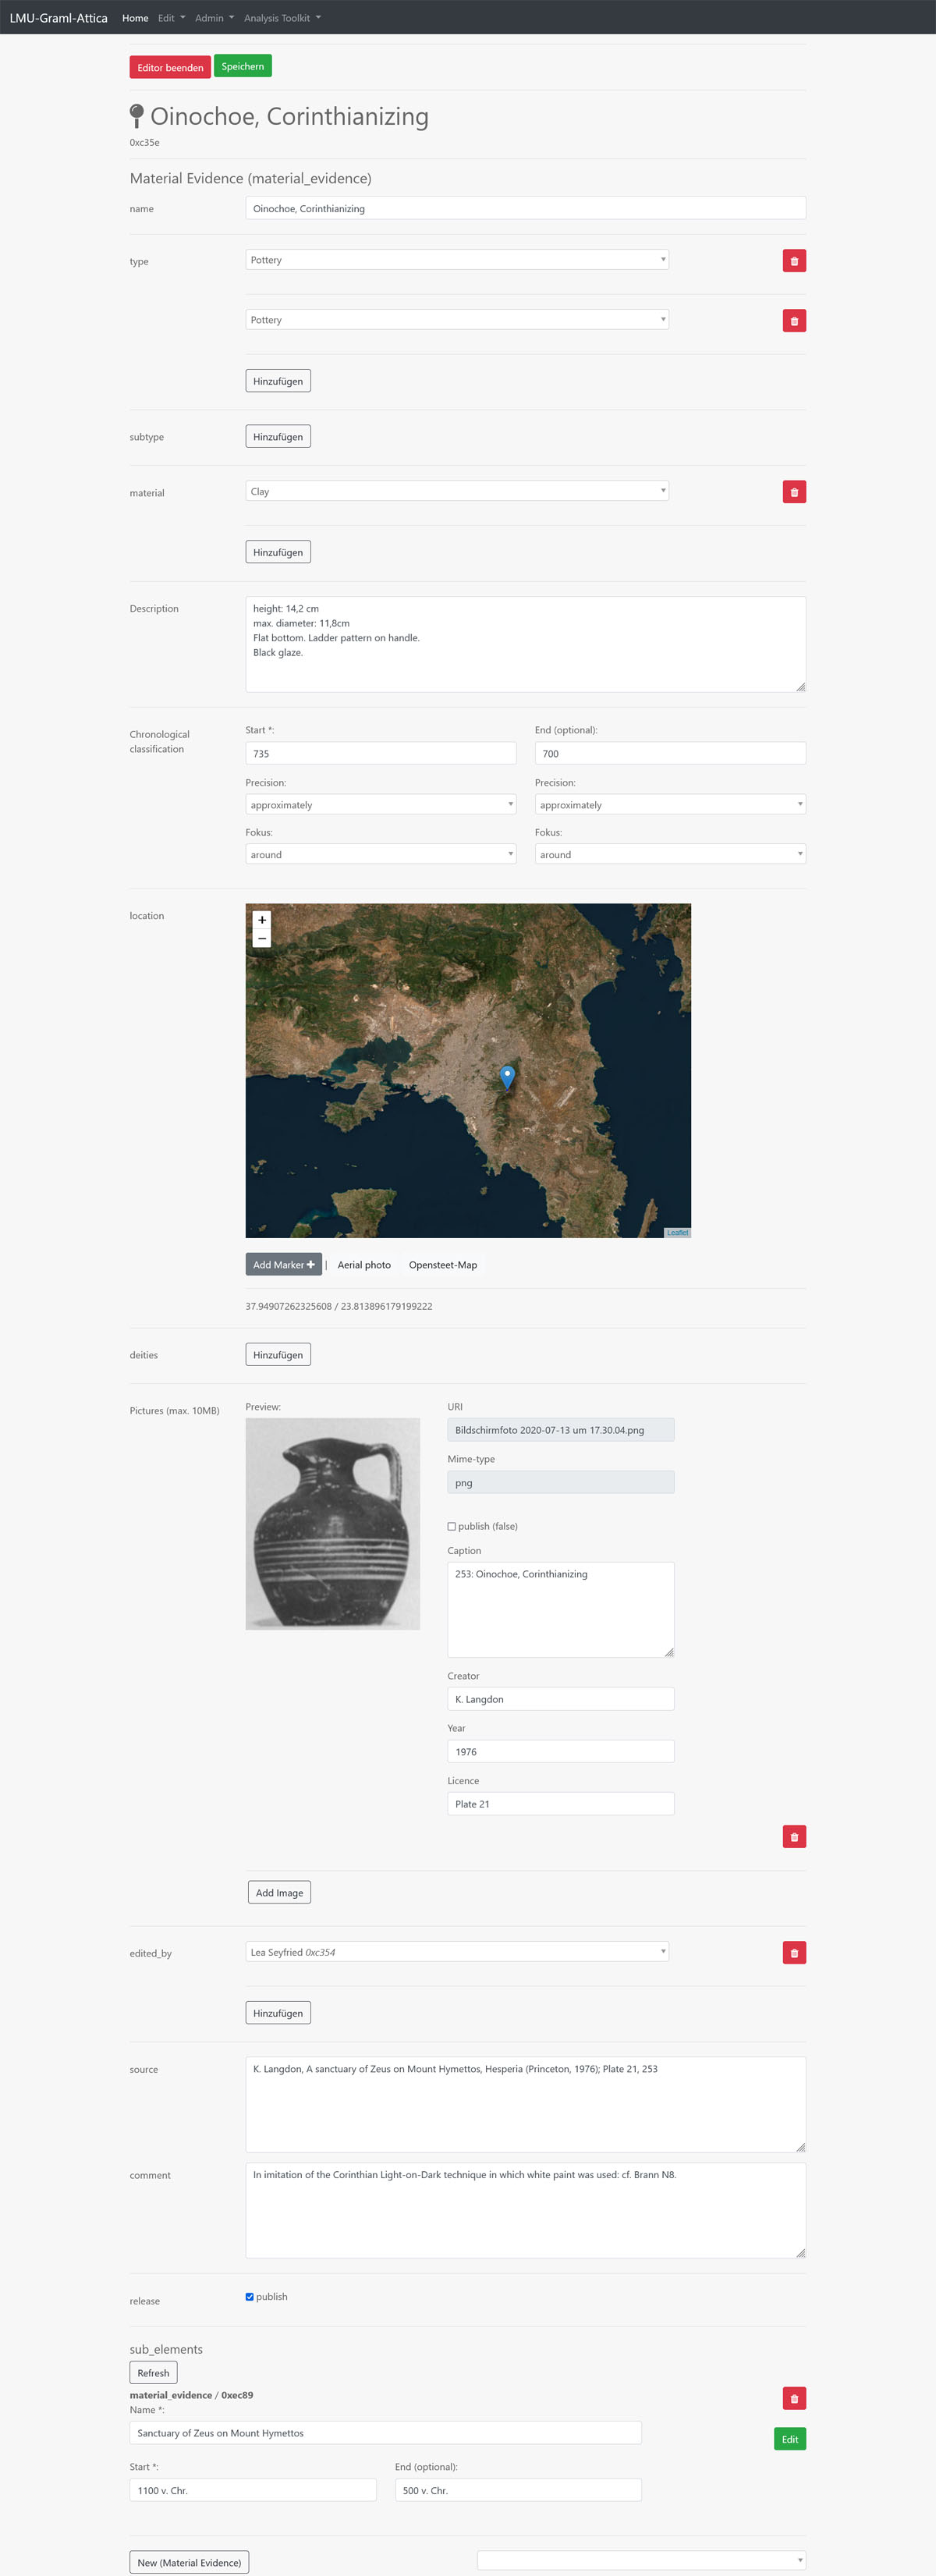
Figure 4
Screenshot of the editor interface. Intelligent fields and interactive elements assist the user in filling out the information. For example, geo-coordinates can be directly selected on an interactive map, and links can be conveniently chosen via drop-down menus.
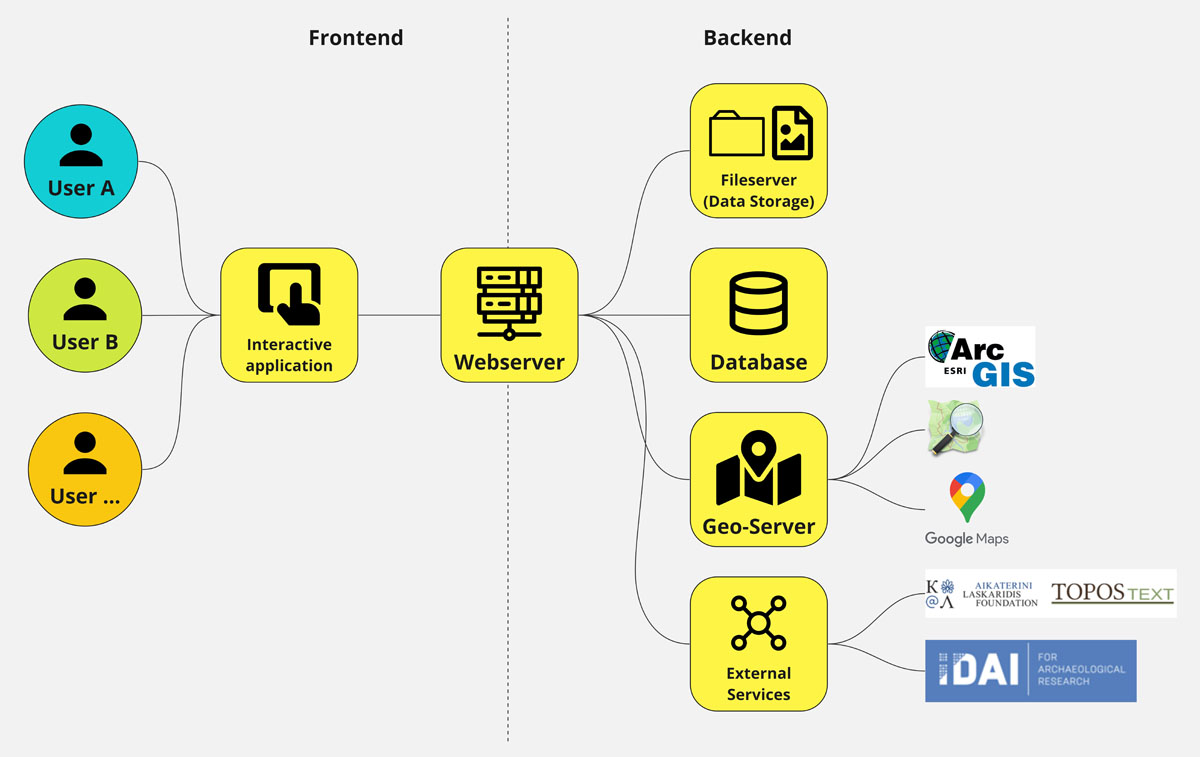
Figure 3
Schematic illustration of our technical structure, including the frontend and backend components as well as their linkage with other services and offerings (only in selection).