
(1) Introduction
Ancient Greek religion is deeply embedded in every aspect of life and provides the backbone of society and its multifaceted social networks.1 As a cultural and social phenomenon of high importance, research on religion has a longstanding tradition, which is deeply rooted in the historical sciences. Therefore, written testimonies (literary sources, epigraphy) and the religious cultures of historical periods have attracted significant scholarly attention. Despite the fact that material remains do exceed the amount of textual evidence by far, these two groups of evidence are seldom analysed together; the seemingly unambiguous word generally prevails. Instead, material evidence is often analysed with a focus on material groups and their spatial and chronological distribution. And many publications of Greek sanctuaries in fact emphatically lament when no written testimonies can plausibly be related to the site!
It is this scholarly trust in and dependence on written testimonies, which makes a new approach to the study of ancient Greek religion so essential – an approach that embraces archaeology to its fullest. To this end, we aim at making information deduced from material testimonies as transparent and retraceable as possible. Acknowledging increasing scholarly knowledge and the potential of re-interpreting old data, our data structure comprises the following types of data sets with the following primary traits (Figure 1):
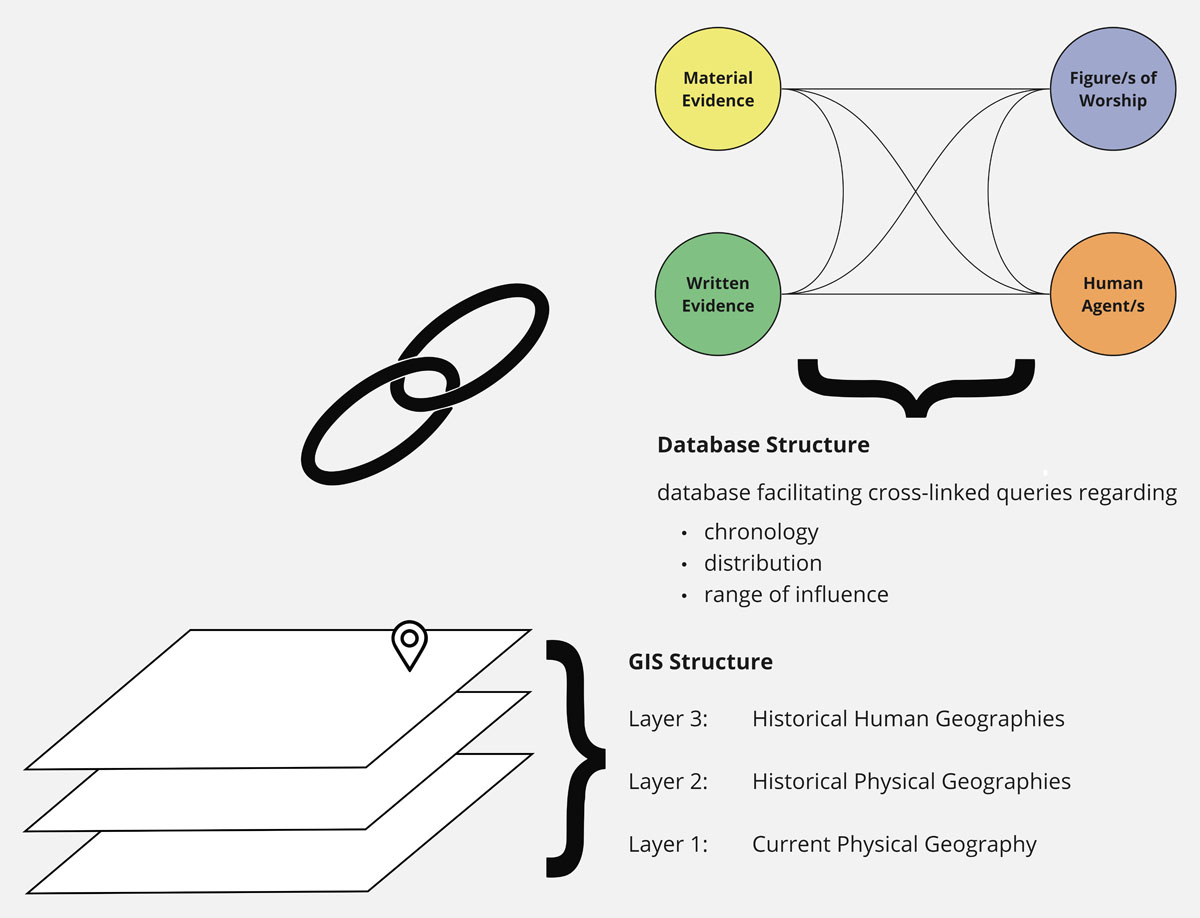
Figure 1
Simplified initial idea for the data structure.
Spatial analysis: current physical geography as basis for a reconstruction of the ancient physical geographies (time-specific) and embedded historical human geographies (political, social)
Object analysis: typology, chronology, morphological features, e.g. iconography
Text analysis: typology, chronology, scale of significance (local, Pan-Hellenic)
Based on the analysis of all data sets within the conventions of their respective fields, further traits can be ascribed by cross-referencing and by comparing data across time and space. These secondary traits require more interpretation, and thus have to be assigned with great care. Due to the ever-increasing amount of additional information, these ascribed secondary, interpretive traits have to be monitored and evaluated according to their validity. The number of cross-references to interpretative data is thus also exposed as a parameter so as to warn the user to make use of the data only with the requisite care.
(2) Method
Based on current approaches to ancient religion influenced by actor-network theory as well as landscape studies,2 the data structure needs to embrace spatial analysis in combination with object and text analysis. Current GIS (Geographic Information Systems) software already provides features that allow for the embedding of different testimonies and illustrate territorial dimensions and other man-made spatial attributions, such as references to political and administrative topography. The cult places provide the focal points for the embedding of object and text data.3 Therefore, all data sets share the same spatial unit and will eventually provide specific information on the characteristics of this place, such as the actual ritual practice detectable in the use of objects4 or from written testimony, the clientele of visitors/worshipers, or the expected outcome of these rituals providing insight on the divine figure(s) depicted and their attributed spheres of power. Moreover, the accumulation of diachronic data enables the observation of religious continuities, but also abrupt or subtle changes.
The spatiality of religious practice is not the only trait which can be used to conduct comparative investigations of the data set based on one shared trait. By clustering ritual objects of the same type, observations can be made on the attestation of a specific object group (e.g. a specific drinking vessel shape) at several places. This makes it possible to observe ritual particularities, e.g. of sub-regions, of cult places attributed to certain deities or of time-limited “fashions”.
(3) Data Model
During the project’s development, long before the educational event conducted by the authors, the final requirements had not yet been determined. The data obtained from the source review and the findings were therefore recorded in an Excel spreadsheet. This approach offered the advantage at that time that it was easy to handle and the file could be easily modified according to new data as well as synchronized with the project members. A complex server infrastructure was not necessary. In addition, digitized plans, sources, and photos could be stored in the same folder as the table.
In the course of our research and planning, however, the desire for a more robust, future system became clear, as did its requirements. This resulted in a precise data model that maps complex relationships between religion, geography, culture, and archaeology (Figure 2).
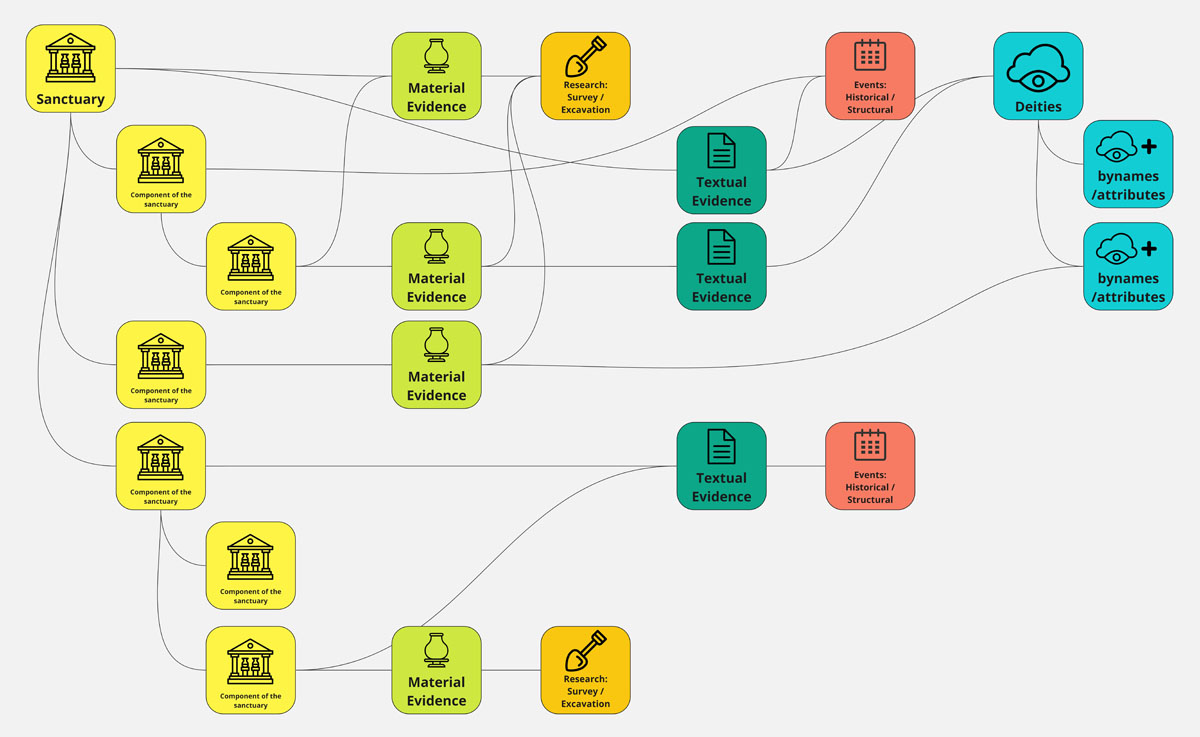
Figure 2
Schematic illustration of the structure of the data model, which visualizes the relationships between various data elements using an abstract example.
It is divided into the following main groups:
Geographic units, territories, and sacred districts
Sanctuaries
Architectural elements
Material finds
Textual sources
Research history and historical events
Deities
To be able to place the sanctuaries (2) and finds (4) in a coherent ancient context, it was important to us from the outset to also locate them on the modern map and to establish geographical units, territories, and sacred districts (1) according to ancient definitions. Thus, important geographical elements such as clearings, groves, rivers, or even sacred districts were created based on ancient sources. Such a dataset not only includes the location in the form of a polygon but also references to textual sources. For precise naming, external references were also included through the “iDAI Gazetteer ID” and “Topostext Place ID”. Integration of historical map material as a base map is also possible.
The sanctuaries (2) are, so to speak, the centre of our data model and are also the starting point for extensive networking. For scientific work, a finer subdivision into individual components, such as architectural elements (3), is often necessary. Our data model also allows us to create sub-elements at any level, starting from individual buildings to individual building blocks or decorative elements.5 Each of these elements has the same properties.
Material finds (4) or textual sources (5) can then be assigned to these. However, this assignment is not exclusive. Cross-references and multiple links with sub-elements or even an entire sanctuary are also possible. A good example might be a text that writes something about a sanctuary and then also goes into specific properties of the building or designs. Descriptions in written sources can also be precisely assigned to building parts or decorative elements. The same applies to finds.
In addition to linking textual sources and material finds with architectural elements, our data model also takes into account the dynamics and development of sanctuaries over time. This is made possible by integrating the history of research and historical events (6). It is not uncommon for a sanctuary to undergo various construction phases, renovations, or even redesigns over the centuries. These historical changes can be recorded in the data model and related to the respective cultural, political, or social contexts.
Another central aspect of the data model is the recording and analysis of the deities (7) worshipped in the respective sanctuaries. Each deity can be associated with specific rituals, myths, and cultural practices. By linking sanctuaries with the corresponding deities, patterns in religious practice and worship can be identified across different regions and periods.
(4) Technical Implementation
A central element of our research is the efficient and structured collection, processing, and analysis of data.6 To achieve this, we decided to use Dgraph as a database. Dgraph is a graph-based database characterized by its high scalability, flexibility, and the ability to efficiently map complex relationships in the data. Graph-based databases, like Dgraph, are particularly useful when data and their relationships to each other are the focus of the investigation. They allow complex links and networks to be intuitively represented and analysed, which is often more difficult and less efficient in relational databases.
This was particularly important for our project as the relationships between the various data points - from geographical units to sanctuaries to textual sources - were of central importance.
To optimize the data entry and management process, we developed a web-based input mask (Figure 4) with Ember.js. Ember.js, a modern frontend framework, enabled us to create a user-friendly and interactive interface. This was essential to ensure that the data is entered consistently and correctly, especially considering that our project was also conducted in an educational context and various users with different technical knowledge were involved. Through the web interface developed in Ember.js, it is possible for different people to work on the datasets simultaneously and independently of location. Furthermore, geocoordinates can be determined directly via the integrated GIS system, i.e., by clicking on a web map. For the respective objects, such as finds or architectural elements, media such as images can be uploaded as needed.
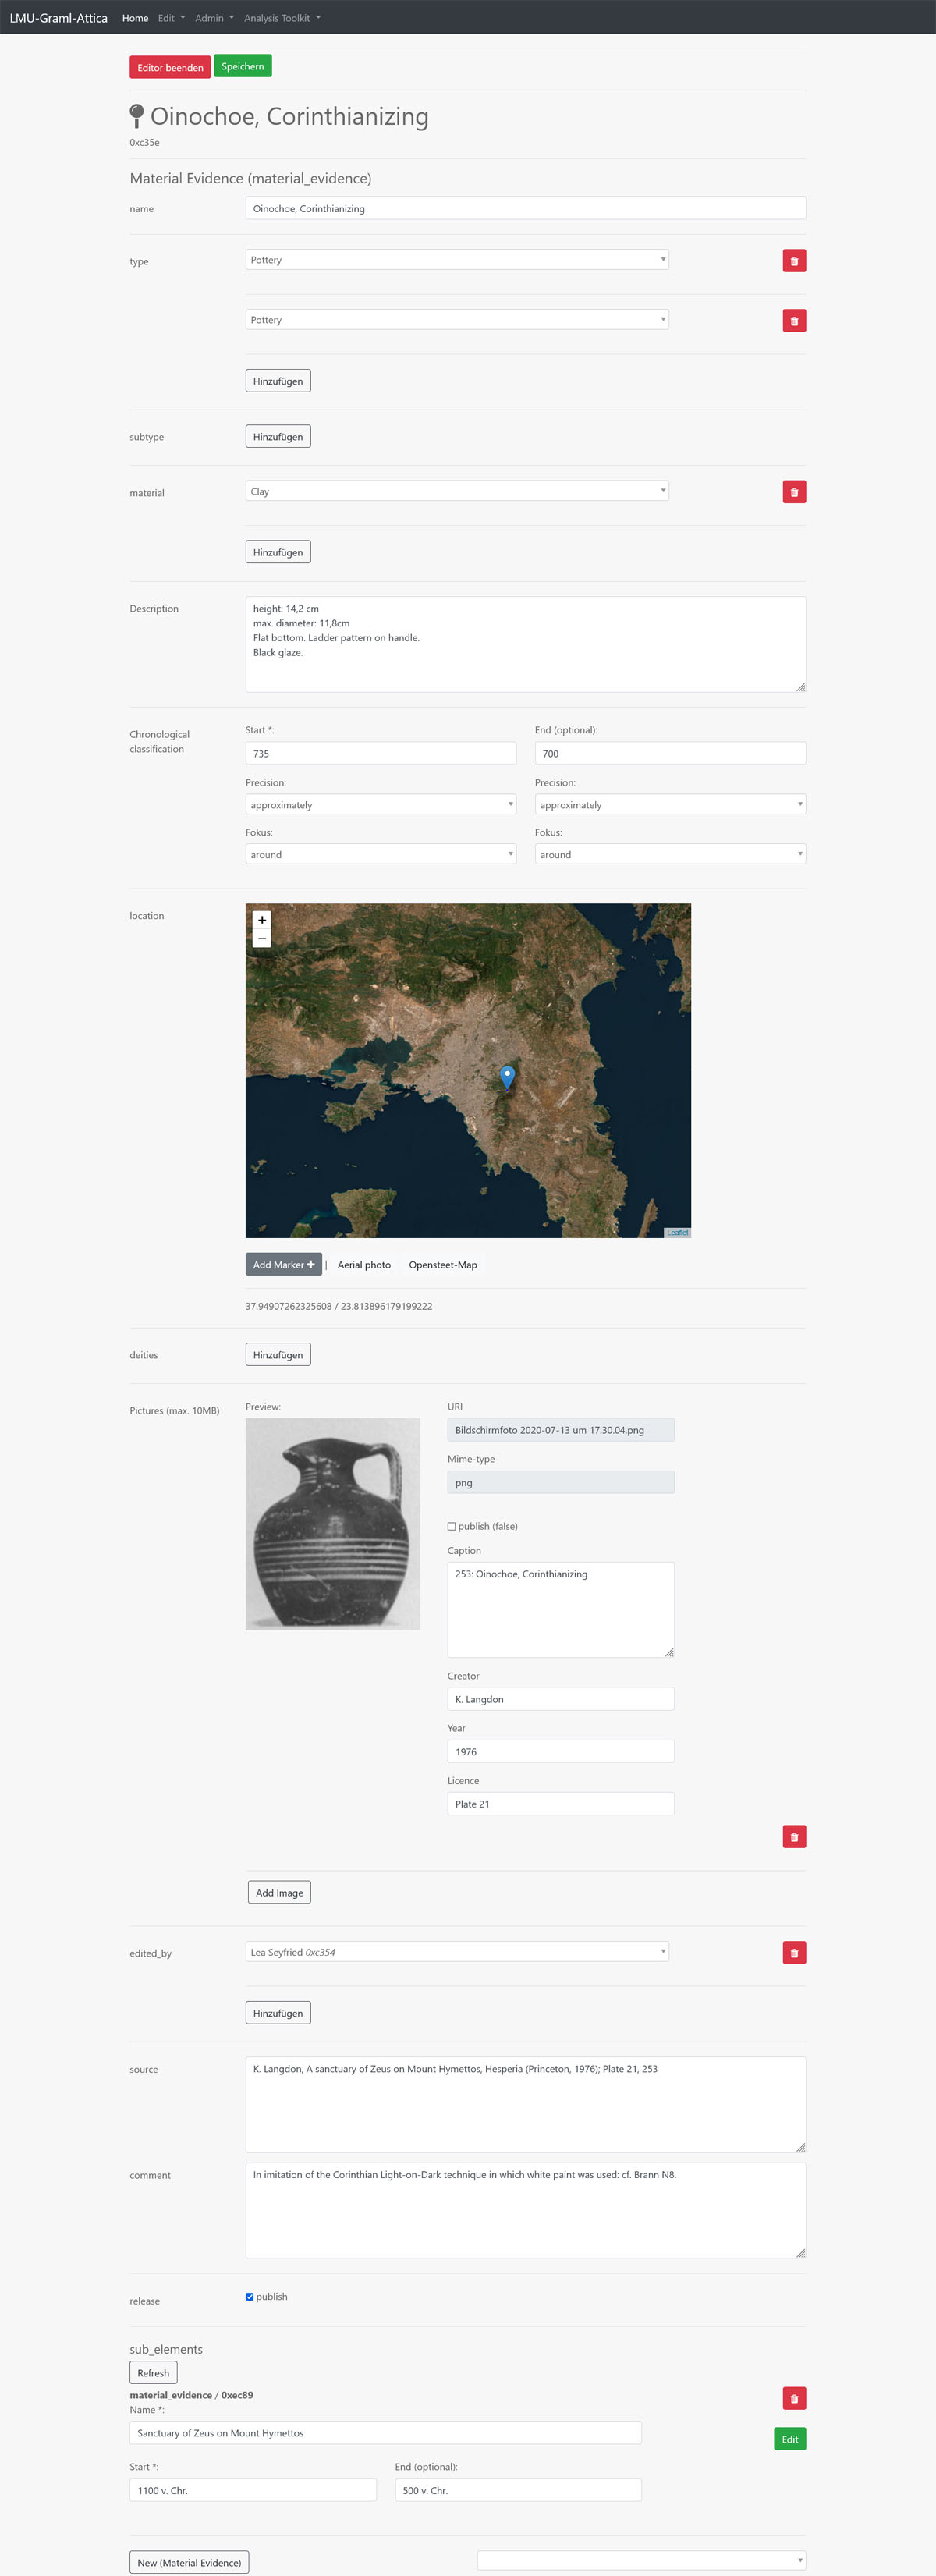
Figure 4
Screenshot of the editor interface. Intelligent fields and interactive elements assist the user in filling out the information. For example, geo-coordinates can be directly selected on an interactive map, and links can be conveniently chosen via drop-down menus.
During data collection, we quickly realized that students often faced inconsistencies and imprecise datings and time indications from the underlying literature when entering data. Consequently, we incorporated options to indicate uncertainties. On one hand, we added specific fields that allow users to specify the level of precision, differentiating between exact, estimated, or approximate values. Moreover, there is an option to set a focus, clarifying how the time indication should be interpreted: Does it represent a time span, or does it indicate a rough classification because the event is dated around that particular time? Additionally, a separate field was introduced for comments and remarks. This is also applicable to other entries, such as location descriptions. Since these cannot always be precisely matched or are based on conjectures, we also introduced another field here to determine the accuracy and plausibility of the entry.
Another crucial step in our process was the integration of existing data. Since data was collected in Excel at the beginning of the project, it was necessary to transfer this data to our new system. For this, we developed a special converter capable of automatically extracting the Excel data, converting it to the format suitable for Dgraph, and then feeding it into the Dgraph database. This step was important not only for practical reasons but also to ensure the integrity and consistency of the data.
The combination of these technologies and methods enabled us to create a robust and flexible system (Figure 3) that reflects both the depth and complexity of our research. It also allowed us to respond to changes or extensions during the project, which is crucial for the dynamic nature of scientific research.
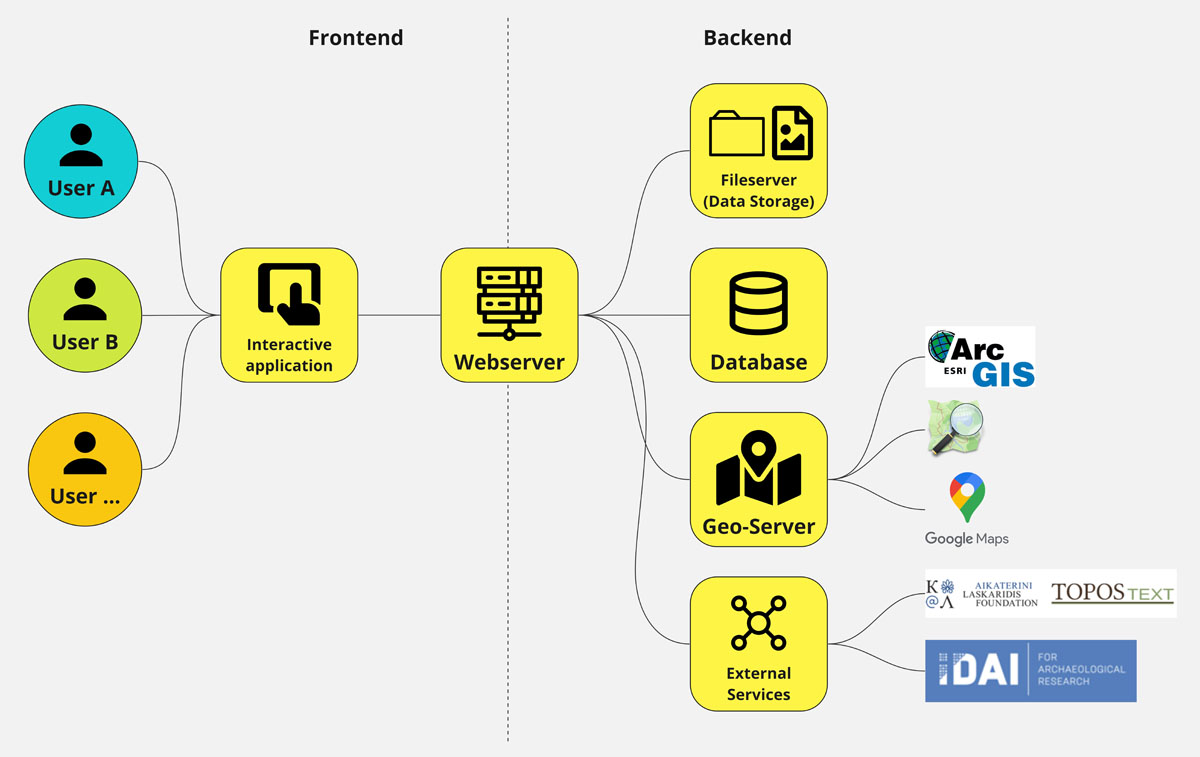
Figure 3
Schematic illustration of our technical structure, including the frontend and backend components as well as their linkage with other services and offerings (only in selection).
Building on this foundation, the data captured and interconnected on our online platform is versatile in its use. All entries can be searched and filtered within the platform, ensuring that editors of all skill levels can quickly locate the desired entries. Moreover, we have integrated various visualization options into our platform, ranging from a map view showcasing all spatial entries to a temporal representation that allows for a comparison of events, developments, and phases.
For more complex queries, our database system offers a query language (Dgraph Query Language) based on GraphQL (Graph Query Language). GraphQL is a query language for APIs (Application Programming Interfaces) that allows clients to request specific data they need through a single endpoint. With this, intricate queries can be executed, even amidst complex connections. Subsequent visualization can either be done through the database’s visualization view or other tools, such as Gephi or D3.js.
The data can also be used beyond the confines of our platform. For instance, they can be integrated into an external GIS program. To facilitate this, all spatial data or selected data sets can be exported. The user can choose among a number of export formats, with options ranging from JSON (JavaScript Object Notation) to tabular CSV (Comma-Separated Values) format. This ensures the captured data is preserved with sustainability and archivability in mind and can be utilized independently of our platform in the future.
Since the teaching project provided the start and first trial-error phase for a larger scale project, extending to the entirety of Attica (see below) and even applicable to other regions or periods, the platform and the data sets are currently only available upon request.
(5) Analysis
Since the developed data structure was only the kick-off for a massive data project,7 the analytical results are extremely preliminary. However, based on specific case studies, some observations do illustrate the substantial potential of large and highly diverse data sets on ancient Greek religion.
By acknowledging all kinds of testimonies, religion and religious places can be understood against their political, social and cultural background and the analysis can provide new insights on their environment/setting. Certain cult places do have a long history of use, which proves extremely insightful on attributed spheres of power of venerated deities. Especially the religious change in late antiquity from polytheism to Christianity is peculiar. Athens provides many examples of a former Greek sanctuary being re-attributed to a Christian saint. The sphere of healing, for example, is continuously anchored on the south slope of the Acropolis rock, where in Classical times, the cult of the healing god Asklepios was installed. The 6th century CE Christian basilica of the Agioi Anargyrioi (Håland 2020) was built to fulfil the same need for divine assistance in times of ill health, since the saints were worshipped as doctor saints. The installations on site, namely the water sources, were considered sacred wells. With this regard, the venerated aspect as well as parts of the practiced rituals remained continuous.
Another example sheds light on the veneration of the demi-god Herakles. As attested in epigraphic sources, he was worshipped at several places in Attica from the Archaic period onwards (Lambert 1997; 1999). A group of people called the Salaminioi, a genos which originated on the island of Salamis, seems to have been especially pre-occupied with his cult. The epigraphic testimonies do date later than the Archaic period, which is a crucial phase for the polis of Athens. During this period, cults seem to have been centralised on and around the Acropolis rock. Moreover, Athens secured important border zones and symbolically underscored their belonging to Athens by incorporating respective local deities. Although Herakles is not explicitly attested on the Acropolis rock, he is prominently present in the pedimental sculpture of several Archaic buildings on the Acropolis. One pediment even shows his apotheosis. It is this iconographic attestation on the Acropolis in combination with the known translocations of cults and the apparently ancient cult tradition of the genos of the Salaminioi, which makes Herakles yet another divine figure of worship on the Acropolis rock (Graml 2024).
The analysis of iconographical testimonies proves extremely fruitful, when it comes to non-monumental examples. Due to the massive amount of pottery in sanctuaries, iconographical analysis is usually not comprehensive; only vase shapes with unambiguous function have received scholarly attention so far. The project of Elisabetta Pala (2012) on the pottery of the Acropolis offers insights8 on the potential of iconographical analysis. In her distribution analysis, Herakles also features prominently in the vase depictions. As Pala notes, comparison the data to other prominent sanctuaries of this period (Brauron and Eleusis) would elucidate the overall cultic needs of this period as well as the regional peculiarities.
A final example on religious practice and its potential of change is detectable within the Eleusinian rite (Graml, forthcoming). A prominent vase shape, the so-called plemochoai or Eleusinian kernoi are attested from the Classical period onwards until the end of the 4th century BCE. They were used during the procession from Athens to Eleusis and contained a specific beverage, the kykeion. Given the abrupt end of the attestation of the vessel the question arises, if and how the ritual was conducted in later times. The processions bearing kykeion either stopped in the 3rd century BCE or an alternative vessel was used instead. Since large amounts of pottery from Eleusis are not available for analysis, iconographical attestations of the plemochoai do offer some ideas on the vase shape’s fate: in the Roman period, i.e. many centuries later, the plemochoai are depicted on monumental architecture in Eleusis as well as in Athenian coin images. These data demonstrate that the knowledge of the ritual persisted, although it was likely no longer being performed.
(6) Discussion & Conclusion
The briefly outlined case studies illustrate that the diversity of data necessitates a highly flexible analytical approach. The case studies show how much can be gained by connecting diverse text and object data against their spatial background. Moreover, they allow a small insight into the outstanding potential of data analysis on a massive scale. Besides the spatial aspects of religion and variable distribution analyses, human imaginations of divine powers and methods of contacting/influencing the divine sphere become graspable. And these observations are substantiated by more than one data set, allowing us to correct the current over-emphasis of isolated written testimonies that provide the imagination of only a single human.
The flexibility and depth of the data model allow researchers not only to analyze the physical and material aspects of ancient Greek sanctuaries but also to develop a deeper understanding of the cultural, social, and religious contexts in which these sanctuaries existed. With this, they become part of a complex network, which acknowledges humans, objects, as well as space and time as potential actors/influences. This provides a multidimensional perspective on ancient Greek religion that goes far beyond traditional archaeological or text-based analysis.
Another advantage of this approach is the ability to create interactive maps and visualizations that represent the spatial relationships between sanctuaries, geographical features, and other relevant locations. Such visualizations can help identify patterns in the placement and orientation of sanctuaries that may be associated with certain religious or cultural practices.
In conclusion, our data model provides an innovative platform for interdisciplinary research into ancient Greek religion. It opens up new avenues for integrating archaeology, geography, text analysis, and data science, contributing to a more comprehensive and nuanced picture of the religious landscape of ancient Greece.
Notes
[1] A network-based approach relativises the importance of institutions and emphasises the individual in their social world instead (Gasparini et al. 2020).
[2] A first published case study in Graml et al. (2019).
[3] Whereas certain data are of overarching spatial and chronological relevance, e.g. Hesiod’s Theogonia.
[4] Cfr. open material religion project at the Open University, UK: https://www.openmaterialreligion.org/ (Last accessed: 16 November 2023).
[5] Architectural elements are separated from material evidence, since they cannot be handled in ritual practice. However, the iconographies that may be present on architecture complicate the category boundary, see below.
[6] Here we follow the example of “Archaeology 3.0”, which Thiery (2019) defines as the use of networked structures in archaeology, an extension of the concept of Digital Archaeology. This refers to the application of technologies such as graph databases and advanced data analysis to better collect, manage, and interpret archaeological data.
[7] Project title: Tracking Religions in Attica (1000 BCE-600 CE): Religious Actors, Practices and Places between Continuity and Change: TReCC_Attica.
[8] Due to the unknown original data – the data surveyed by Pala derives from the early excavation publications of Graef and Langlotz (1925; 1933) and therefore, contains an already filtered data set – the project has its historical limitations. Yet, the proposed approach sketches a desired methodology of handling pottery from sanctuaries for future discoveries.
Acknowledgements
The authors would like to express their gratitude to the research unit Lehre@LMU, who provided generous funding for computational tools and a planned field trip to Greece in order to generate 3D landscape data. The latter however, had to be cancelled due to the pandemic.
Moreover, thanks are due to Henry Heitmann-Gordon for improving our English text.
Funding Information
Lehre@LMU, 3,500 € (without grant number).
Competing interests
The authors have no competing interests to declare.
Author contributions
Manuel Hunziker: Conceptualisation, Resources, Software, Data curation, Writing – original draft.
Constanze Graml: Conceptualisation, Project administration, Writing – original draft.