
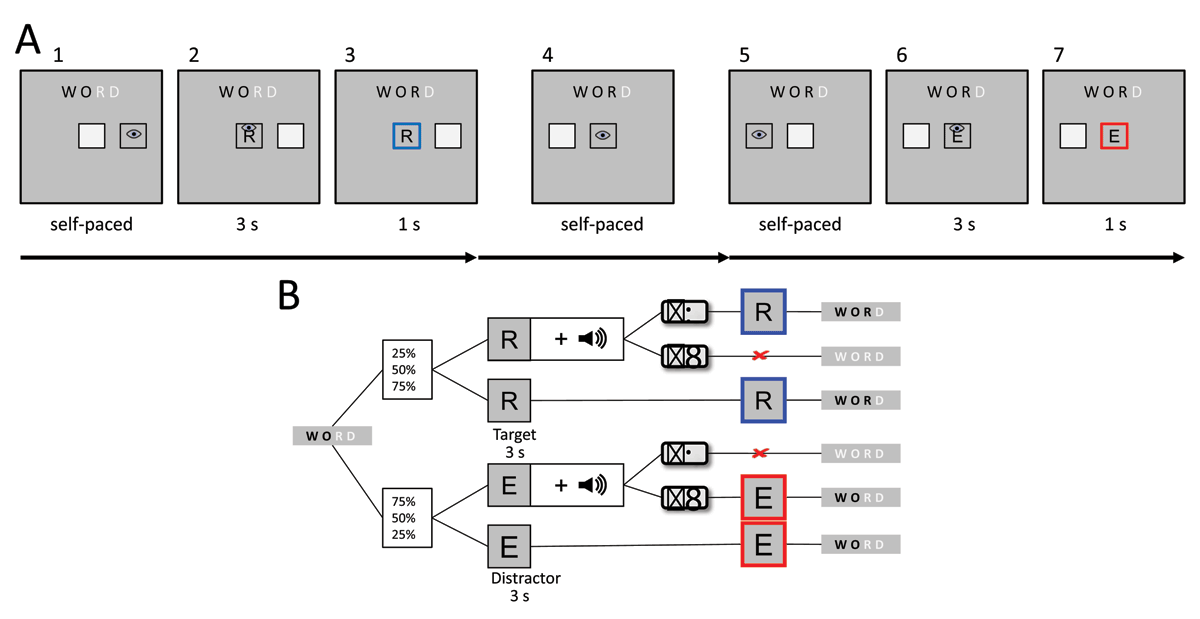
Figure 1
A: Two subsequent trials, once for a target (1–3), once a distractor letter (4–7). A1: Representative depiction of the presented screen before starting a trial. A2: After first gazing into the outer activation box that was randomly presented either to the left or right of the central box, participants had to make a saccade to the center to start a trial. A highlight fed back whether gaze position was registered inside the respective box. The word presented above indicated which letter was correct, which was always the leftmost letter given in gray (here: R). A3: After 3 s of keeping the gaze inside the central box and handling a potential GoNoGo signal correctly (after tone prompt in 50% of trials: press left key for distractors and right key for targets), a highlight fed back that the trial had been finished. A5–A7: Next trial, in this case with a distractor letter that has been handled correctly. B: Flowchart of trials.
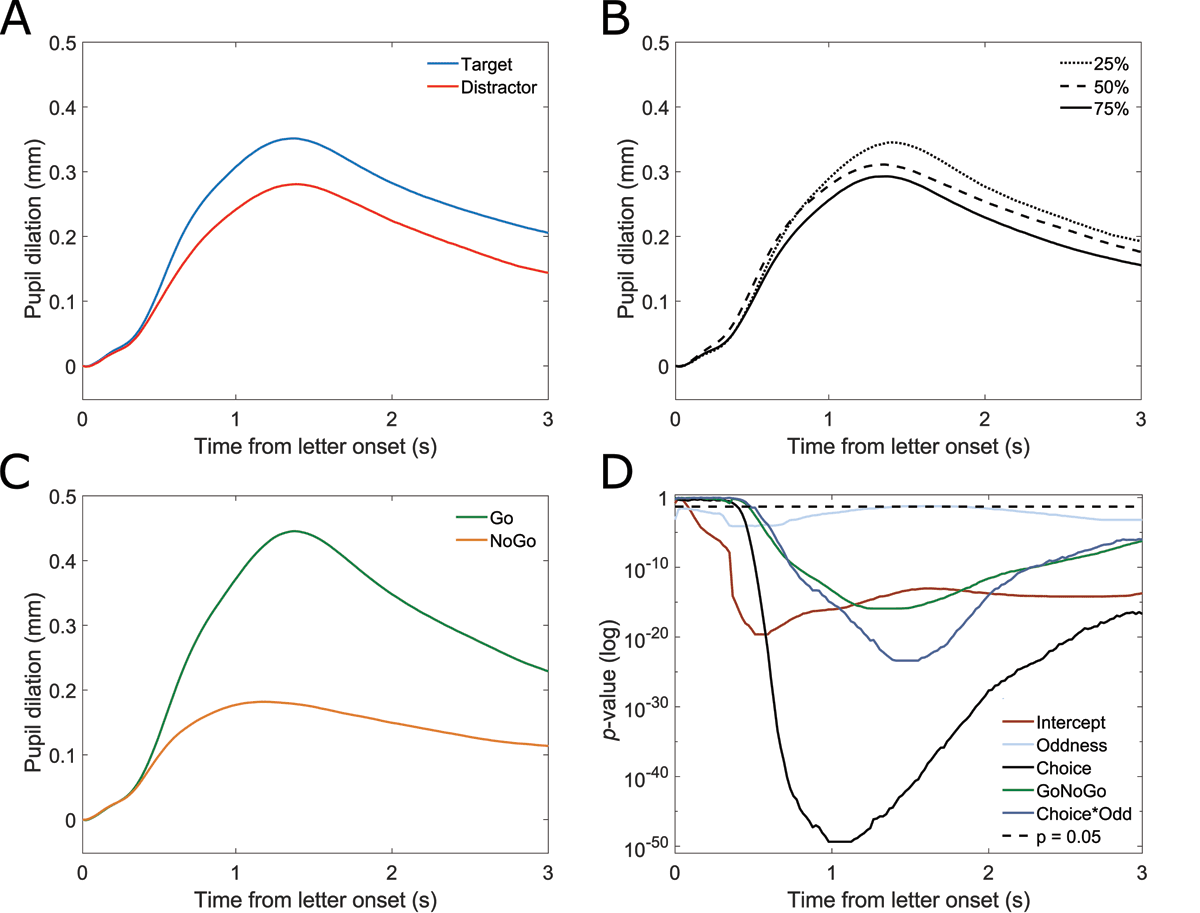
Figure 2
A–C: Pupil dilation over time against local baseline. A: target (blue) and distractor (red). B: stimulus probabilities: 25% (dotted), 50% (dashed), and 75% (solid). C: Go (green) and NoGo (yellow). D: p-values for a functional linear mixed model over time. Choice: dark grey, stimulus probability (oddness): light blue, GoNoGo: green, choice*stimulus probability: dark blue, intercept: light brown, α = 0.05: dashed black. Based on n = 44 participants and n = 13551 individual trials.
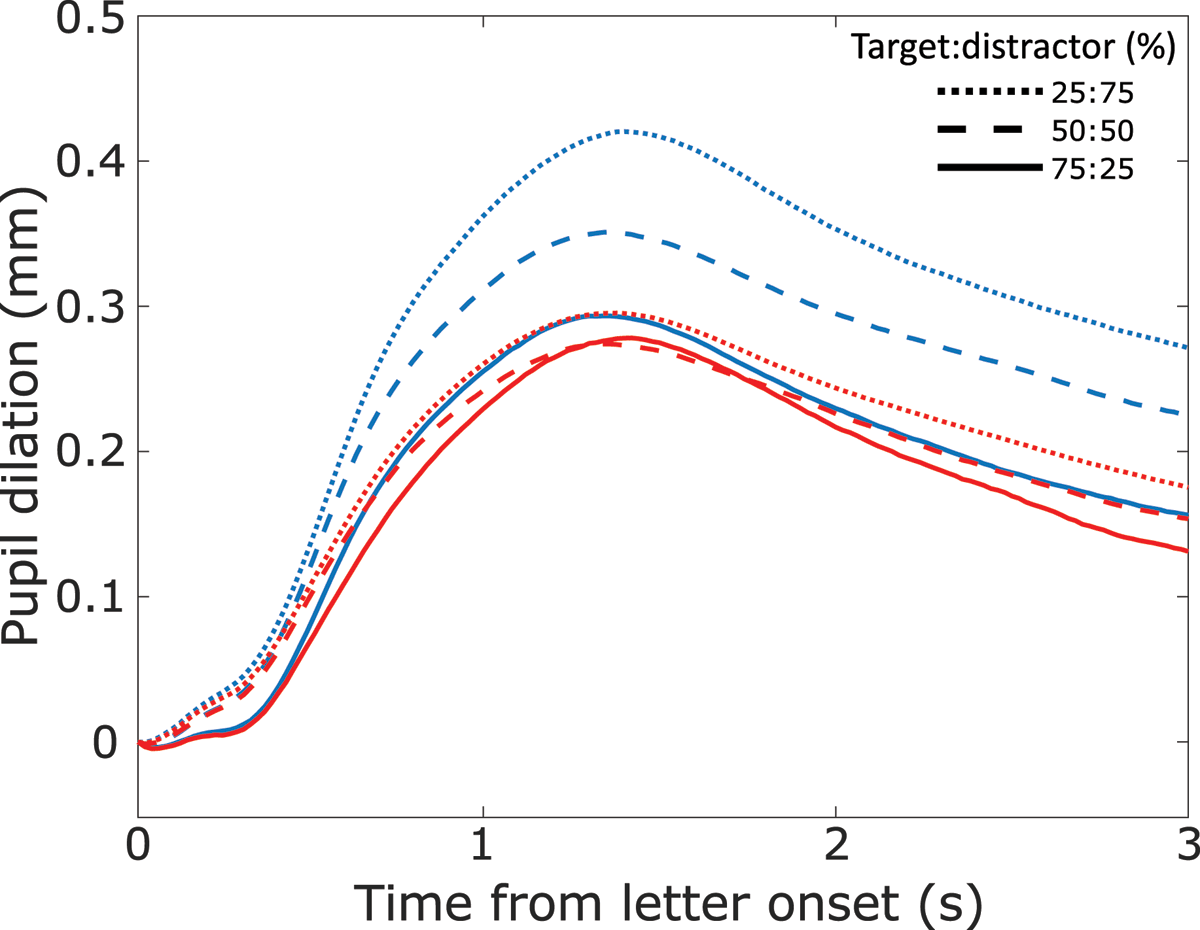
Figure 3
Pupil dilation for target (blue) and distractor (red) along target:distractor ratio. Dotted lines: 25% targets, dashed lines: 50% targets, solid lines: 75% targets.
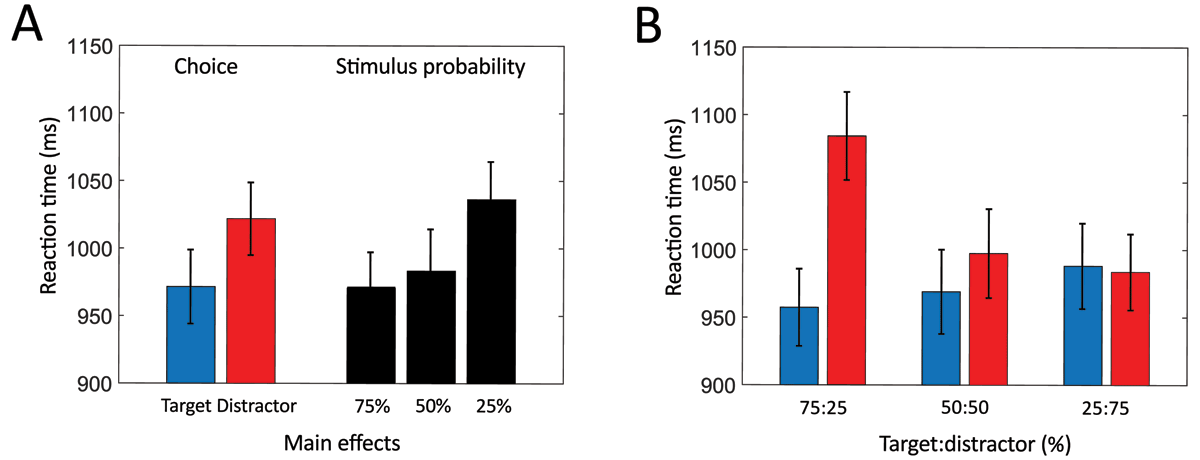
Figure 4
Reaction times. A: main effects for choice (target = blue, distractor = red) and stimulus probability (black). B: Reaction times for target and distractor along target:distractor ratio. Error bars indicate standard errors of the mean.
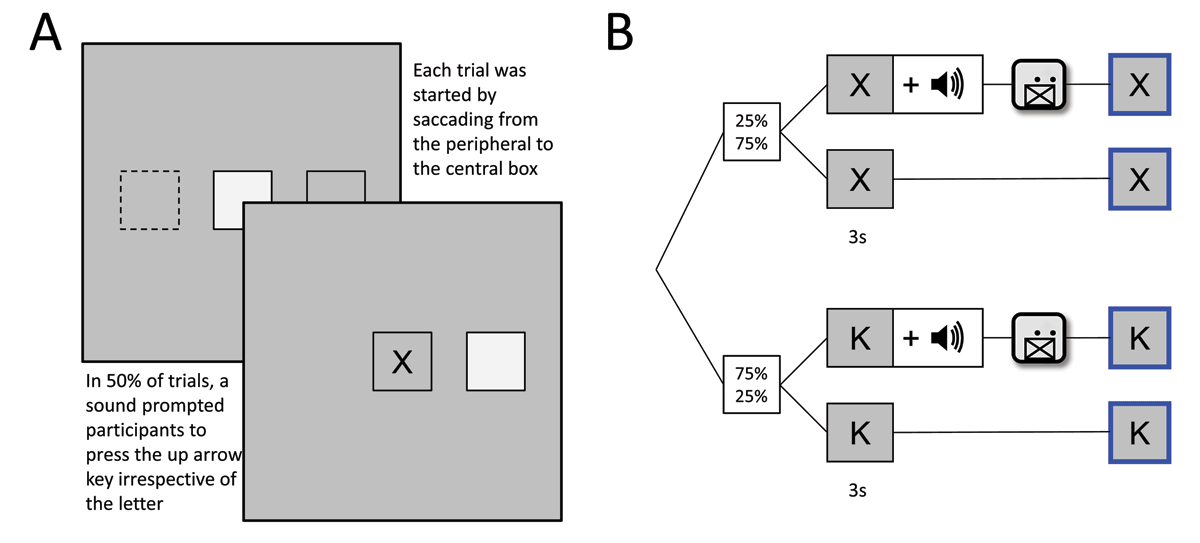
Figure 5
A: Trials were performed as in Experiment 1, however, no target word was presented during Block 1, letters were therefore neither targets nor distractors. B: Flowchart of trials: at a chance of either 25% or 75% the letters X or K were presented upon fixation of the central box. In 50% of cases, a sinewave tone prompted participants to press the up key; participants needed to keep gazing into the central box for 3 s. Else, no key press was required until a highlight fed back that the trial had been handled correctly.
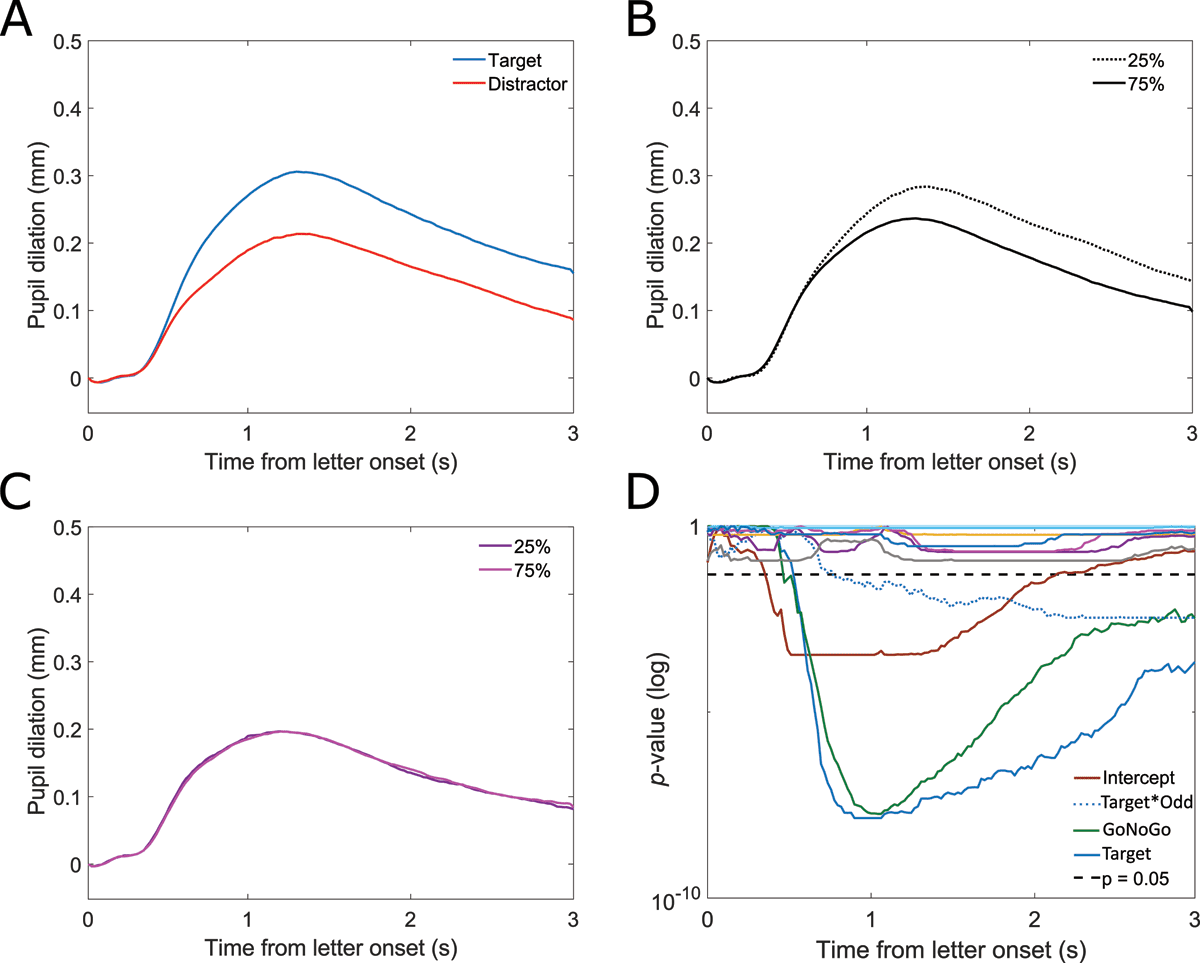
Figure 6
A–C: Pupil dilation against local baseline. A: target (blue) and distractor (red). B: stimulus frequencies: 25% (dotted) and 75% (solid) during blocks 2 and 3. C: stimulus frequencies: 25% and 75% during Block 1. D: p-values for a functional linear mixed model over time using the factors stimulus relevance (Block 1, distractor, target), GoNoGo, and 25%75%, as well as their interactions. Other factors and factor levels, including stimulus probability and distractor, were non significant. Target: blue, GoNoGo: green, target*stimulus probability: dotted blue, intercept: light brown, α = 0.05: dashed black. Based on n = 25 participants and n = 7052 individual trials.
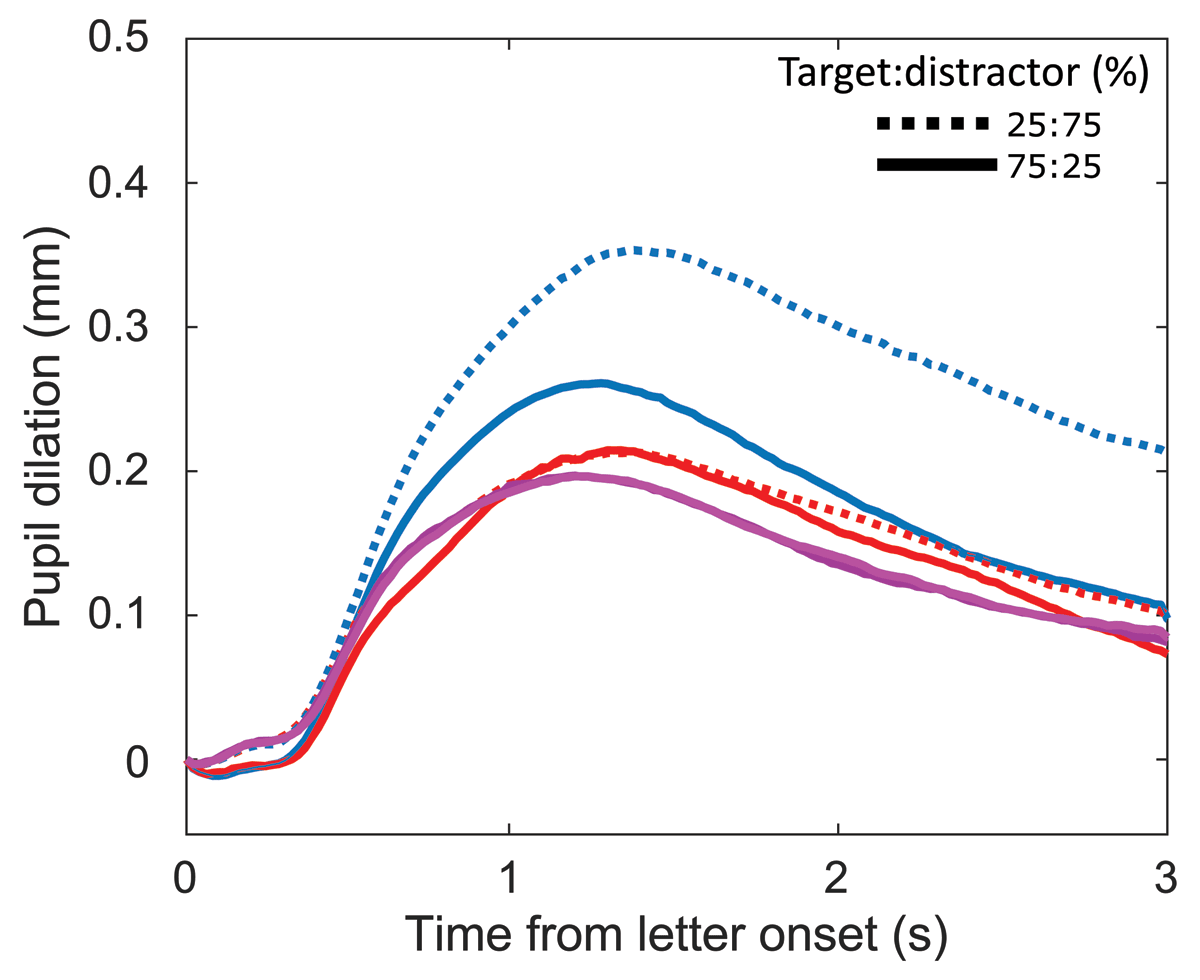
Figure 7
Pupil dilation for target (blue), distractor (red), as well as for rare (purple) and frequent (pink) letters during Block 1. Pupil dilation for target and distractor conditions split along target:distractor ratio. Dotted lines: 25% targets, solid lines: 75% targets.
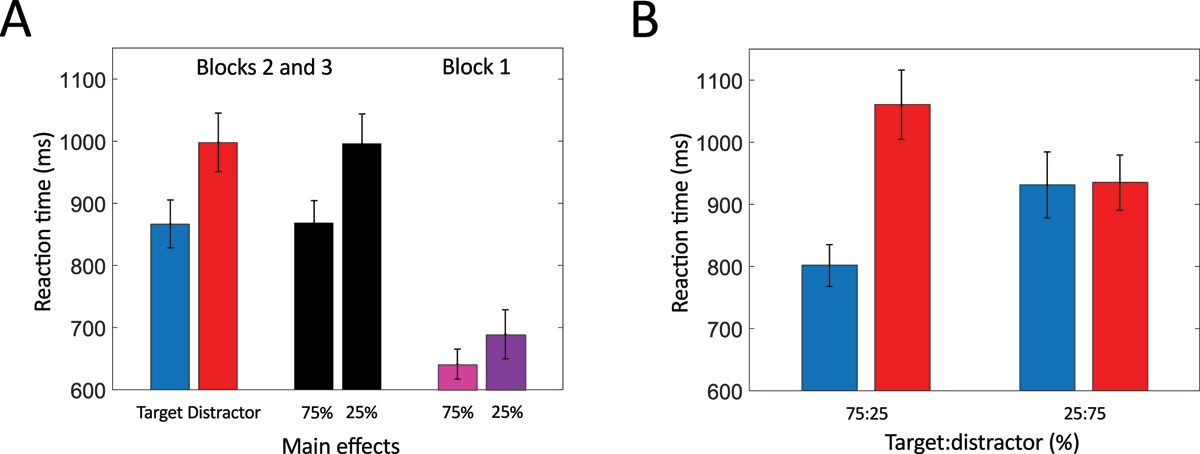
Figure 8
Reaction times. A: effects for stimulus relevance (target: blue, distractor: red, irrelevant frequent: pink, irrelevant rare: purple) and stimulus probability (black). B: Reaction time for target and distractor along target:distractor ratio. Error bars indicate standard errors of the mean.
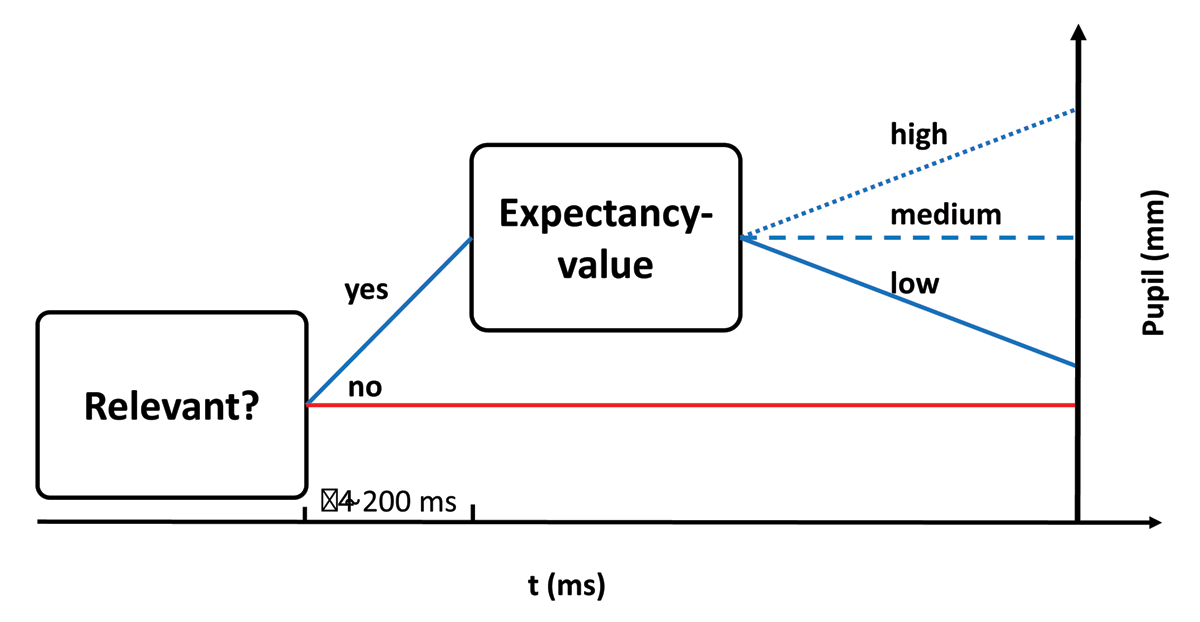
Figure 9
Proposed framework for integrating effects of stimulus relevance and stimulus probability and predicting pupil size when processing stimuli. Pupil dissociates earlier for relevance than for stimulus probability, arguing for separate processes. Given that a stimulus is relevant, pupil dilates differentially based on an expectancy-value mechanism.