
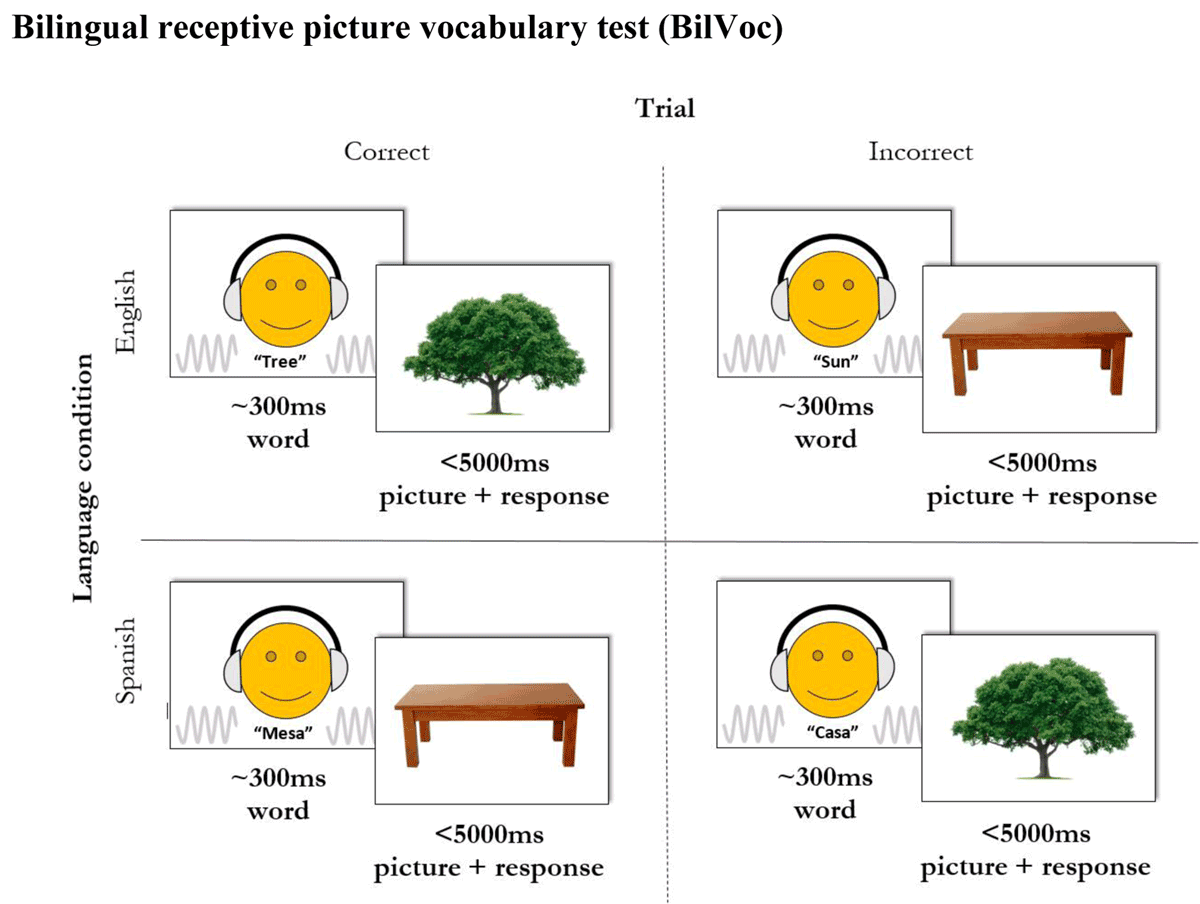
Figure 1
Schematic illustration of the bilingual picture vocabulary test (BilVoc).
Table 1
Questions asked in the BilQ to assess language usage. For questions with sub-questions, participants were required to answer again separately for each language.
| # | Questions | Sub-question | Possible responses |
|---|---|---|---|
| 1e | I speak: | English… | 1. Never |
| 1s | Spanish… | 2. A few times a month | |
| 3. Every day | |||
| 4. Always | |||
| 2e | If someone speaks English and Spanish, what language do you speak to them in? | English… | 1. Never |
| 2s | Spanish… | 2. Sometimes | |
| 3. Most of the time | |||
| 4. Always | |||
| 3e | I started learning English: | 1. At school | |
| 3s | I started learning Spanish: | 2. Years before school | |
| 3. I’ve always known it | |||
| 4 | I talk to friends in: | 1. English | |
| 5 | I talk to family in: | 2. Spanish | |
| 6 | I watch television in: | 3. Both |
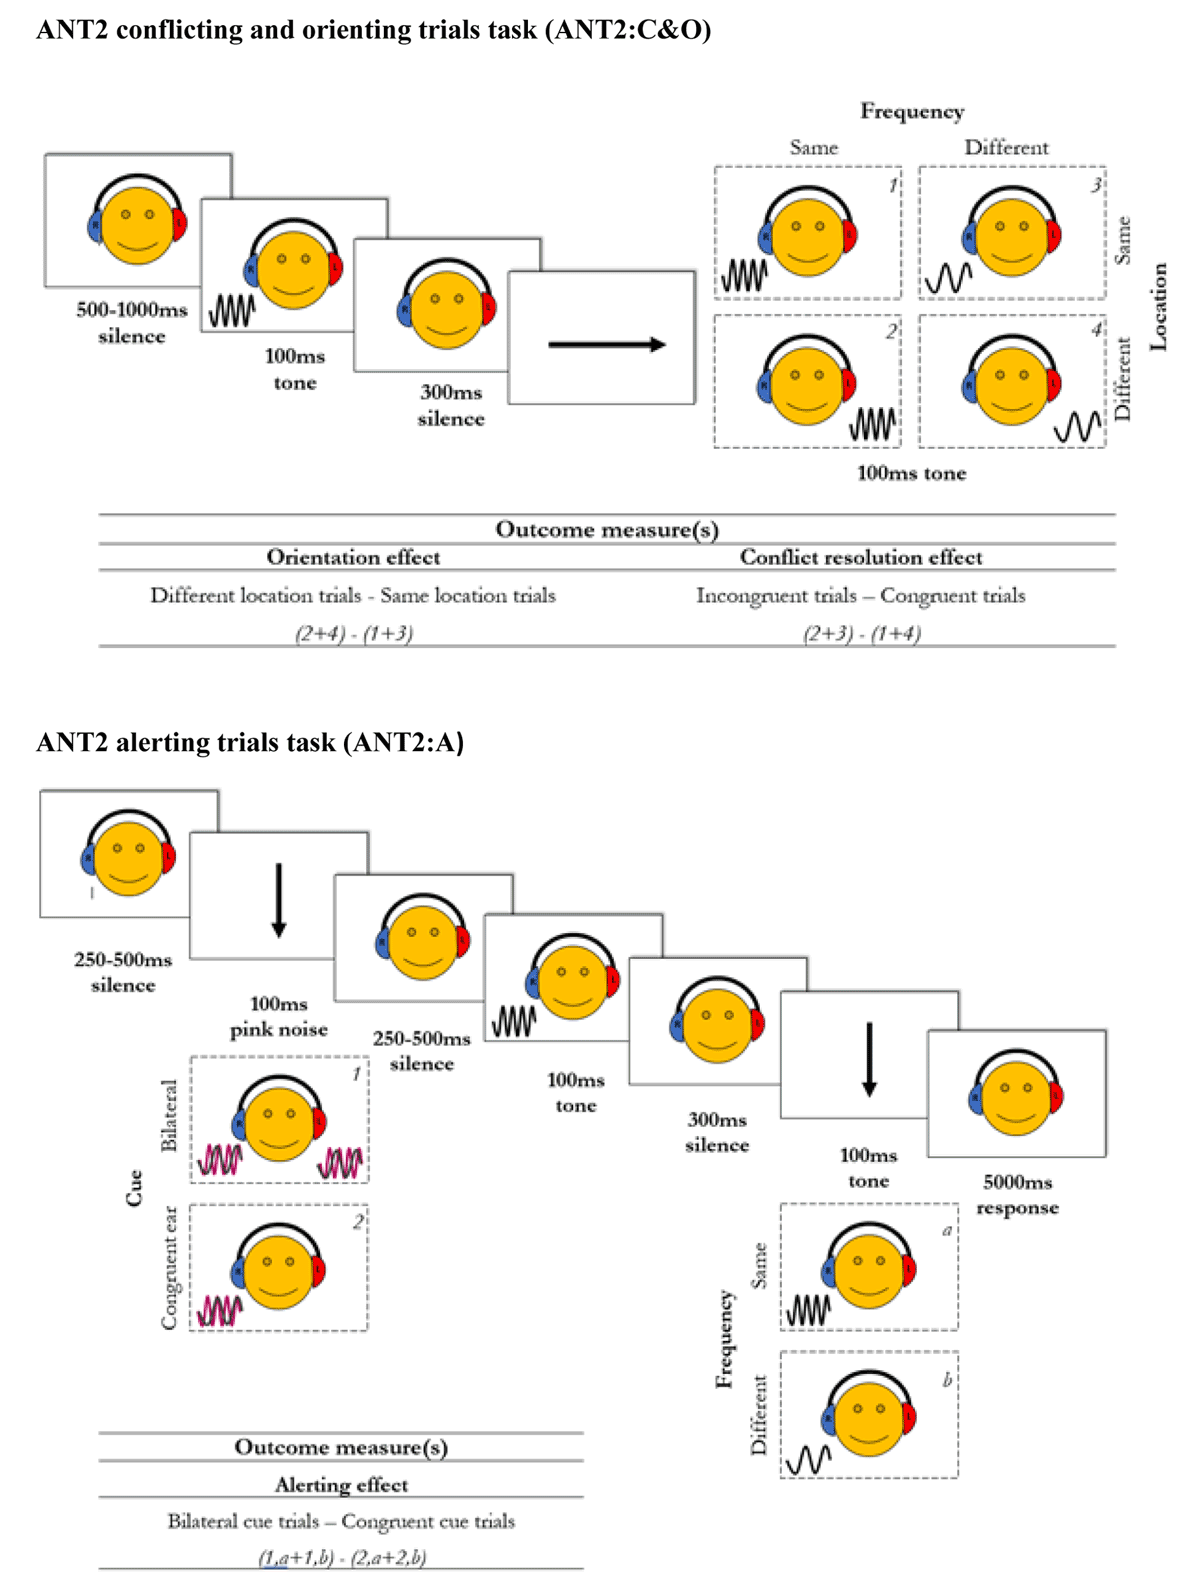
Figure 2
Schematic illustration of the ANT2 conflict and orienting trials (ANT2:C&O) in top panel, and of the ANT2 alerting trials (ANT2:A) in bottom panel. In the ANT2:C&O, response time was measured following the second tone (up to 5000ms).
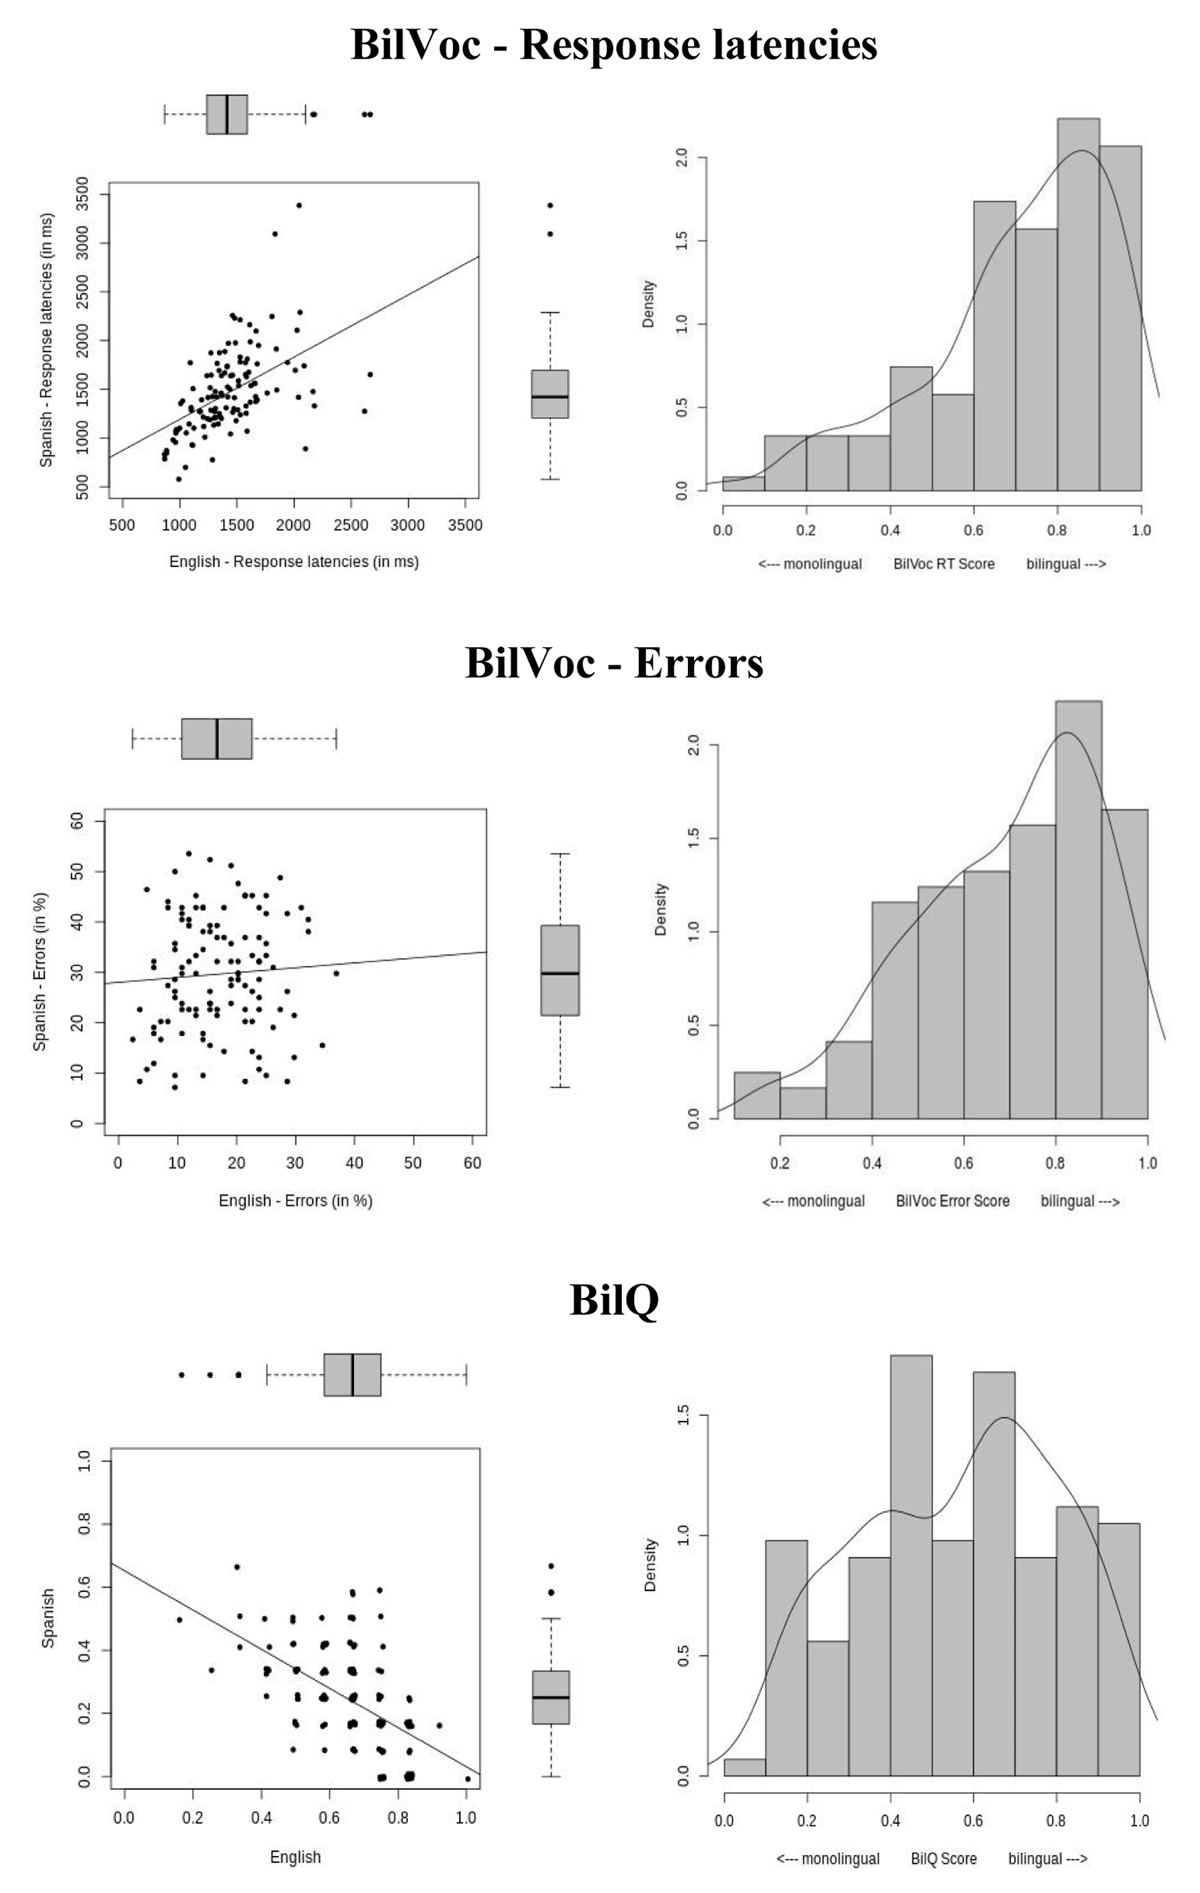
Figure 3
Top panel: BilVoc performance – Response latencies. Left panel: average latencies in English and Spanish plotted against each other. Right panel: density histogram of corresponding BilVoc bilingualism scores. Middle panel: BilVoc performance – error percentages. Left panel: average error scores in English and Spanish plotted against each other. Right panel: density histogram of corresponding BilVoc bilingualism scores. Bottom panel: BilQ results. Left panel: average scores on the BilQ (0–1) in English and Spanish plotted against each other. Right panel: density histogram of corresponding BilQ bilingualism scores. In all plots, points represent individual participants and have been slightly jittered to avoid overplotting.
Table 2
Correlation matrix for disparity between English and Spanish language measures (BilVoc response times; BilVoc errors; and BilQ) and demographic factors (individualist culture; SES; and immigrant status).
| Bilingualism score for BilVoc RTs | Bilingualism score for BilVoc Errors | Bilingualism score for BilQ | Individualist culture | SES | ||
|---|---|---|---|---|---|---|
| Bilingualism score | r | –.206 | ||||
| for BilVoc Errors | p | .024 | ||||
| BF01 | 0.70 | |||||
| BF10 | 1.42 | |||||
| Bilingualism score | r | –.249 | .377 | |||
| for BilQ | p | .011 | <.001 | |||
| BF01 | 0.33 | 0.01 | ||||
| BF10 | 3.07 | 285.09 | ||||
| Individualist | r | .065 | –.284 | –.124 | ||
| culture | p | .502 | .003 | .159 | ||
| BF01 | 6.66 | 0.11 | 3.43 | |||
| BF10 | 0.15 | 9.44 | 0.29 | |||
| SES | r | –.133 | –.126 | –.016 | –.018 | |
| p | .165 | .191 | .857 | .810 | ||
| BF01 | 3.24 | 3.60 | 9.04 | 10.36 | ||
| BF10 | 0.31 | 0.28 | 0.11 | 0.10 | ||
| Immigrant | r | .085 | –.017 | –.170 | –.131 | .008 |
| status | p | .382 | .865 | .052 | .081 | .912 |
| BF01 | 5.72 | 8.23 | 1.41 | 2.35 | 10.71 | |
| BF10 | 0.18 | 0.12 | 0.71 | 0.43 | 0.093 |
[i] Note: Bayes Factor (BF) values which suggest at least ‘moderate’ evidence (BF ≥ 3) are shown in bold.
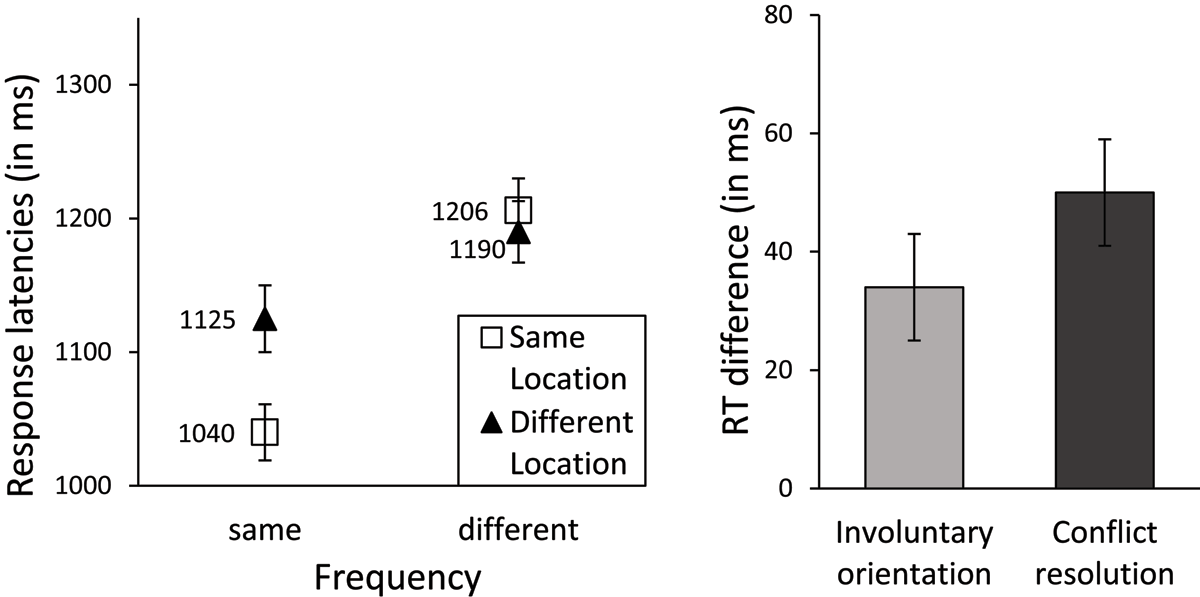
Figure 4
Performance on the ANT2 conflict and orienting trials (ANT2:C&O) task. Response latencies (in ms; left panel) varied by Frequency and Location; Response time differences corresponding to orientation and conflict resolution (in ms; right panel). Error bars indicate standard error of the means.
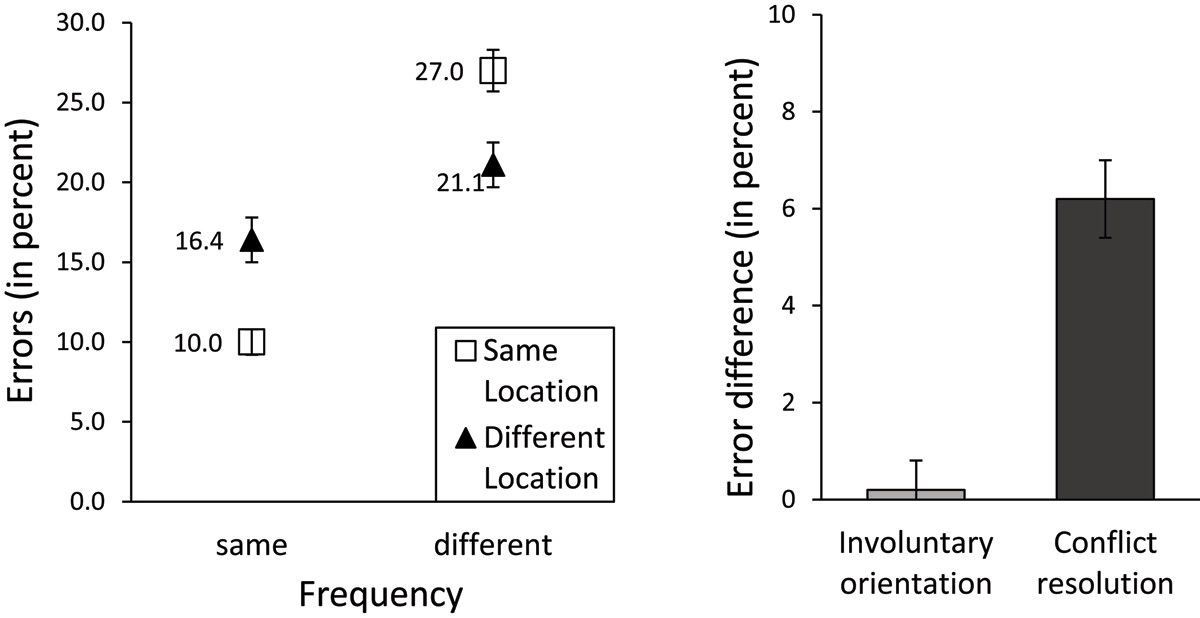
Figure 5
Performance on the ANT2 conflict and orienting trials (ANT2:C&O) task. Error rates (in percent; left panel) varied by Frequency and Location; Error rate differences corresponding to orientation and conflict resolution (in percent; right panel). Error bars indicate standard error of the means.
Table 3
Correlation matrix for measures of bilingualism (BilVoc response times; BilVoc errors; and BilQ) and of attentional control (global measures in the ANT2:C&O and ANT2:A, as well as the conflict, orienting and alerting components from these tasks).
| Global Measures | Component Measures | ||||||||||
|---|---|---|---|---|---|---|---|---|---|---|---|
| ANT2:C&O | ANT1:A | Conflict | Orienting | Alerting | |||||||
| RT | Error | RT | Error | RT | Error | RT | Error | RT | Error | ||
| Bilingualism | r | .33 | .20 | .06 | .24 | .10 | .06 | .03 | .21 | .03 | .12 |
| score for | p | .002 | .061 | .675 | .090 | .341 | .617 | .809 | .059 | .822 | .400 |
| BilVoc RTs | BF01 | 0.07 | 1.32 | 5.36 | 1.44 | 4.73 | 6.53 | 7.17 | 1.28 | 5.70 | 4.14 |
| BF10 | 14.08 | 0.76 | 0.19 | 0.69 | 0.21 | 0.15 | 0.14 | 0.79 | 0.18 | 0.24 | |
| Bilingualism | r | –.03 | –.02 | .04 | .04 | –.05 | –.07 | –.03 | –.02 | –.10 | –.07 |
| score for | p | .781 | .835 | .789 | .762 | .651 | .520 | .799 | .887 | .492 | .609 |
| BilVoc Errors | BF01 | 7.10 | 7.22 | 5.64 | 5.58 | 6.67 | 6.02 | 7.15 | 7.31 | 4.64 | 5.14 |
| BF10 | 0.14 | 0.14 | 0.18 | 0.18 | 0.15 | 0.17 | 0.14 | 0.14 | 0.22 | 0.20 | |
| Bilingualism | r | –.12 | –.06 | .09 | –.07 | .12 | .08 | .20 | –.07 | –.16 | .02 |
| score for | p | .233 | .567 | .481 | .588 | .244 | .471 | .049 | .486 | .179 | .867 |
| BilQ scores | BF01 | 3.85 | 6.60 | 5.21 | 5.76 | 3.98 | 6.00 | 1.15 | 6.11 | 2.75 | 6.56 |
| BF10 | 0.26 | 0.15 | 0.19 | 0.17 | 0.25 | 0.17 | 0.87 | 0.16 | 0.36 | 0.15 | |
[i] Note: Bayes Factor (BF) values which suggest at least ‘moderate’ evidence (BF ≥ 3) are shown in bold.