
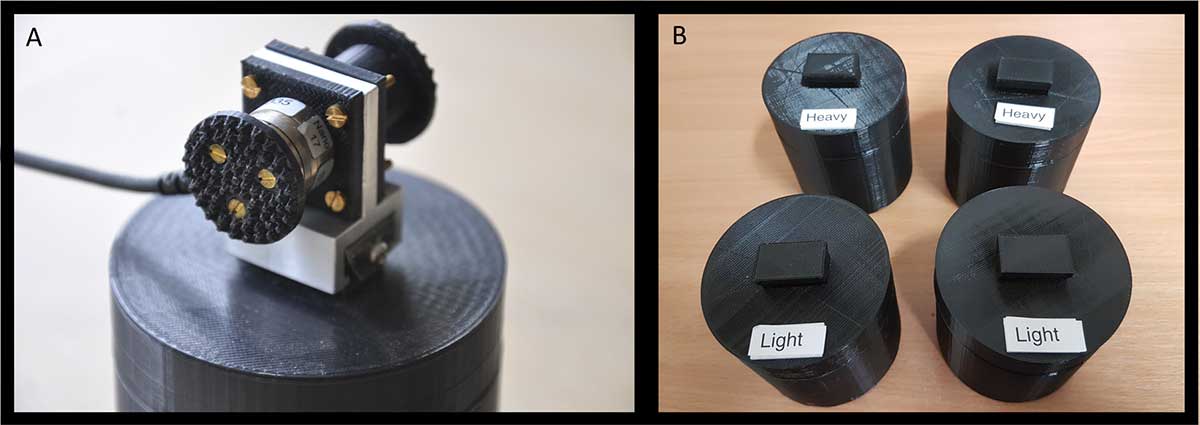
Figure 1
A. The force transducer handle which participants use to lift the objects, attached to the unlabelled practice cylinder. B. The labelled test cylinders lifted by participants during the experimental trials.
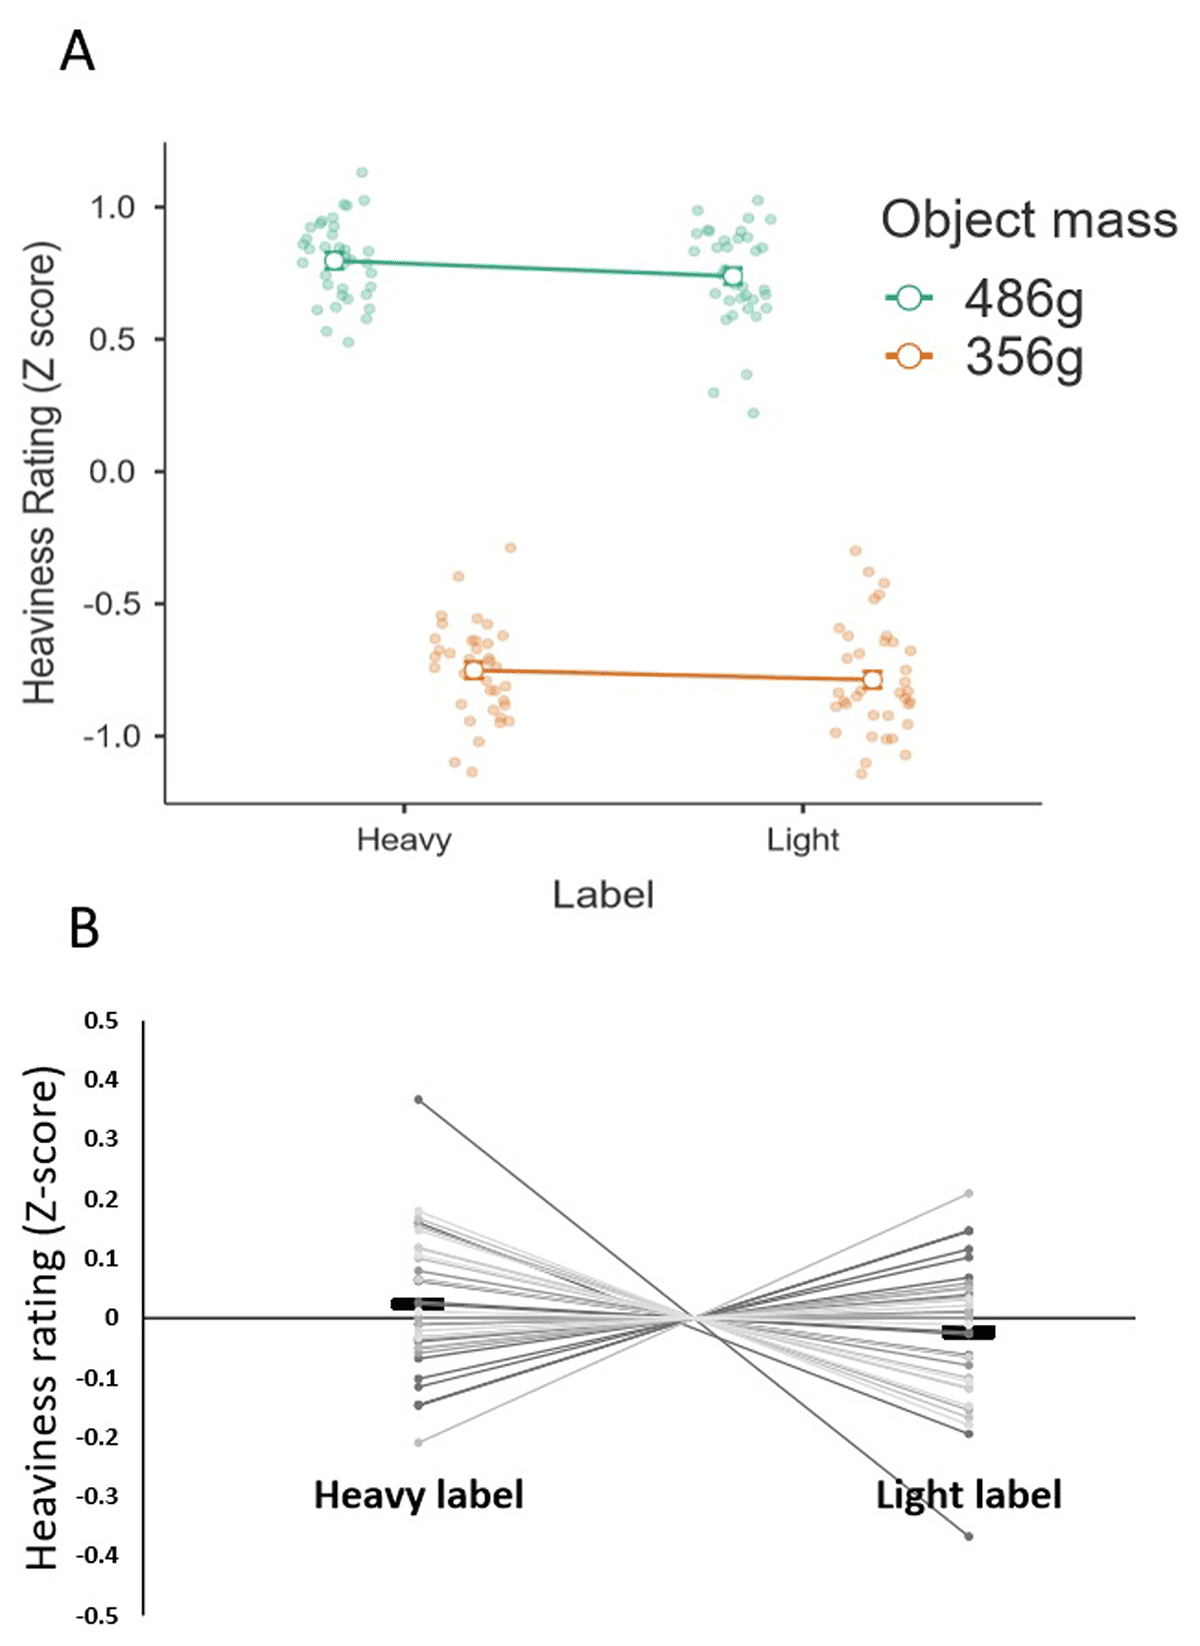
Figure 2
A. The average perceptual ratings of heaviness, normalized to a z distribution, for each of the four lifted objects. B. The main effect of object label (averaged across mass), visualized for individual participants’ average perceptual ratings of heaviness normalised to a z distribution. The solid rectangle represent the group average.
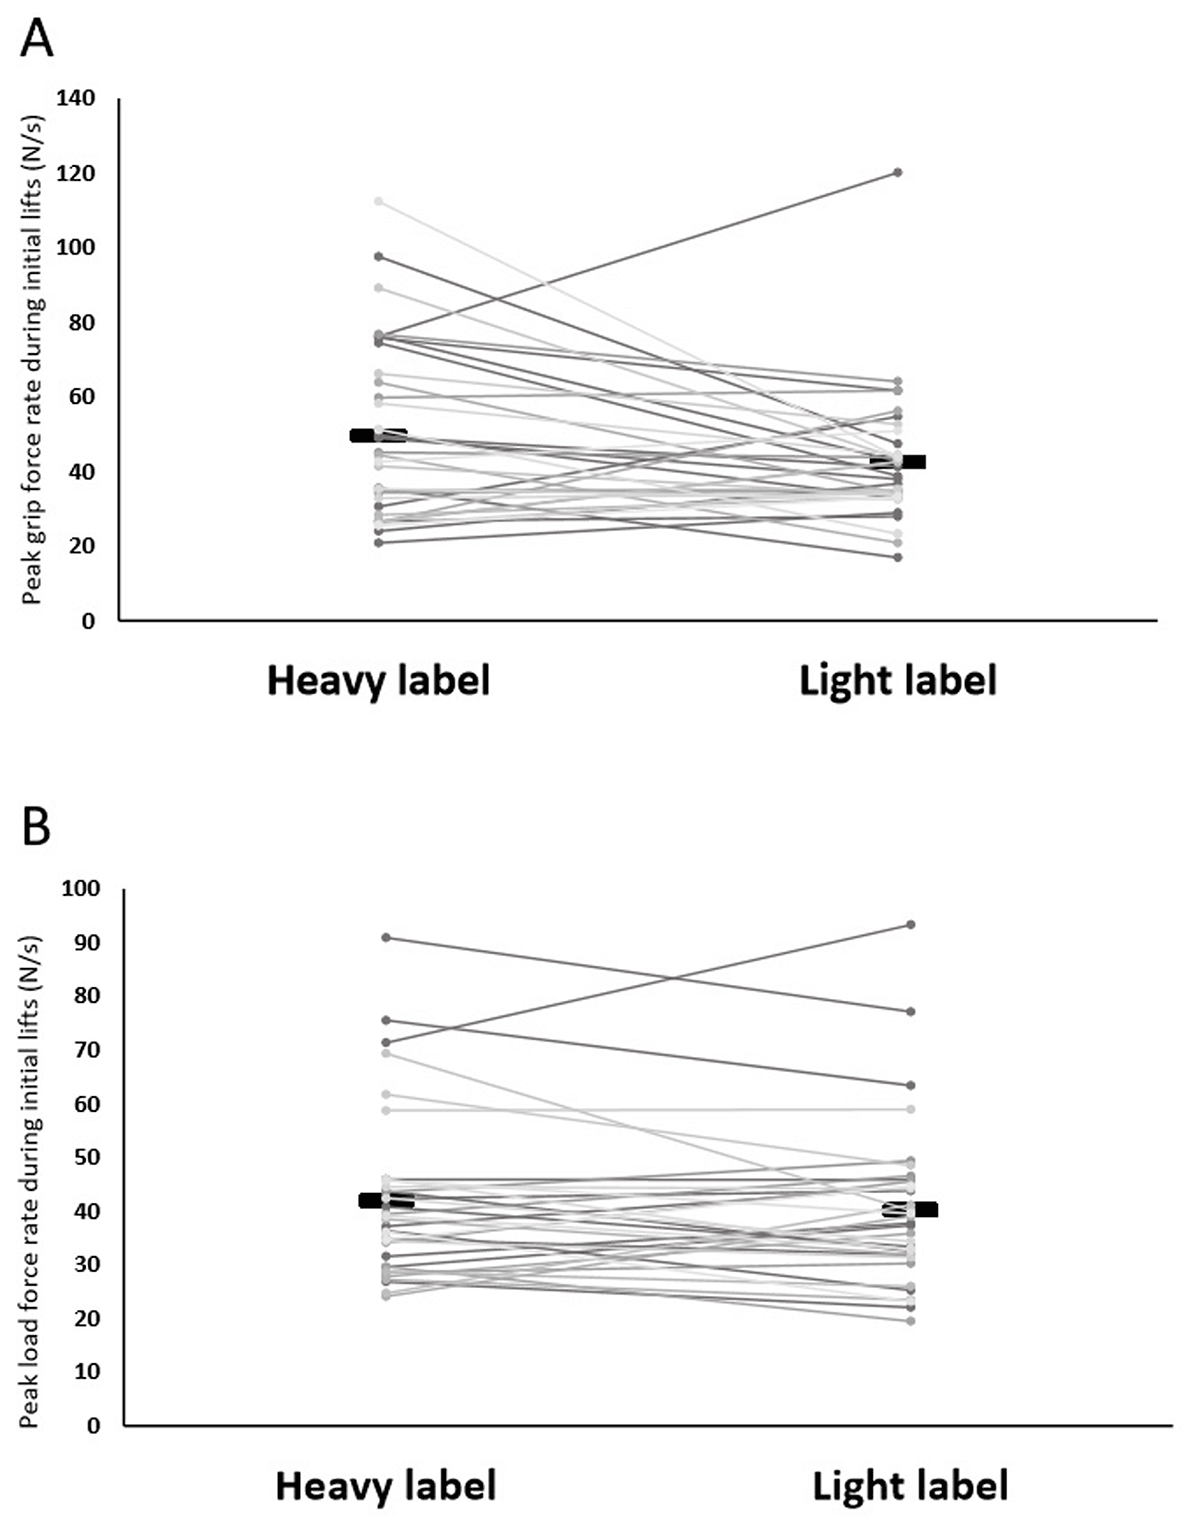
Figure 3
A. The peak grip force rate applied on the initial lifts of the objects labelled as ‘heavy’ and ‘light’ and B. the load force rate applied on the initial lifts of the objects labelled as ‘heavy’ and ‘light’, for each individual. The solid rectangles represent the group averages.
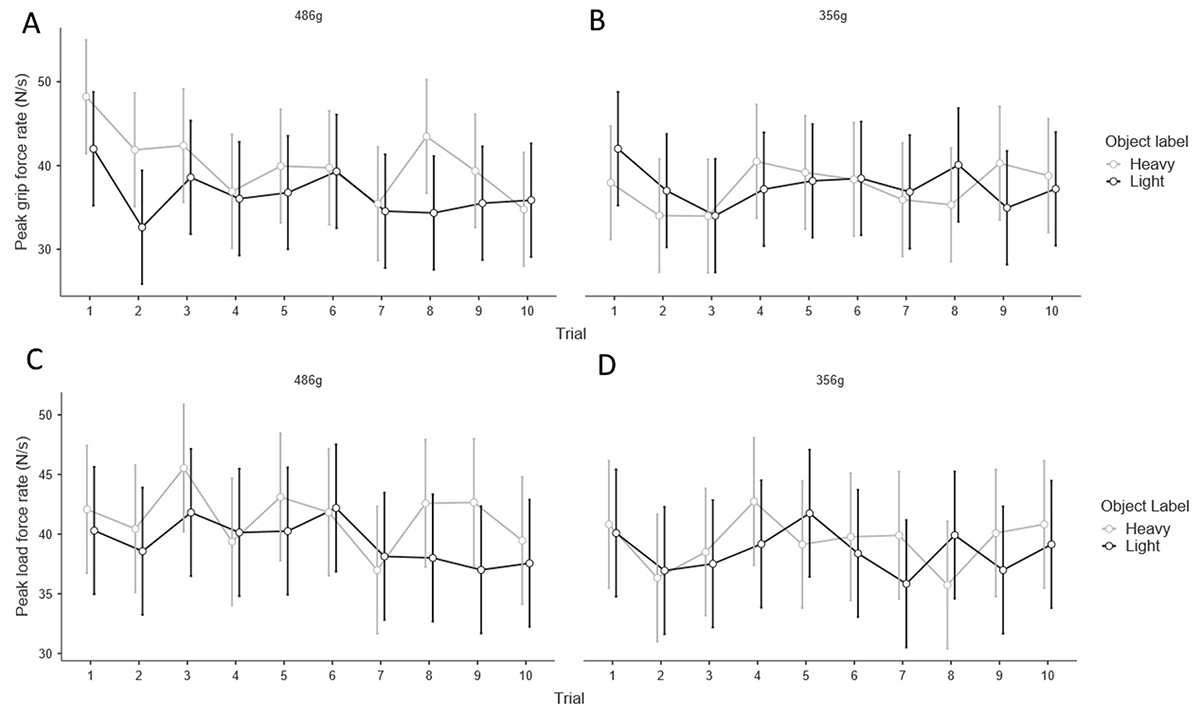
Figure 4
A. Peak grip force rate across all lifts of the 486 g objects and B. the 356 g objects labelled as ‘heavy’ and ‘light’. C. The peak load force rates across all lifts of the 486g objects and D. the 356 g objects labelled as ‘heavy’ and ‘light’. Error bars show 95% confidence intervals.
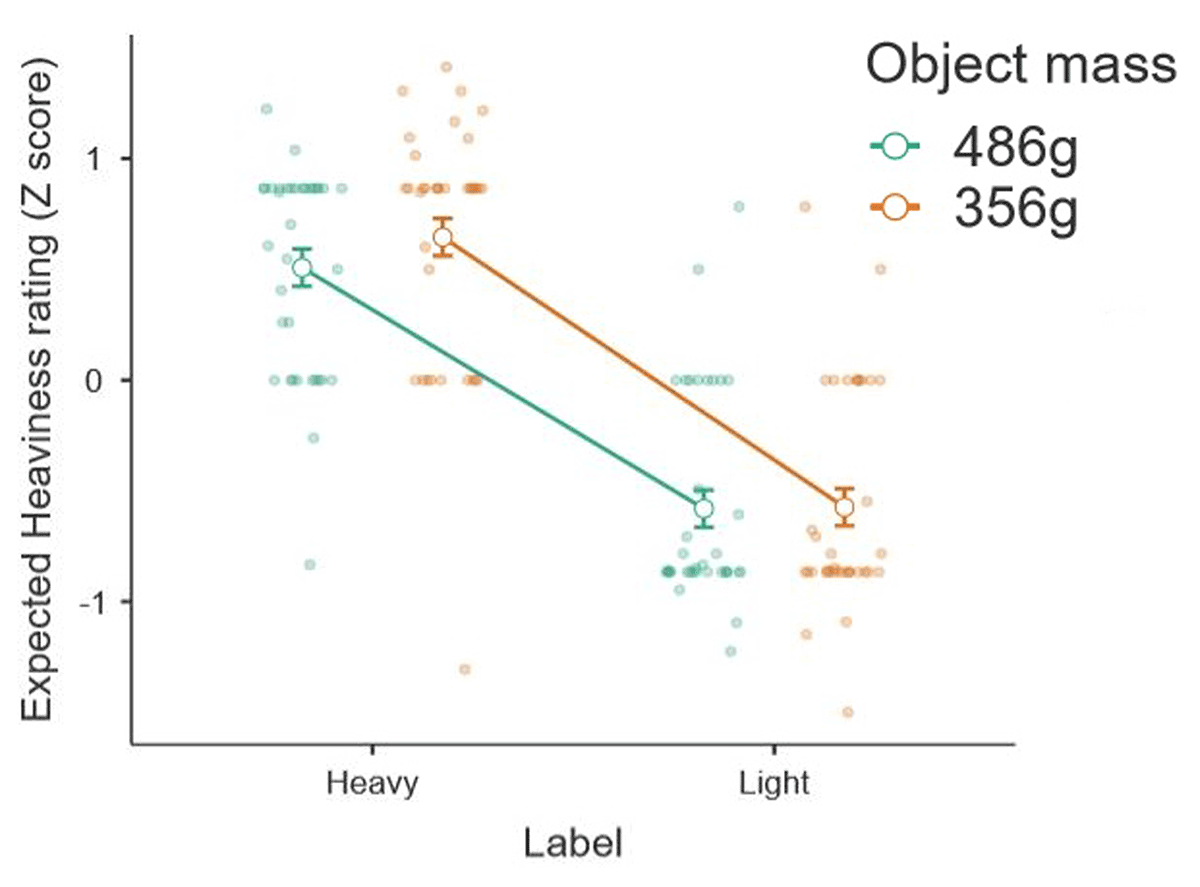
Figure 5
The average pre-lift-off perceptual ratings of expected heaviness, normalized to a z distribution, for each of the four lifted objects.
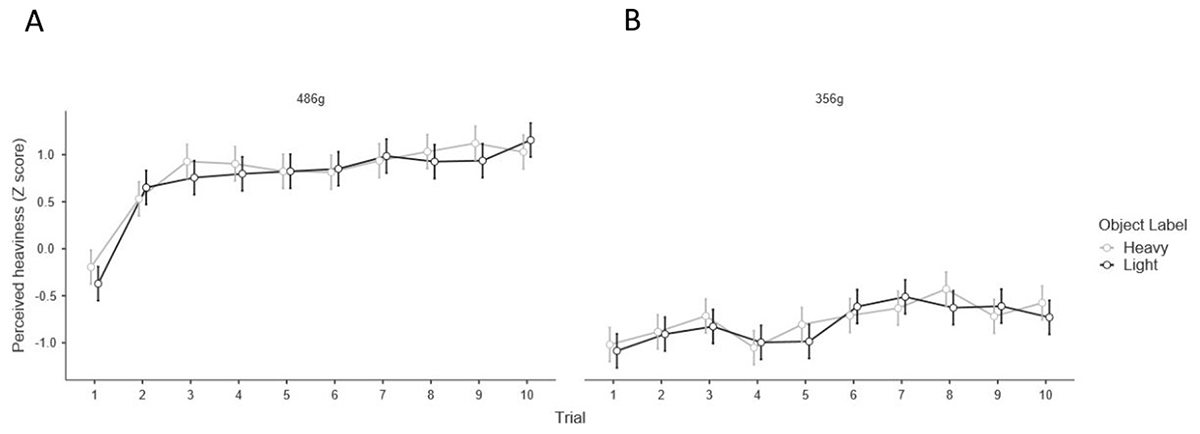
Figure 6
A. Perceived heaviness, normalised to a z distribution, across all trials for the 486 g objects labelled ‘heavy’ and ‘light’ and B. the 356 g objects labelled ‘heavy’ and ‘light’. Error bars show 95% confidence intervals.