
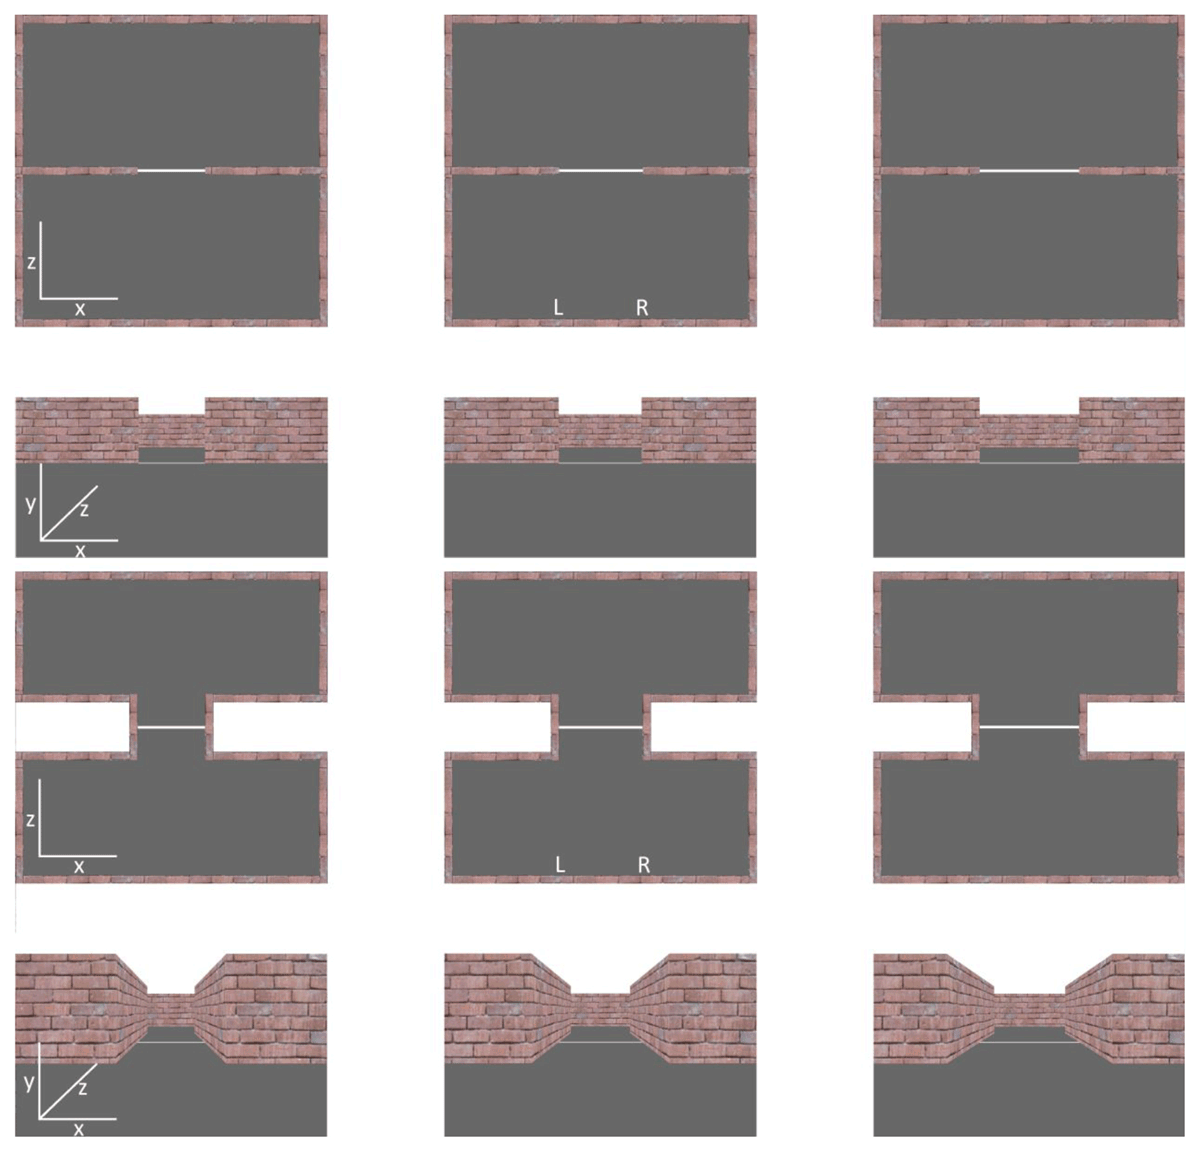
Figure 1
Sample top-down and first-person views of the room for all three gap widths for the doorway (upper panel) and corridor (lower panel) conditions. The upper row in each panel shows a top-down view of the layout of the room. The lower row in each panel shows the first-person view of the room when positioned along the exact midline of the room (note that in the actual experiment starting positions were always to the left or right of centre, as indicate by the labels ‘L’ and ‘R’). Columns in each panel show the three gap widths. Axis labels ‘x, y, z’ indicate the realtive orientation within each view.
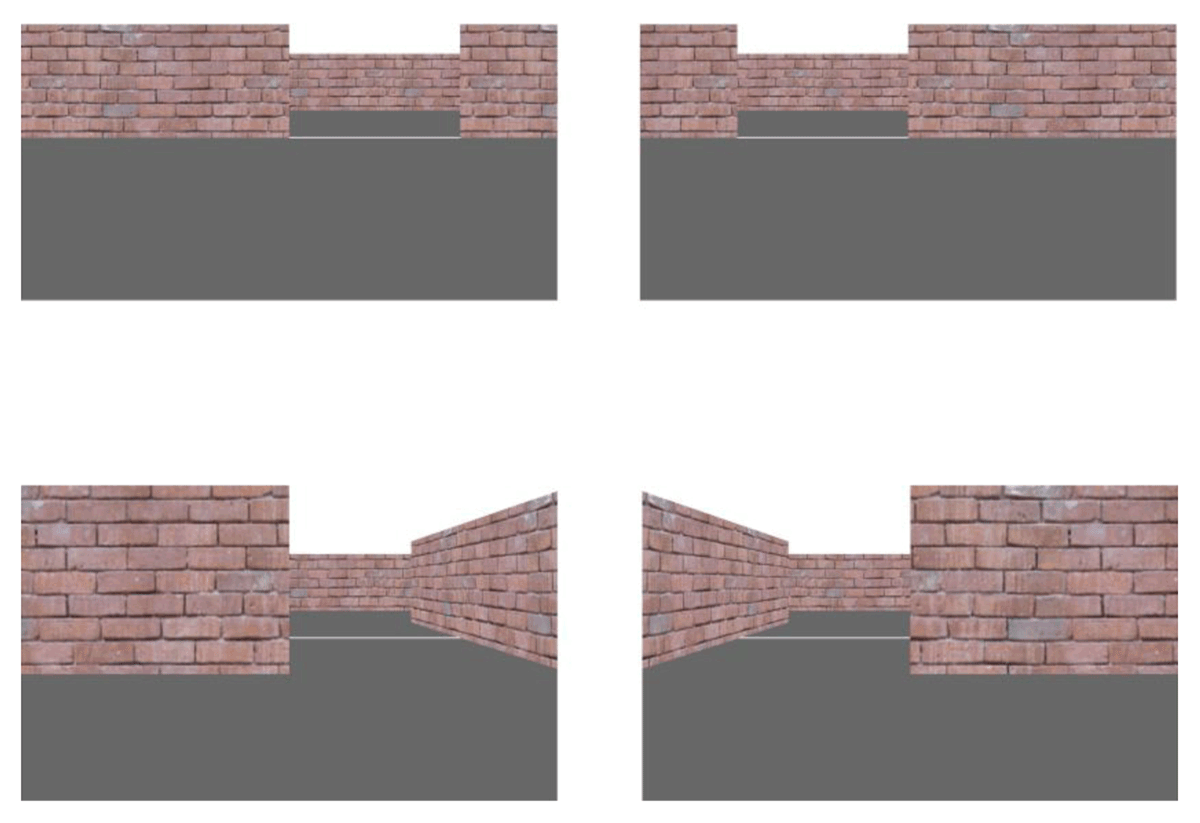
Figure 2
Sample first-person views of the wide gap width from the left (leftmost panel) and right (rightmost panel) starting positions for the doorway (upper panel) and corridor (lower panel) conditions.
Table 1
Pearson Correlations Among Mean Threshold Bisection and Line Bisection Biases.
| Measure | 1 | 2 | 3 | 4 | 5 |
|---|---|---|---|---|---|
| 1. Doorway Early point | _ | ||||
| 2. Doorway Midpoint | .749** | _ | |||
| 3. Corridor Early point | _ | _ | _ | ||
| 4. Corridor Midpoint | _ | _ | .799** | _ | |
| 5. Line Bisection | .064 | –.009 | .028 | .106 | _ |
[i] ** Correlation is significant at the 0.01 level (2-tailed).
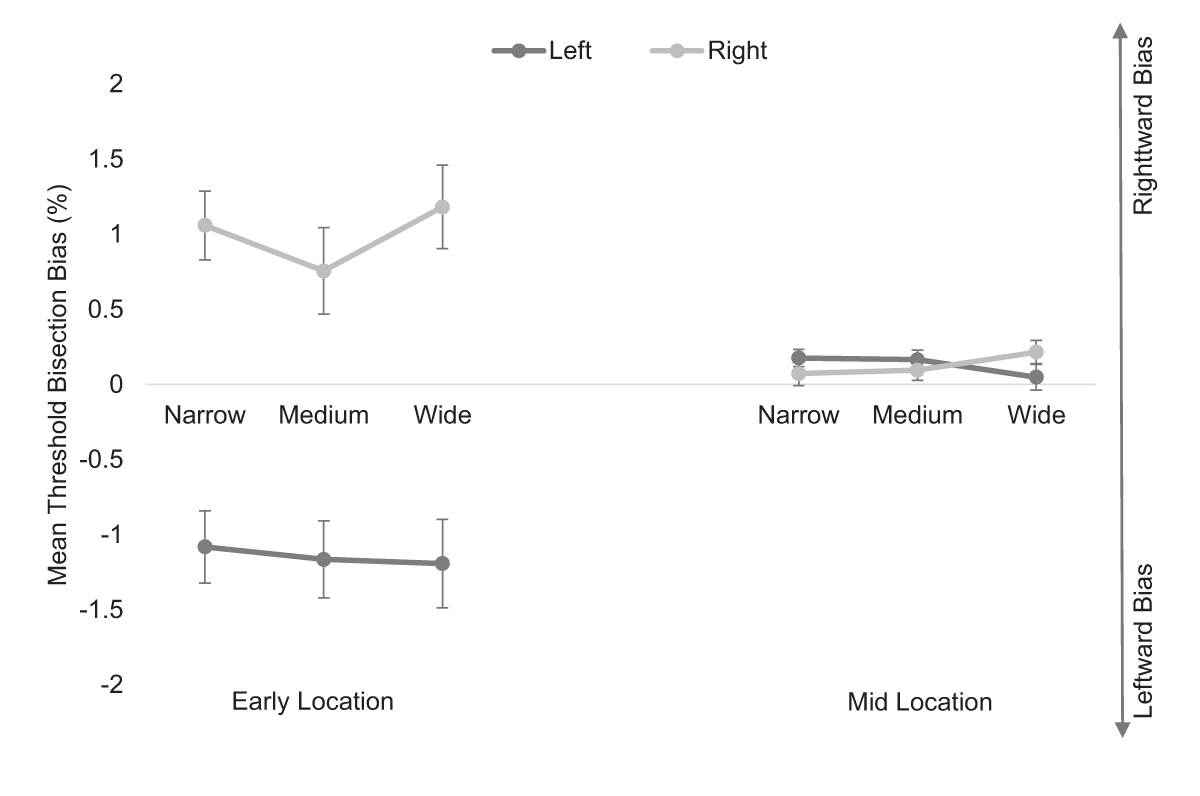
Figure 3
Mean threshold bisection bias (%) for the doorway condition at the early point (leftmost panel) and midpoint (rightmost panel) locations for the left (dark lines) and right (light lines) starting positions for each gap width. Error bars show standard errors.
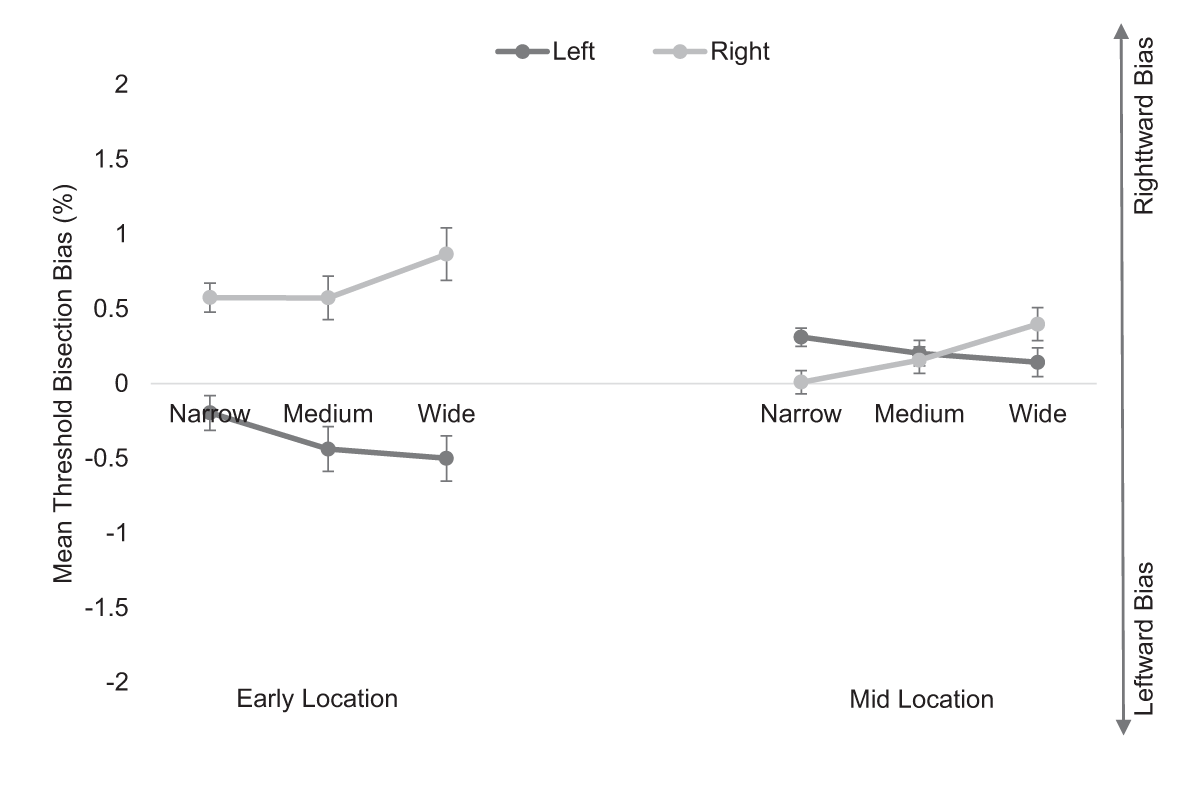
Figure 4
Mean threshold bisection bias (%) for the corridor condition at the early (leftmost panel) and midpoint (rightmost panel) locations for the left (dark lines) and right (light lines) starting positions for each gap width. Error bars show standard errors.
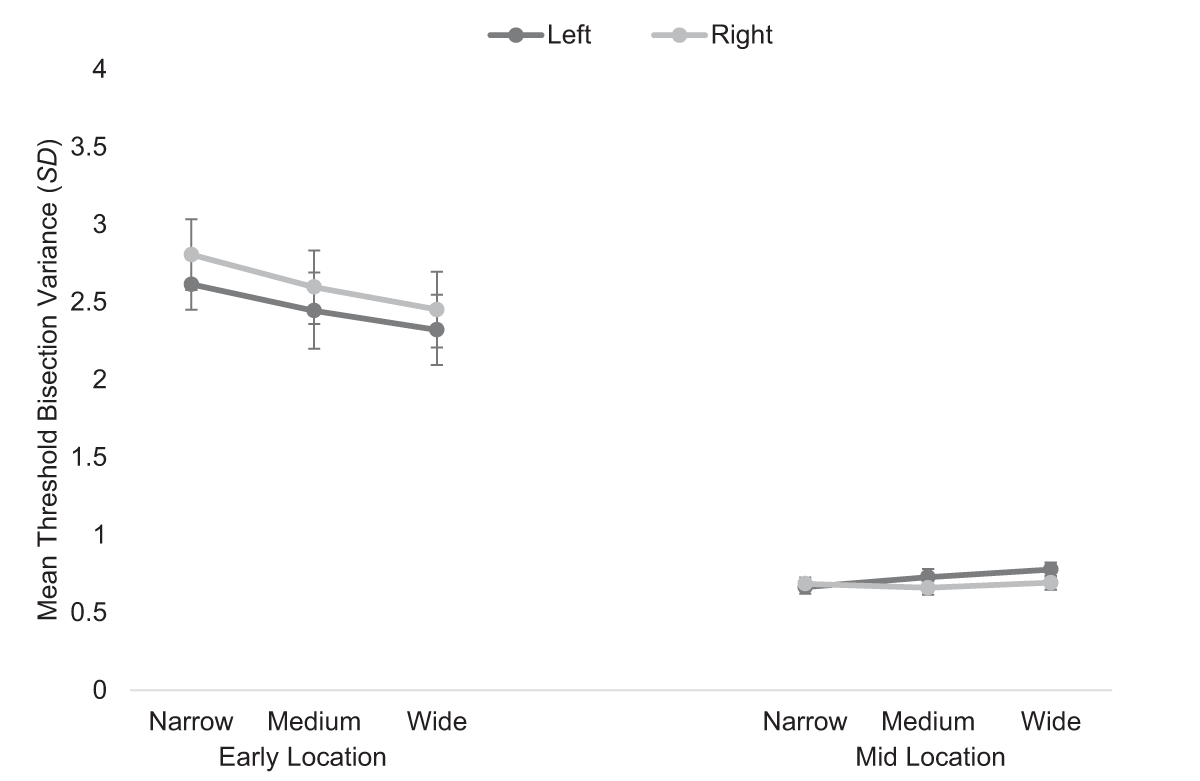
Figure 5
Mean threshold bisection variance (SD) for the doorway condition at the early (leftmost panel) and midpoint (rightmost panel) locations for the left (dark lines) and right (light lines) starting positions for each gap width. Error bars show standard errors.
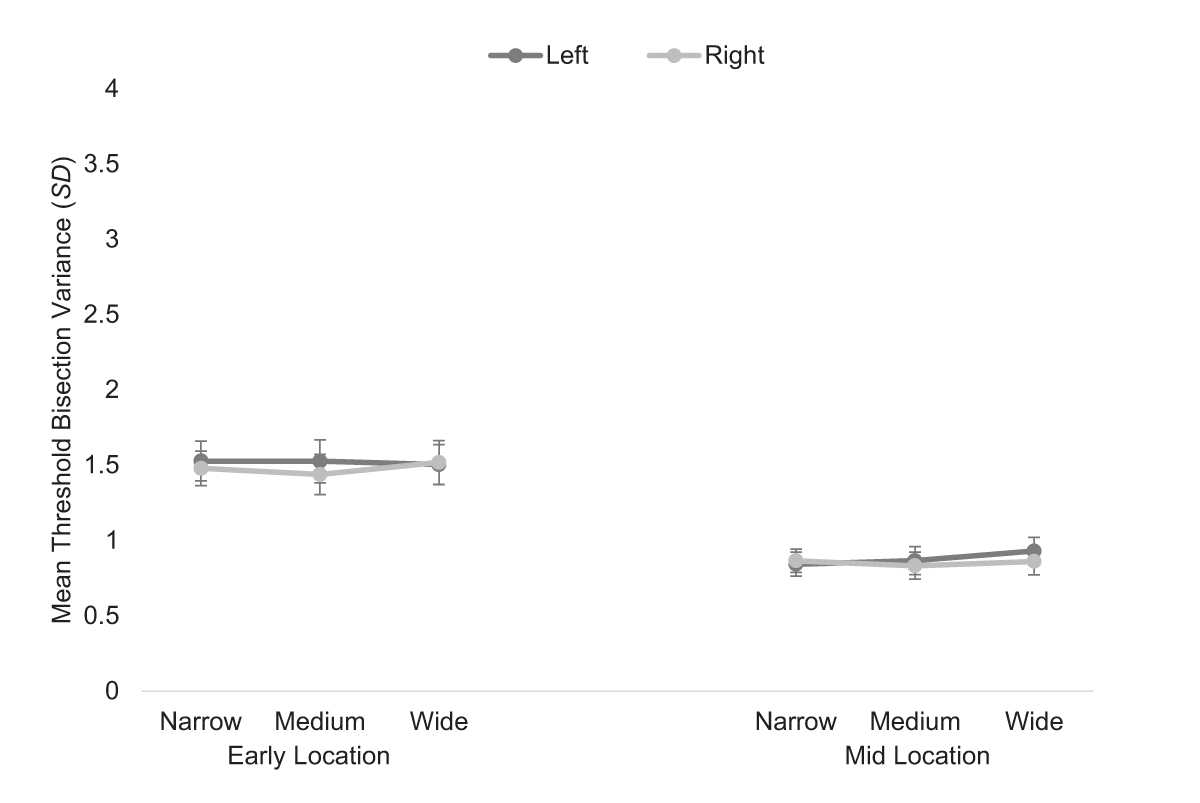
Figure 6
Mean threshold bisection variance (SD) for the corridor condition at the early (leftmost panel) and midpoint (rightmost panel) locations for the left (dark lines) and right (light lines) starting positions for each gap width. Error bars show standard errors.