

Figure 1
Examples of the selected images. The top row presents an example image for each of the indoor categories. From left to right: bathroom (badkamer), cockpit (cockpit), airport terminal (luchthavenhal), bedroom (slaapkamer), kitchen (keuken), living room (living), and conference room (vergaderruimte). The bottom row presents an example image for each of the outdoor categories. From left to right: mountain (berg), bridge (brug), playground (speeltuin), pasture (wei), house (gevel van een huis), amusement park (pretpark), and skyscraper (wolkenkrabber). The Dutch labels are between brackets. All images were taken from the FIGRIM-dataset (Bylinskii et al., 2015).
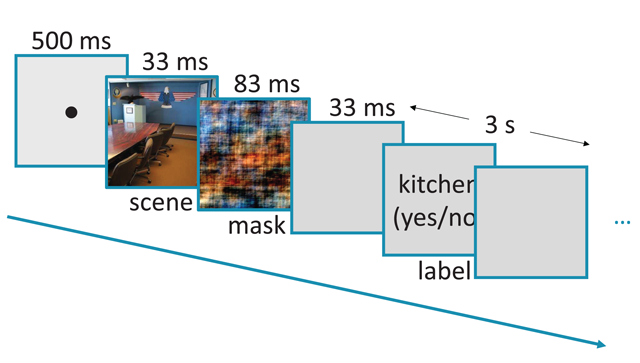
Figure 2
Schematic of the rapid-scene categorization task.
Table 1
Descriptive Statistics for Categorizability Scores per Category.
| Living room | Bridge | Kitchen | Bathroom | Conference room | Bedroom | Airport terminal | Amusement park | Playground | Mountain | Cockpit | House | Pasture | Skyscraper | |
|---|---|---|---|---|---|---|---|---|---|---|---|---|---|---|
| Mean | .55 | .60 | .63 | .64 | .65 | .66 | .67 | .70 | .73 | .82 | .85 | .87 | .88 | .89 |
| Median | .56 | .64 | .65 | .69 | .64 | .69 | .69 | .76 | .79 | .85 | .88 | .89 | .90 | .90 |
| SD | .17 | .21 | .15 | .19 | .18 | .16 | .14 | .23 | .19 | .09 | .10 | .08 | .10 | .06 |
| Min | .22 | .17 | .20 | .27 | .30 | .28 | .27 | .15 | .23 | .61 | .43 | .61 | .40 | .77 |
| Max | .87 | .97 | .95 | .92 | .92 | .94 | .90 | .96 | .94 | .97 | .97 | .98 | .99 | .97 |
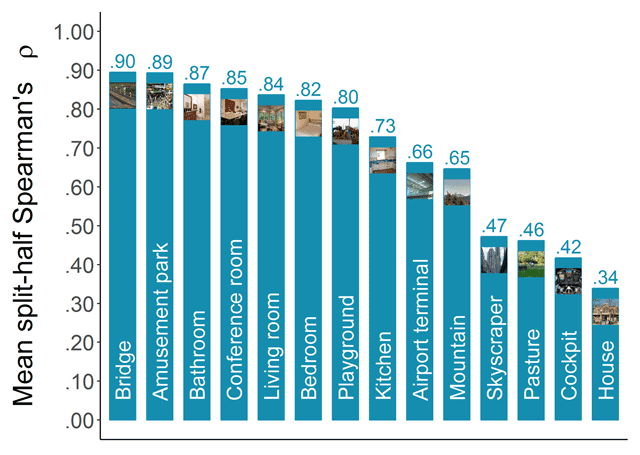
Figure 3
Consistency of categorizability scores across participants. Mean-split-half Spearman’s rank correlations were calculated based on 1000 random splits.
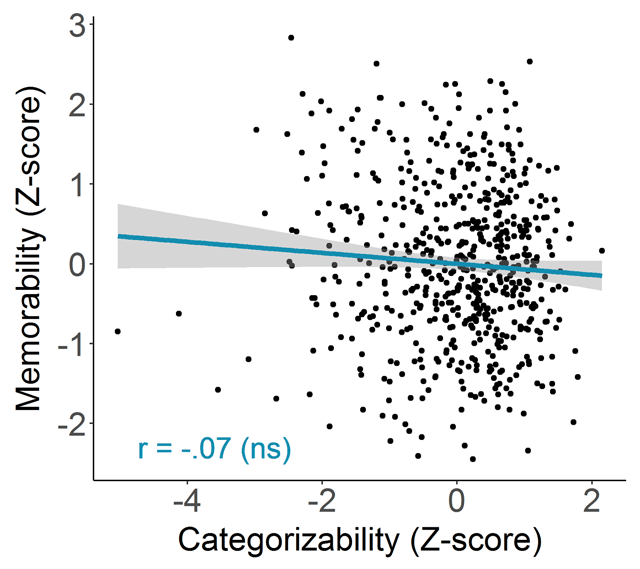
Figure 4
Memorability in function of categorizability. Each point represents an image (N = 616). The blue line indicates the best fitting regression line and the bands show 95% confidence intervals. The corresponding Pearson correlation is indicated in the bottom left corner.
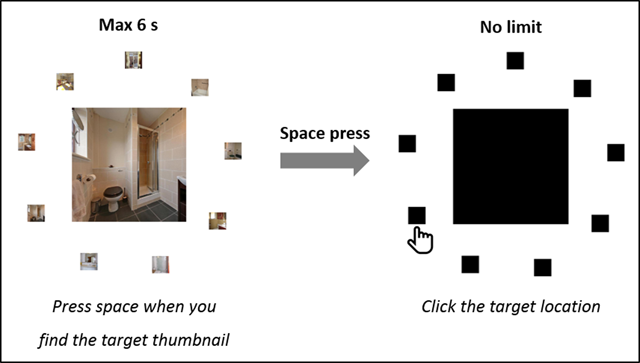
Figure 5
Schematic of the thumbnail search task.
Table 2
Descriptive Statistics for Shrinkability Scores per Category.
| Skyscraper | Bridge | Bedroom | Mountain | Conference room | Amusement park | Pasture | House | Bathroom | Cockpit | Living room | Kitchen | Airport | Playground | |
|---|---|---|---|---|---|---|---|---|---|---|---|---|---|---|
| Mean | 2.03 | 2.11 | 2.12 | 2.21 | 2.23 | 2.30 | 2.30 | 2.34 | 2.38 | 2.45 | 2.45 | 2.48 | 2.50 | 2.59 |
| Median | 2.03 | 2.05 | 2.05 | 2.10 | 2.25 | 2.20 | 2.17 | 2.29 | 2.33 | 2.59 | 2.49 | 2.46 | 2.39 | 2.59 |
| SD | 0.52 | 0.56 | 0.40 | 0.47 | 0.45 | 0.71 | 0.55 | 0.45 | 0.47 | 0.56 | 0.50 | 0.44 | 0.63 | 0.65 |
| Min | 0.88 | 1.00 | 1.47 | 1.18 | 1.30 | 1.12 | 1.46 | 1.35 | 1.48 | 1.05 | 1.41 | 1.56 | 0.89 | 1.37 |
| Max | 3.37 | 3.69 | 3.06 | 3.08 | 3.20 | 4.82 | 3.61 | 3.38 | 3.35 | 3.35 | 3.39 | 3.44 | 4.06 | 4.14 |
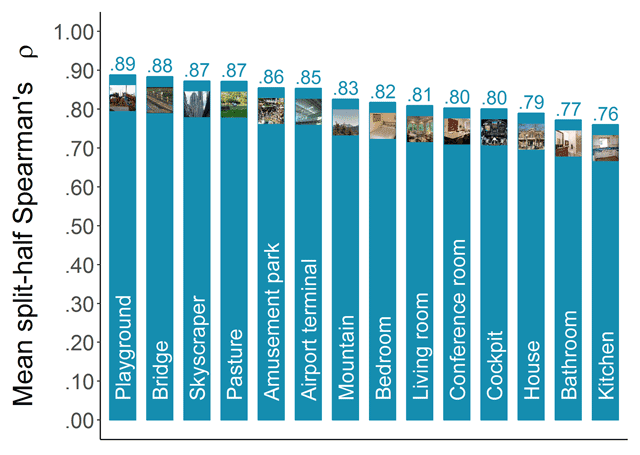
Figure 6
Consistency of shrinkability scores across participants. Mean-split-half Spearman’s rank correlations were calculated based on 1000 random splits.
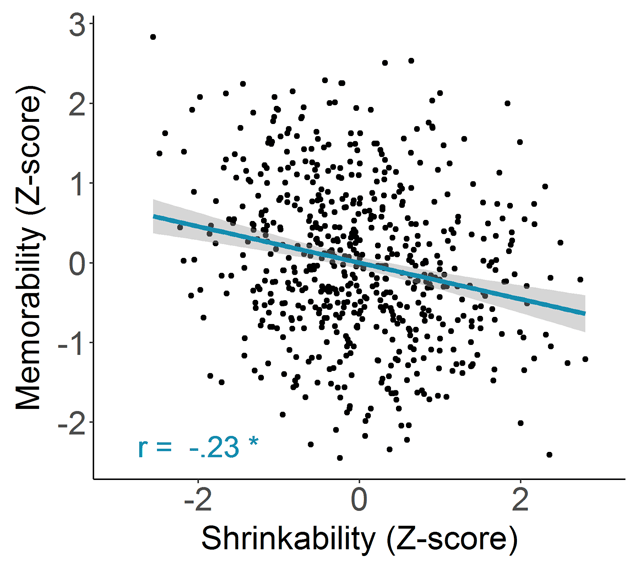
Figure 7
Memorability in function of shrinkability. Each point represents an image (N = 616). The blue line indicates the best fitting regression line, while the bands refer to 95% confidence intervals. The corresponding Pearson correlation is indicated in the bottom left corner. Note that because of the way shrinkability was operationalized (i.e., in terms of RTs), lower values indicate higher shrinkability.
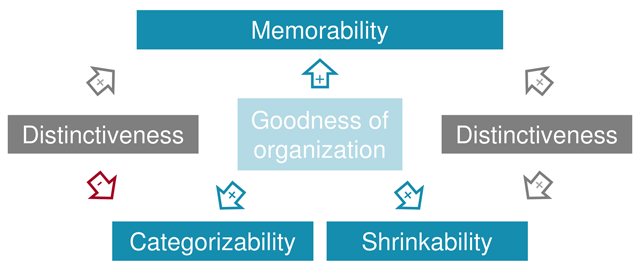
Figure 8
Visualization of the theoretical rationale behind Study 3.
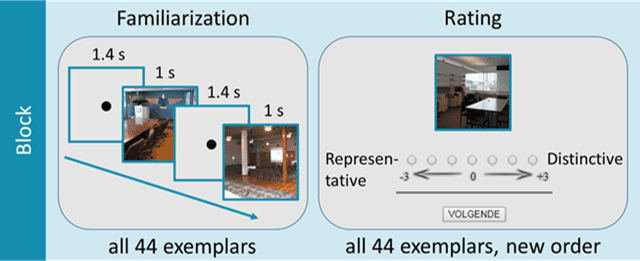
Figure 9
Schematic of one block of the online distinctiveness study.
Table 3
Descriptive Statistics for Distinctiveness Scores per Category.
| Kitchen | Conference room | Bathroom | Cockpit | Bedroom | Pasture | Living room | Playground | Airport | House | Mountain | Skyscraper | Amusement park | Bridge | |
|---|---|---|---|---|---|---|---|---|---|---|---|---|---|---|
| Mean | –1.10 | –1.08 | –0.96 | –0.96 | –0.93 | –0.93 | –0.87 | –0.87 | –0.79 | –0.78 | –0.78 | –0.72 | –0.69 | –0.67 |
| Median | –1.15 | –1.22 | –1.18 | –1.05 | –1.01 | –1.18 | –1.06 | –1.09 | –0.99 | –1.13 | –1.01 | –0.80 | –0.75 | –0.62 |
| SD | 0.69 | 0.83 | 0.94 | 0.94 | 0.82 | 1.00 | 0.85 | 0.90 | 0.71 | 1.09 | 0.84 | 0.74 | 0.89 | 0.67 |
| Min | –2.09 | –2.24 | –2.24 | –2.17 | –2.12 | –2.36 | –2.05 | –2.05 | –1.93 | –2.24 | –1.84 | –1.81 | –2.00 | –1.96 |
| Max | 1.95 | 1.22 | 1.20 | 2.05 | 0.86 | 1.13 | 1.20 | 1.28 | 1.09 | 1.91 | 1.23 | 1.19 | 1.26 | 0.88 |
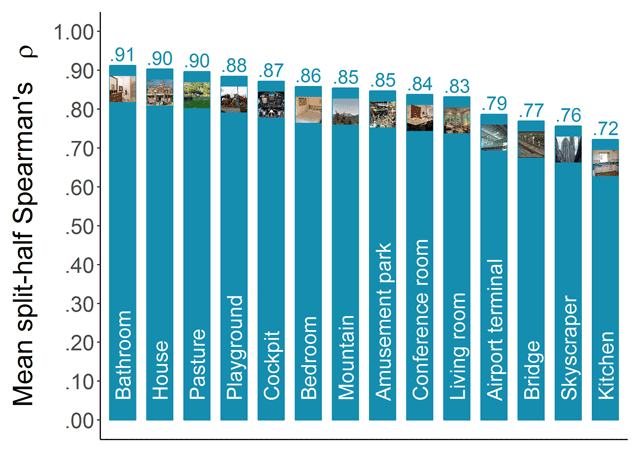
Figure 10
Consistency of distinctiveness scores across participants. Mean-split-half Spearman’s rank correlations were calculated based on 1000 random splits.
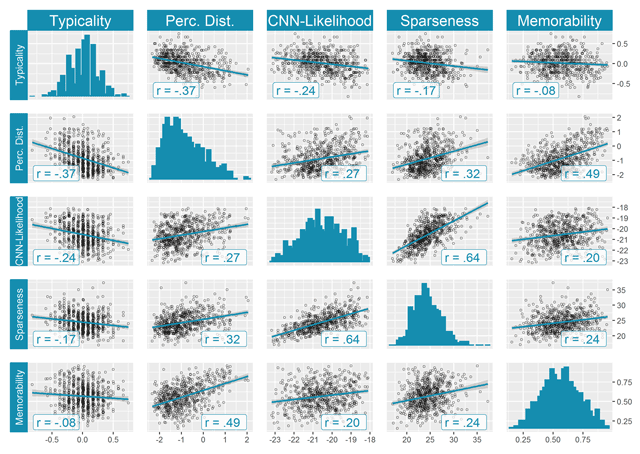
Figure 11
Comparison of different operationalizations of distinctiveness. All reported Pearson correlations except one were significant at an alpha level of .001, even after correcting for multiple testing using the Bonferroni correction. The exception is the correlation between typicality and memorability, for which we found a p value of .05.