
Table 1
Information available for each recording session of CPR testing and practice. Terms in italics correspond to variable labels in the raw data files.
| Category (type) | Rows | Description of category information | Example type2 information |
|---|---|---|---|
| CprSessionInfo | 14 | Info about manikin settings and start and end times of each recording. | totalTime |
| CprSessionStatistics | 76 | Means and SDs for performance metrics and information for visuals displayed on SimPad. | compCount, ventMeanVolume, ventTooMuchVolumePercentage |
| CprSessionScore | 23 | Overall score, compression, and ventilation scores, and score reductions applied. | overallScore, ventOverallScore, compRateHighScoreReduction |
| CprInactivityCPR | variable | Coding of the inactivity between compression and ventilation events. | compInactivity |
| CprCompEvent | variable | Timestamped details on each recorded compression. | compDepth, compReleaseDepth |
| CprVentEvent | variable | Timestamped details on each recorded ventilation. | ventVolume |
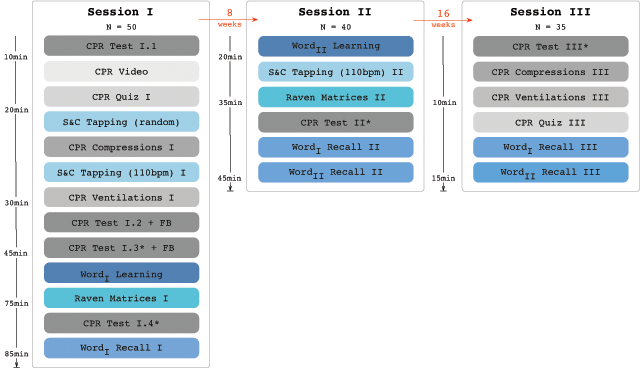
Figure 1
Overview of the data collection protocol. Asterisks (*) indicate that participants were trained until CPR performance was above criterion (>75%).
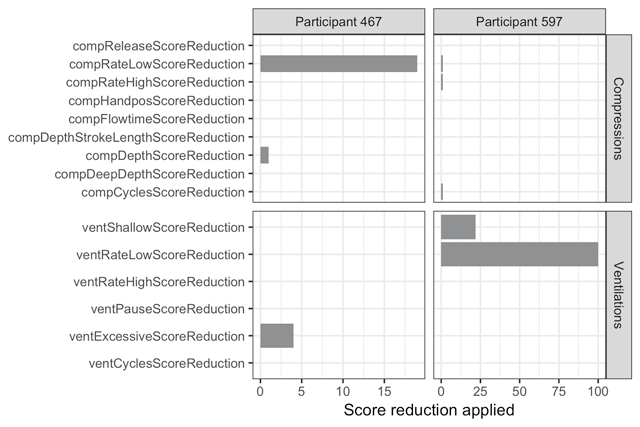
Figure 2
An example of the reductions applied to the scoring for two participants performing a complete run-through of CPR during CPR TEST I.2+FB. The labels on the y-axis correspond to entries in the raw data in the column type2 (also see Table 1).
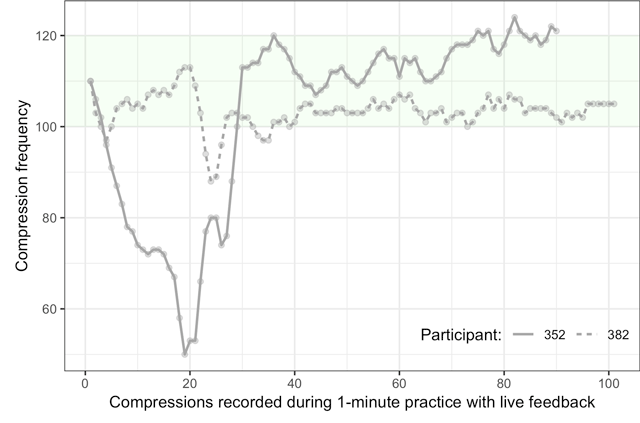
Figure 3
Compression frequencies recorded during CPR Compressions I for the most and least stable participants.
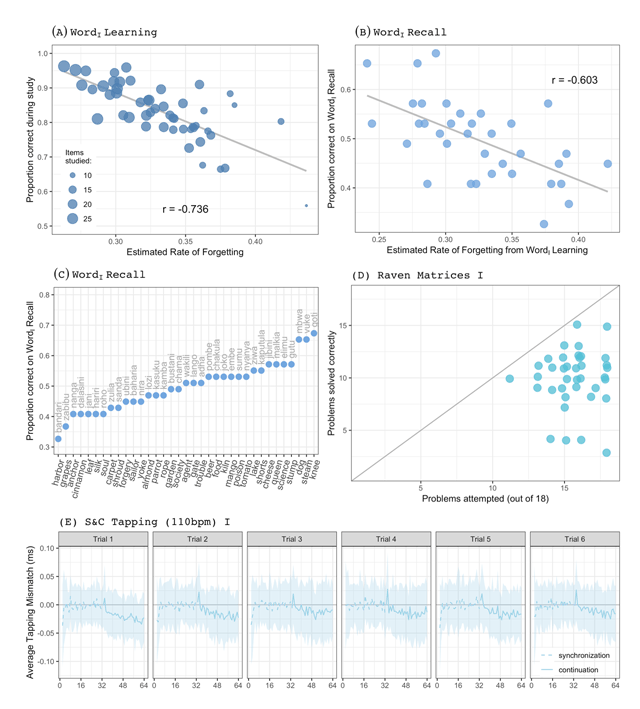
Figure 4
An overview of the type of data that is available for various components. Plot titles refer to labels used in Figure 1. Details are provided in-text. All plots based on data from Session 1 only.