
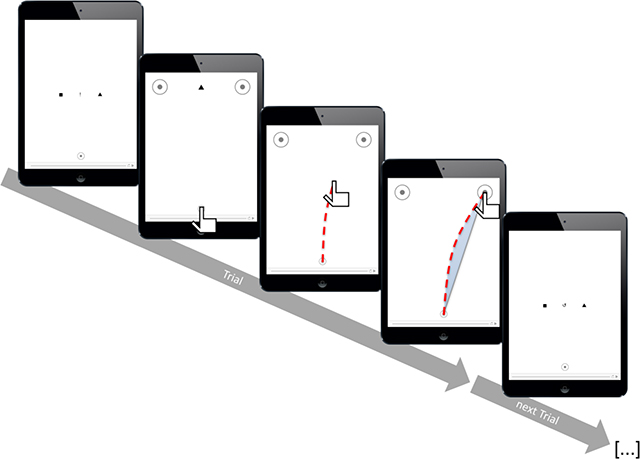
Figure 1
Procedure of the experiments. Before each trial, participants were reminded of the mapping rule, together with the instruction to either perform a standard response according to the displayed mapping rule or to negate this mapping rule in the next trial. As soon as participants put their finger on the starting area, the mapping rule disappeared, and the two target areas and the target symbol appeared, prompting movements to the left or the right. The target symbol disappeared when the finger left the starting area. A trial was completed when the finger was lifted from the screen inside one of the two target areas, and the next trial started immediately with the corresponding standard or negation instructions. The stimuli shown here are taken from Experiment 1, for Experiment 2, the mapping rule (first and last screen) would consist of male and female symbols (♂/♀) rather than square and triangle, and the stimulus in the second screen would be replaced with a photo of a male or a female face.
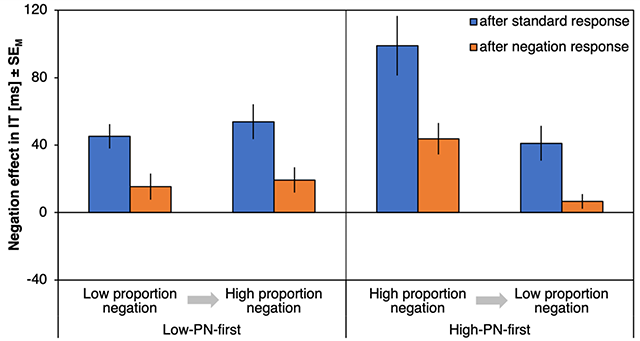
Figure 2
Results of Experiment 1, initiation times. Negation effects on initiation times (ΔIT), plotted as a function of proportion negation (PN) and proportion order (abscissa) and preceding response type (left, blue bars for trials following standard responses; right, orange bars for trials following negation responses). Error bars represent standard errors of the mean.
Table 1
Results of Experiment 1. Overview of the ANOVA results of Experiment 1 for initiation times (ITs), movement times (MTs) and areas under the curve (AUCs). All analyses were run on the negation effects in each design cell (i.e., current negation minus current standard).
| Effect | F | p | ηp2 | |
|---|---|---|---|---|
| IT | preceding response type (N-1) | 24.27 | <.001 | .25 |
| proportion negation (PN) | 22.34 | <.001 | .24 | |
| proportion order (PO) | 2.08 | .154 | .03 | |
| N-1 × PN | 4,62 | .035 | .06 | |
| N-1 × PO | <1.00 | .424 | .01 | |
| PN × PO | 13.03 | .001 | .15 | |
| N-1 × PN × PO | 1.79 | .185 | .02 | |
| MT | preceding response type (N-1) | 68.33 | <.001 | .49 |
| proportion negation (PN) | 24.11 | <.001 | .25 | |
| proportion order (PO) | 1.36 | .248 | .02 | |
| N-1 × PN | 4.59 | .035 | .06 | |
| N-1 × PO | <1.00 | .920 | <.01 | |
| PN × PO | <1.00 | .784 | <.01 | |
| N-1 × PN × PO | 4.24 | .043 | .06 | |
| AUC | preceding response type (N-1) | 53.25 | <.001 | .43 |
| proportion negation (PN) | 1.94 | .168 | .03 | |
| proportion order (PO) | <1.00 | .636 | <.01 | |
| N-1 × PN | 6.82 | .011 | .09 | |
| N-1 × PO | 1.54 | .219 | .02 | |
| PN × PO | 4.10 | .047 | .05 | |
| N-1 × PN × PO | 7.41 | .008 | .09 |
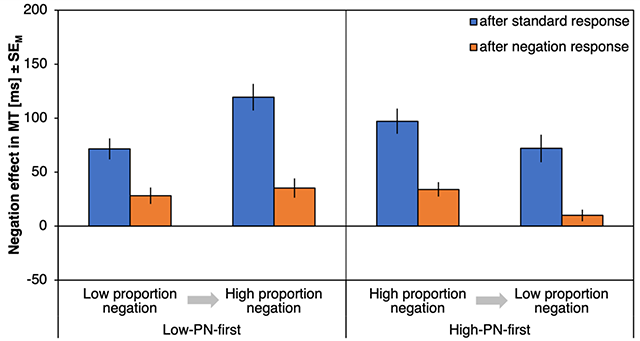
Figure 3
Results of Experiment 1, movement times. Negation effects on movement times (ΔMT), plotted as a function of proportion negation and proportion order (abscissa) and preceding response type (left, blue bars for trials following standard responses; right, orange bars for trials following negation responses). Error bars represent standard errors of the mean.
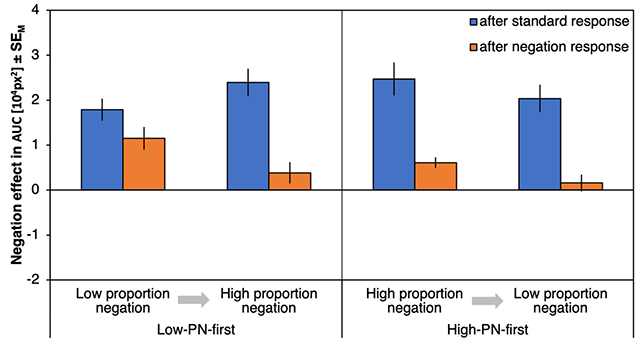
Figure 4
Results of Experiment 1, areas under the curve. Negation effects on areas under the curve (ΔAUC), plotted as a function of proportion negation and proportion order (abscissa) and preceding response type (left, blue bars for trials following standard responses; right, orange bars for trials following negation responses). Error bars represent standard errors of the mean.
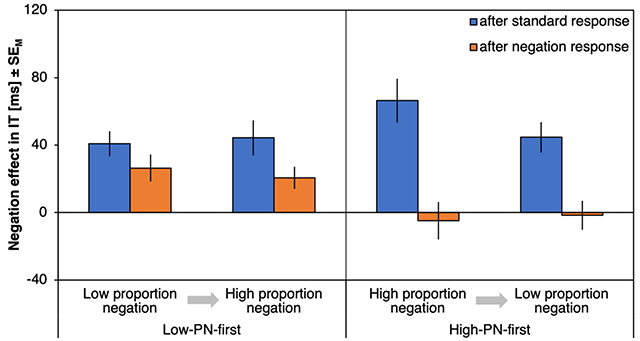
Figure 5
Results of Experiment 2, initiation times. Negation effects on initiation times (ΔIT), plotted as a function of proportion negation and proportion order (abscissa) and preceding response type (left, blue bars for trials following standard responses; right, orange bars for trials following negation responses). Error bars represent standard errors of the mean.
Table 2
Results of Experiment 2. Overview of the ANOVA results of Experiment 2 for initiation times (ITs), movement times (MTs) and areas under the curve (AUCs). All analyses were run on the negation effects in each design cell (i.e., current negation minus current standard).
| Effect | F | p | ηp2 | |
|---|---|---|---|---|
| IT | preceding response type (N-1) | 42.05 | <.001 | .36 |
| proportion negation (PN) | <1.00 | .375 | .01 | |
| proportion order (PO) | <1.00 | .502 | <.01 | |
| N-1 × PN | 4.68 | .034 | .06 | |
| N-1 × PO | 10.97 | .001 | .13 | |
| PN × PO | 1.23 | .271 | .02 | |
| N-1 × PN × PO | <1.00 | .336 | .01 | |
| MT | preceding response type (N-1) | 102.42 | <.001 | .58 |
| proportion negation (PN) | <1.00 | .493 | .01 | |
| proportion order (PO) | 1.64 | .204 | .02 | |
| N-1 × PN | 8.36 | .005 | .10 | |
| N-1 × PO | 6.58 | .012 | .08 | |
| PN × PO | <1.00 | .493 | .01 | |
| N-1 × PN × PO | 12.95 | .001 | .15 | |
| AUC | preceding response type (N-1) | 124.53 | <.001 | .62 |
| proportion negation (PN) | 8.06 | .006 | .10 | |
| proportion order (PO) | <1.00 | .431 | .01 | |
| N-1 × PN | 20.28 | <.001 | .21 | |
| N-1 × PO | 1.87 | .176 | .02 | |
| PN × PO | 2.16 | .146 | .03 | |
| N-1 × PN × PO | 3.50 | .065 | .05 |
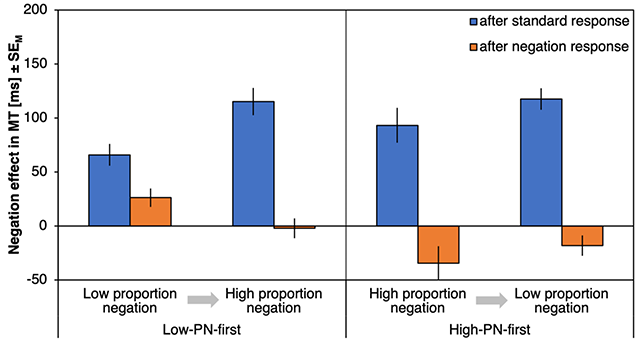
Figure 6
Results of Experiment 2, movement times. Negation effects on movement times (ΔMT), plotted as a function of proportion negation and proportion order (abscissa) and preceding response type (left, blue bars for trials following standard responses; right, orange bars for trials following negation responses). Error bars represent standard errors of the mean.
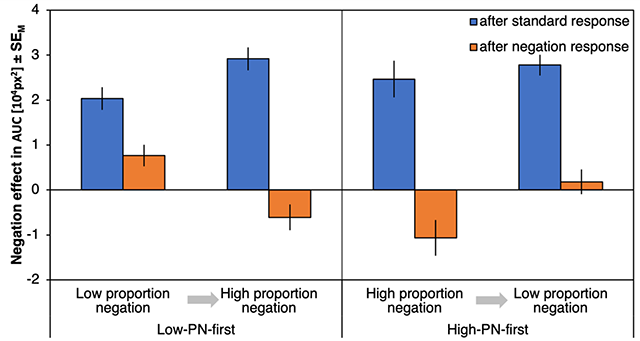
Figure 7
Results of Experiment 2, areas under the curve. Negation effects on areas under the curve (ΔAUC), plotted as a function of proportion negation and proportion order (abscissa) and preceding response type (left, blue bars for trials following standard responses; right, orange bars for trials following negation responses). Error bars represent standard errors of the mean.
Table 3
Mean values (and SDs) for the negation effect on each dependent variable, separately for each combination of experimental factors, and for each experiment. Initiation time (IT) and movement time (MT) are measured in milliseconds, area under the curve (AUC) is measured in px2.
| Low-PN-first group | High-PN-first group | ||||||||
|---|---|---|---|---|---|---|---|---|---|
| Low-PN | High-PN | High-PN | Low-PN | ||||||
| After standard | After negation | After standard | After negation | After standard | After negation | After standard | After negation | ||
| Experiment 1 | ΔIT | 45 | 15 | 54 | 19 | 99 | 44 | 41 | 7 |
| (44.9) | (47.7) | (64.0) | (46.4) | (106.2) | (56.1) | (62.3) | (26.3) | ||
| ΔMT | 72 | 28 | 120 | 35 | 97 | 34 | 72 | 10 | |
| (59.6) | (47.4) | (76.2) | (55.4) | (69.9) | (40.0) | (76.6) | (32.1) | ||
| ΔAUC | 17890 | 11505 | 23951 | 3824 | 24641 | 6098 | 20388 | 1561 | |
| (15032) | (15452) | (18597) | (14615) | (22020) | (7253) | (18305) | (11135) | ||
| Experiment 2 | ΔIT | 41 | 26 | 44 | 21 | 66 | –5 | 44 | –2 |
| (46.1) | (49.9) | (64.5) | (41.1) | (80.6) | (68.3) | (55.6) | (53.1) | ||
| ΔMT | 66 | 26 | 115 | –2 | 93 | –34 | 118 | –18 | |
| (63.6) | (53.2) | (78.7) | (57.7) | (100.0) | (96.4) | (61.7) | (58.5) | ||
| ΔAUC | 20350 | 7678 | 29174 | –6090 | 24681 | –10642 | 27795 | 1807 | |
| (15873) | (15036) | (15947) | (18036) | (25185) | (24485) | (14152) | (16818) | ||