
Table 1
Percentages of errors for different quantities and groups.
| Quantity | Group | |
|---|---|---|
| Control | Developmental Dyscalculia | |
| 1 | 3% | 2% |
| 2 | 2% | 2% |
| 3 | 2% | 6% |
| 4 | 2% | 5% |
| 5 | 10% | 19% |
| 6 | 27% | 38% |
| 7 | 39% | 50% |
| 8 | 43% | 51% |
| 9 | 61% | 61% |
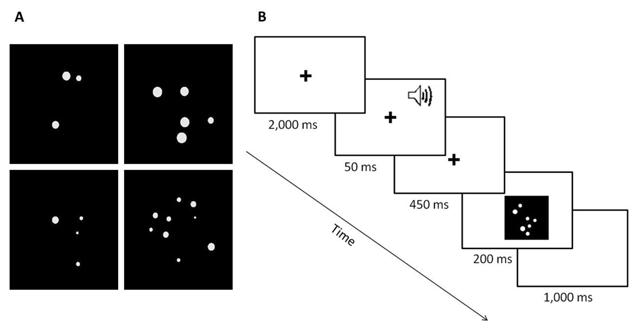
Figure 1
A) Examples of stimuli in the experiment. Left column – subitizing range; right column – counting range. B) Example of a typical trial.
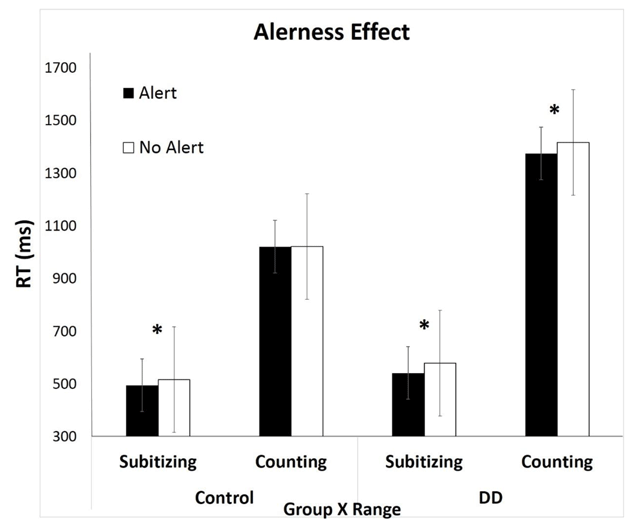
Figure 2
The alerting effect as a function of group and range. Asterisk (*) marks a significant difference. The alerting effect appears in the subitizing range for both groups (i.e., the difference between the black and the white bars), but in the counting range, there is an alerting effect only for the DD group, and not for the controls.
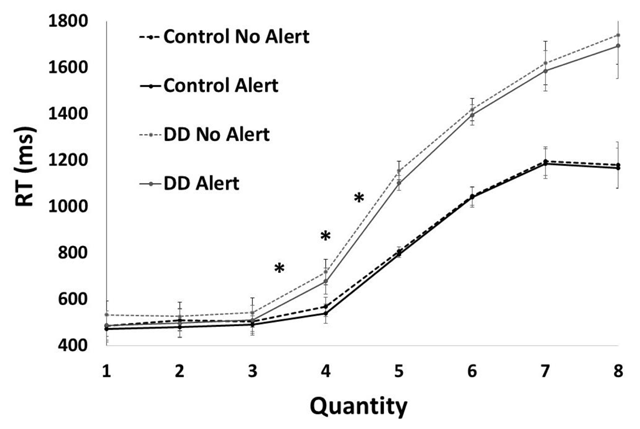
Figure 3
RT as a function of quantity for each group (control vs. DD) with and without alert. Asterisk (*) marks a significant difference. The subitizing range for the DD group was 3 vs. 4 for the control group. The RT slope was steeper for the DD group between quantities 3–4 and 4–5 vs. the control group.