
Table 1
Pairwise Comparisons of Successful Generation Rates Across Sensory Conditions.
| SENSORY MODALITY | MEAN DIFFERENCE | t(83) | SE | p | |
|---|---|---|---|---|---|
| Visual | Auditory | –1.06 | –3.09 | 0.34 | .008 |
| Audiovisual | –2.06 | –4.79 | 0.43 | <.001 | |
| Audiovisual | Auditory | 1.00 | 2.39 | 0.42 | .057 |
[i] Note. Mean differences represent Bonferroni-adjusted pairwise comparisons of successful generation rates across sensory conditions. Positive values indicate higher successful generation in the first-listed condition relative to the comparison condition, whereas negative values indicate lower successful generation. SE = standard error.
Table 2
Mean Error Rates and Rates of Successful Generation Across Sensory Conditions.
| SENSORY CONDITION | M | SD | |
|---|---|---|---|
| Omission Errors | Auditory | 1.81 | 1.80 |
| Visual | 3.35 | 2.66 | |
| Audiovisual | 1.75 | 2.01 | |
| Commission Errors | Auditory | 10.00 | 2.93 |
| Visual | 9.52 | 3.82 | |
| Audiovisual | 9.06 | 3.45 | |
| Successful Generation | Auditory | 8.19 | 2.75 |
| Visual | 7.13 | 3.24 | |
| Audiovisual | 9.19 | 3.64 |
[i] Note. Reported values reflect the average number of omission errors and commission errors made in the generation task in each sensory condition, out of 20 trials, as well as the average number of successfully generated targets during encoding across sensory conditions. M = mean; SD = standard deviation.
Table 3
Group Mean Statistics.
| ENCODING TASK | AUDITORY | VISUAL | AUDIOVISUAL |
|---|---|---|---|
| Read | 0.66 (0.19) | 0.66 (0.20) | 0.65 (0.19) |
| Generate | 0.77 (0.17) | 0.74 (0.19) | 0.78 (0.17) |
[i] Note. N = 84. Mean proportions (and standard deviations) for each group are reported. Encoding task (read, generate) and sensory condition (auditory, visual, audiovisual) were measured within subjects.
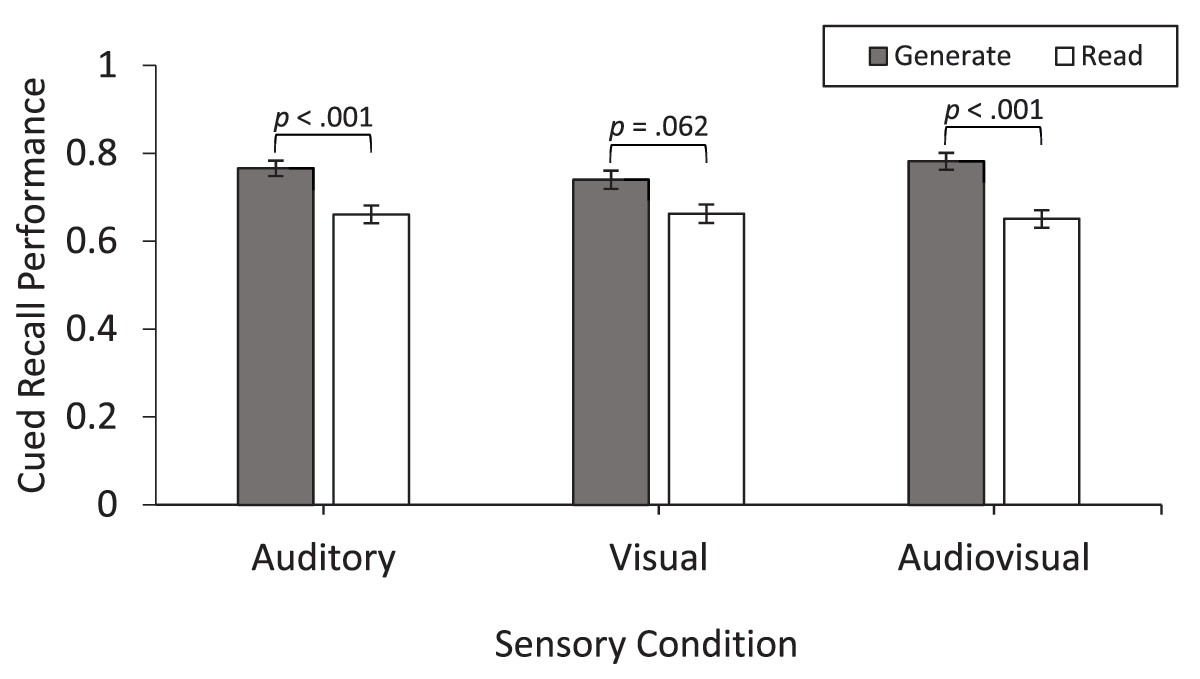
Figure 1
Generation Effect Across Sensory Modalities.
Note. The size of the generation effect across sensory encoding conditions (auditory, visual, audiovisual), measured as the proportion of items correctly recalled in cued recall test. Error bars represent standard errors of the mean.
Table 4
Post Hoc Comparisons of Generation Effect Size Across Sensory Conditions.
| SENSORY MODALITY | Mdiff | t | SE | df | pbonf | ||
|---|---|---|---|---|---|---|---|
| Original proportions | AV | A | 0.03 | 0.72 | 0.03 | 249 | .999 |
| AV | V | 0.05 | 1.53 | 0.03 | 249 | .380 | |
| A | V | 0.03 | 0.81 | 0.03 | 249 | .999 | |
| Logit-transformed values | AV | A | 0.05 | 0.16 | 0.33 | 249 | .999 |
| AV | V | 0.30 | 0.91 | 0.33 | 249 | .999 | |
| A | V | 0.25 | 0.76 | 0.33 | 249 | .999 | |
[i] Note. Post hoc comparisons of the size of the generation effect, calculated as the mean difference in cued recall performance for generated targets and read targets of the same sensory condition. Mean differences should be interpreted for original proportions. Logit-transformed values are presented to corroborate the original analysis, indicating that the obtained results are not an artifact of the distribution of proportions. A = Auditory sensory condition. V = Visual sensory condition. AV = Audiovisual sensory condition. pbonf = Bonferroni-adjusted p-values for comparing a family of three estimates.