
Table 1
Trial types and examples for the stimuli and responses.
| STIMULUS | RESPONSE | |||
|---|---|---|---|---|
| REPEATED | CHANGED | |||
| Repeated | S1: A pear appears. | R1: j key | S1: A pear appears. | R1: f key |
| S2: A pear appears. | R2: j key | S2: A pear appears. | R2: j key | |
| Changed | S1: An orange appears. | R1: j key | S1: An orange appears. | R1: f key |
| S2: A pear appears. | R2: j key | S2: A pear appears. | R2: j key | |
[i] Note: S1 and S2 vary on the same dimension (“a pear appears” or “an orange appears”). R1 is governed by the R1Cue (“the lions: left” or “the lions: right”). The R2 is determined by the S2 rule (“a pear appears” or “an orange appears”).
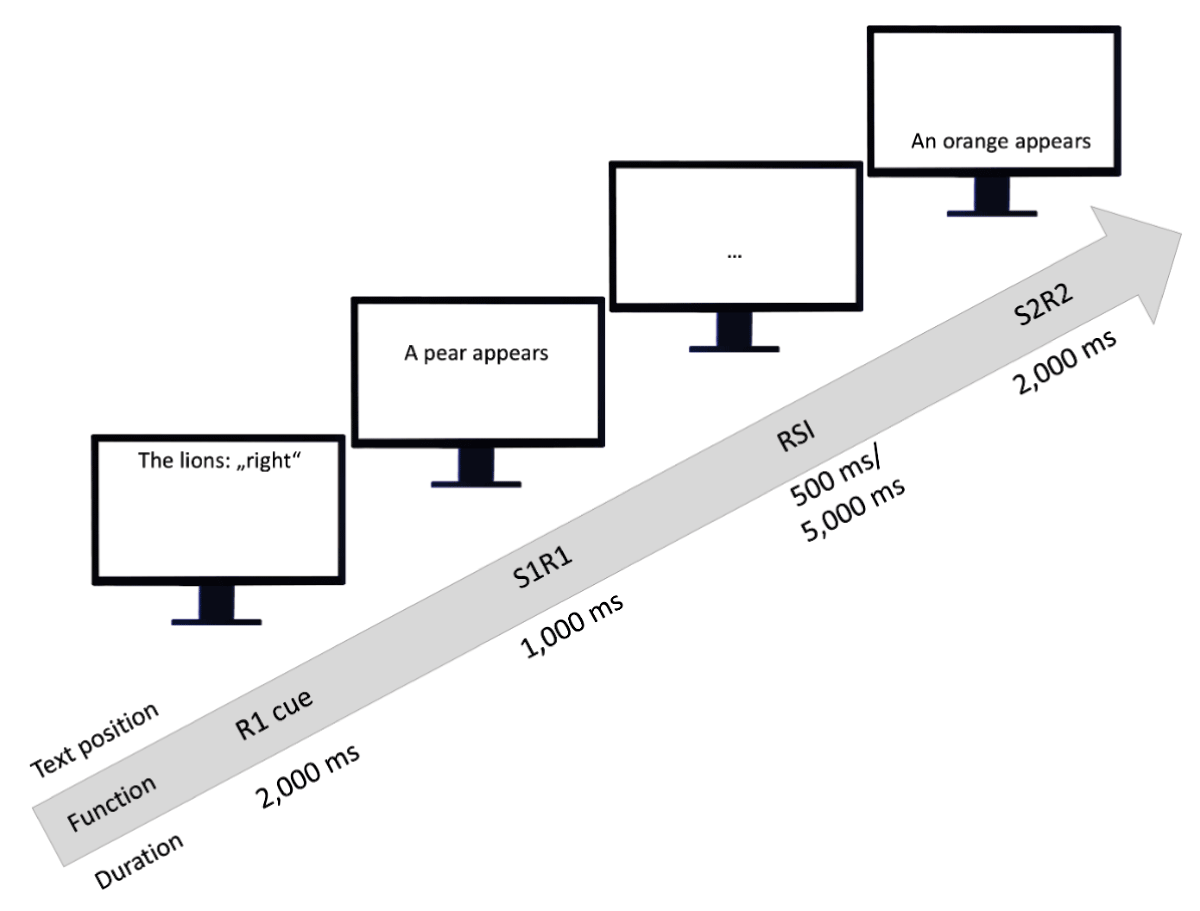
Figure 1
Example of a Trial sequence.
Note. Across each trial, the text changed its on-screen position in a downward trajectory: the R1 cue appeared near the top of the screen, S1 and RSI placeholder were displayed at a mid-screen position, and S2 near the bottom. R1 was performed at the onset of S1, R2 was executed at the onset of S2.
Table 2
Descriptive statistics (means, standard deviations in parentheses) for response times in milliseconds as a function of Stimulus, Response, RSI, and Memorization as well as PRCs by RSI and Memorization.
| MEMORIZATION | STIMULUS | RESPONSE | PRCs | ||||
|---|---|---|---|---|---|---|---|
| 500 ms-RSI | 5,000 ms-RSI | 500 ms-RSI | 5,000 ms-RSI | ||||
| REPEATED | CHANGED | REPEATED | CHANGED | ||||
| Memorizing | Changed | 771 (177) | 707 (142) | 710 (147) | 665 (133) | 144 (178) | 90 (120) |
| Repeated | 676 (136) | 755 (167) | 651 (139) | 696 (142) | |||
| Control | Changed | 707 (117) | 674 (125) | 651 (115) | 638 (106) | 62 (144) | 22 (113) |
| Repeated | 668 (131) | 698 (129) | 639 (110) | 648 (104) | |||
[i] Note. RSI = Response stimulus interval. PRCs = Partial repetition costs (reflecting the stimulus response interaction, operationalized as the performance cost when either the stimulus repeats while the response changes, or the response repeats while the stimulus changes) for response times were calculated from the participants means in each condition as follows: (StimulusChanged ResponseRepeated – StimulusRepeated ResponseRepeated) – (StimulusChanged ResponseChanged – StimulusRepeated ResponseChanged). Values are rounded to the nearest ms.
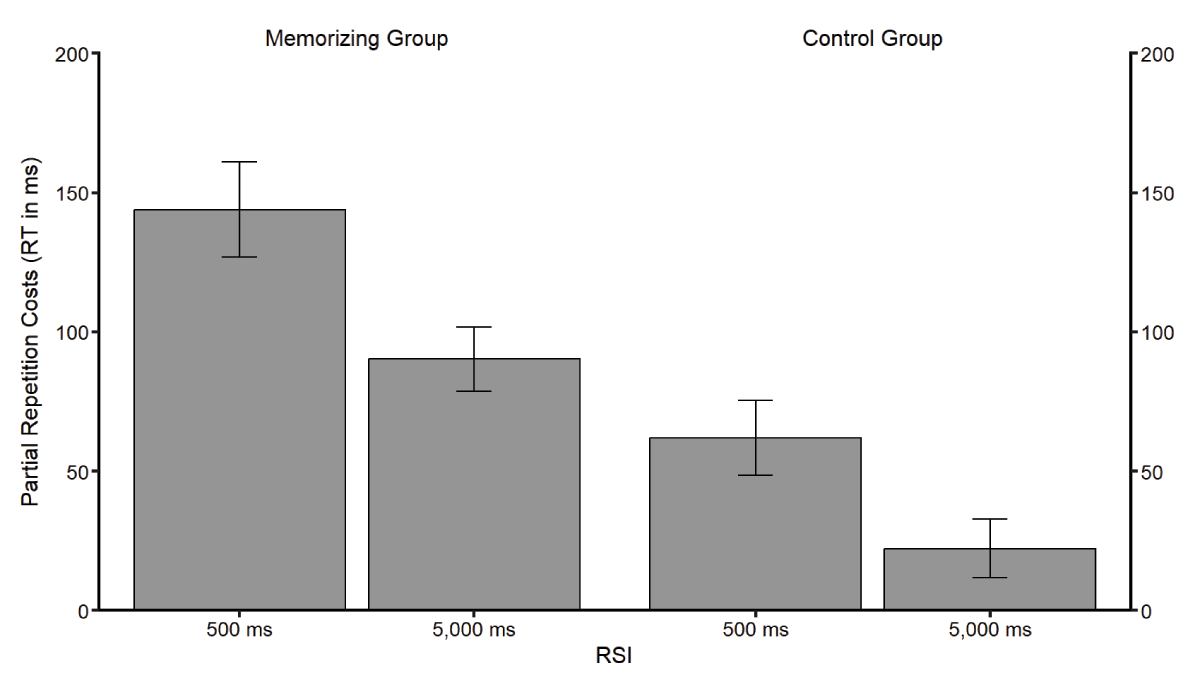
Figure 2
PRCs for response times in milliseconds as a function of Memorization and RSI.
Note. The terms “RT” and “RSI” refer to response time and response-stimulus interval, respectively. Error bars represent the standard errors of the means.
Table 3
Descriptive statistics (means, standard deviations in parentheses) for error rates in percent as a function of Stimulus, Response, RSI, and Memorization as well as PRCs by RSI and Memorization.
| MEMORIZATION | STIMULUS | RESPONSE | PRCs | ||||
|---|---|---|---|---|---|---|---|
| 500 ms-RSI | 5,000 ms-RSI | 500 ms-RSI | 5,000 ms-RSI | ||||
| REPEATED | CHANGED | REPEATED | CHANGED | ||||
| Memorizing | Changed | 13(16) | 2 (6) | 6 (11) | 4 (7) | 20 (24) | 4 (14) |
| Repeated | 3 (6) | 12 (15) | 2 (6) | 2 (6) | |||
| Control | Changed | 10 (14) | 4 (7) | 7 (11) | 5 (10) | 10 (21) | 2 (16) |
| Repeated | 6 (9) | 9 (13) | 4 (7) | 4 (8) | |||
[i] Note. RSI = Response stimulus interval. PRCs = Partial repetition costs (reflecting the stimulus response interaction, operationalized as the performance cost when either the stimulus repeats while the response changes, or the response repeats while the stimulus changes) for error rates were calculated from the participants means in each condition as follows: (StimulusChanged ResponseRepeated – StimulusRepeated ResponseRepeated) – (StimulusChanged ResponseChanged – StimulusRepeated ResponseChanged). Values are rounded to the nearest percentage.
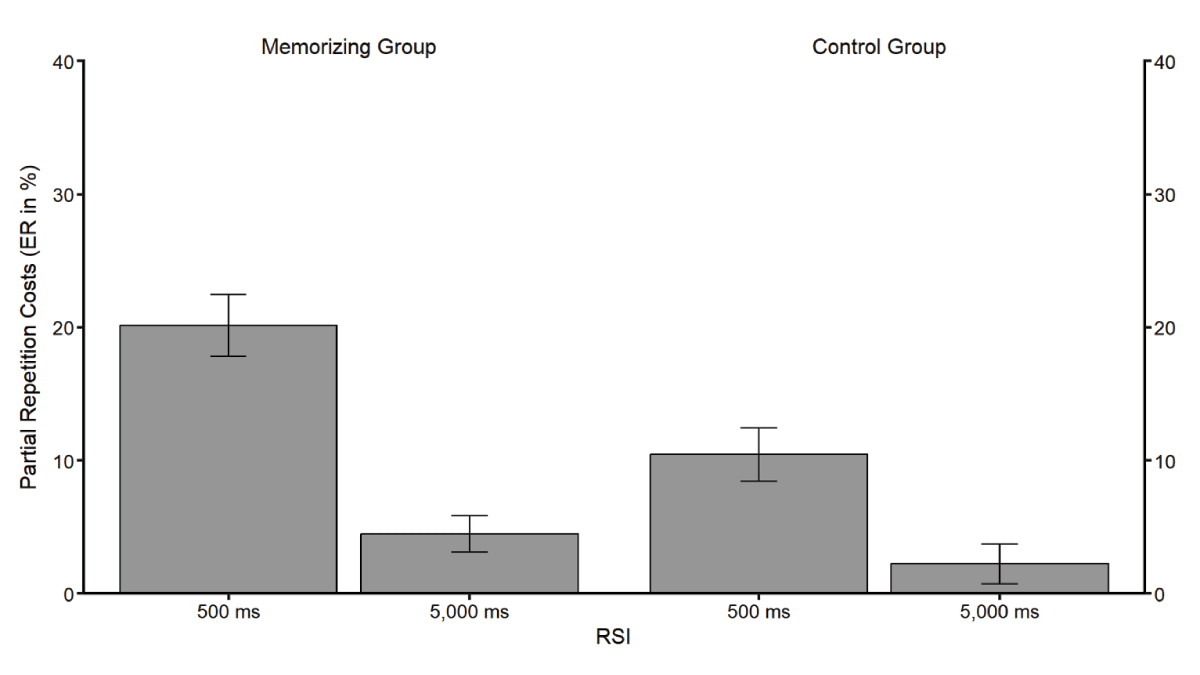
Figure 3
PRCs for error rates in percent as a function of Memorization and RSI.
Note. The terms “ER” and “RSI” refer to error rates and response-stimulus interval, respectively. Error bars represent the standard errors of the means.