
Table 1
Mean and standard deviation (SD) of frequency (Zipf scale), age of acquisition (AoA) ratings, and name agreement (H-index) for the words/pictures in each list.
| LIST | FREQUENCY MEAN | FREQUENCY SD | AOA MEAN | AOA SD | H-INDEX MEAN | H-INDEX SD |
|---|---|---|---|---|---|---|
| 1 | 4.17 | 0.48 | 5.39 | 1.43 | 0.13 | 0.15 |
| 2 | 4.28 | 0.64 | 5.48 | 1.69 | 0.13 | 0.17 |
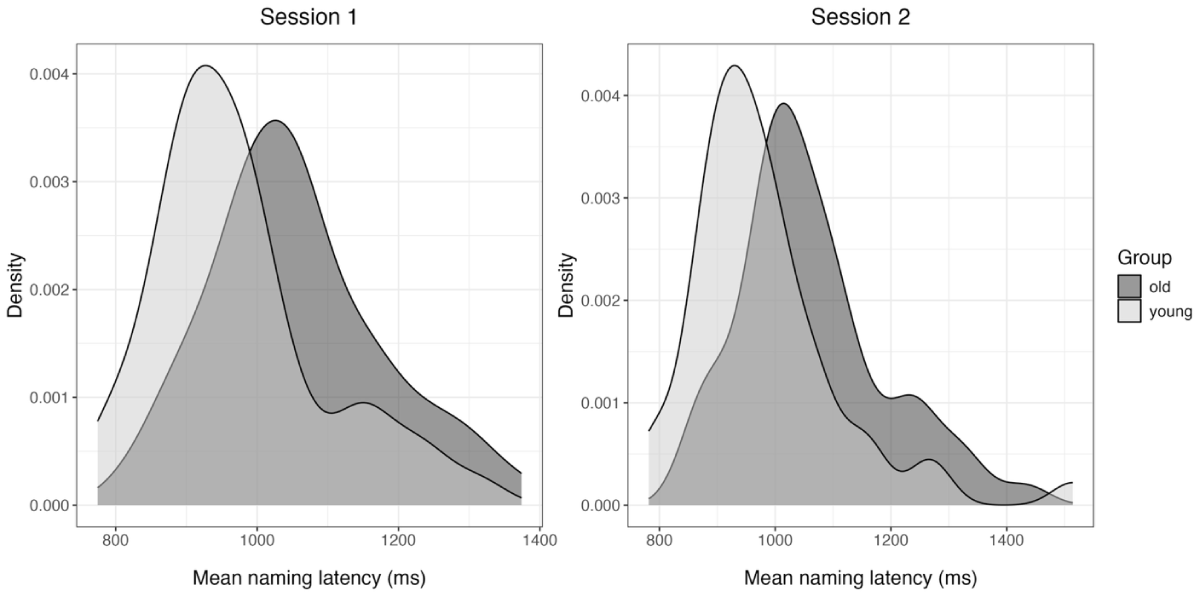
Figure 1
Densities of participants’ mean naming latencies by session and group.
Table 2
Output of the model testing the effect of age on naming latencies.
| SESSION | TERM | ESTIMATE | LOWER | UPPER |
|---|---|---|---|---|
| Session 1 | Intercept | 1018.08 | 991.80 | 1044.27 |
| Group | 82.83 | 35.43 | 131.58 | |
| Session 2 | Intercept | 1023.48 | 994.99 | 1052.17 |
| Group | 82.26 | 31.30 | 132.37 |
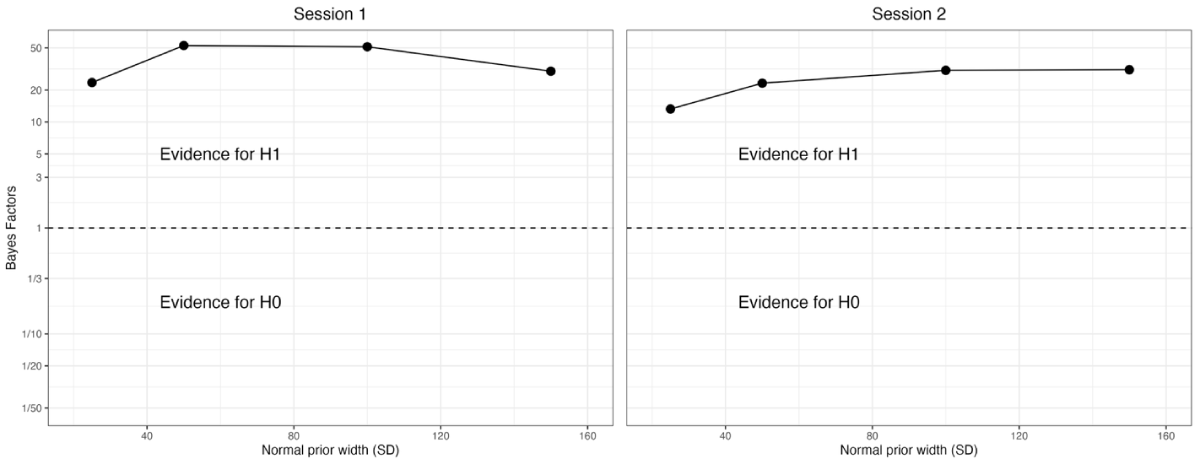
Figure 2
Sensitivity analysis of Bayes factors for age-related slowing in picture naming in the first (left) and second (right) test sessions.
Note. Data points in the upper half of the figure represent evidence for the hypothesis that older adults exhibit slower naming latencies than younger adults (H1), whereas data points in the lower half represent evidence for the hypothesis that there is no difference in naming latencies between young and older adults (H0).
Table 3
Between-participant variability (variance) for each group and session.
| SESSION | GROUP | BETWEEN-PARTICIPANT VARIANCE |
|---|---|---|
| Session 1 | Old Adults | 14800.27 |
| Young Adults | 14607.13 | |
| Session 2 | Old Adults | 15693.62 |
| Young Adults | 16852.63 |
Table 4
Between-item variability (variance) for each group and session.
| SESSION | GROUP | BETWEEN-ITEM VARIABILITY |
|---|---|---|
| Session 1 | Old Adults | 12243.91 |
| Young Adults | 8365.80 | |
| Session 2 | Old Adults | 12656.25 |
| Young Adults | 7229.48 |
Table 5
Output of the model testing the effect of age group on the residual standard deviation (i.e., sigma).
| SESSION | TERM | ESTIMATE | LOWER | UPPER |
|---|---|---|---|---|
| Session 1 | Sigma Intercept | 5.18 | 5.11 | 5.25 |
| Group | 0.01 | –0.11 | 0.13 | |
| Session 2 | Sigma Intercept | 5.19 | 5.12 | 5.25 |
| Group | 0.03 | –0.09 | 0.14 |
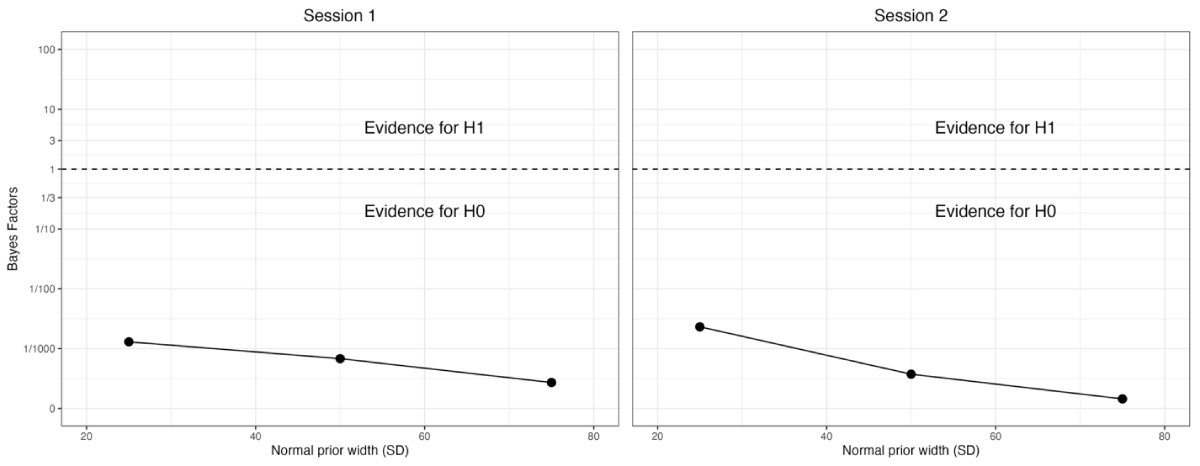
Figure 3
Sensitivity analysis of Bayes factors for the effect of age group on the residual standard deviation in the first (left) and second (right) testing sessions.
Note. Data points in the upper half of the figure represent evidence for the hypothesis that older adults exhibit greater within-participant variability across trials than young adults (H1), whereas data points in the lower half represent evidence for the hypothesis that there is no difference in within-participant variability across age groups (H0).
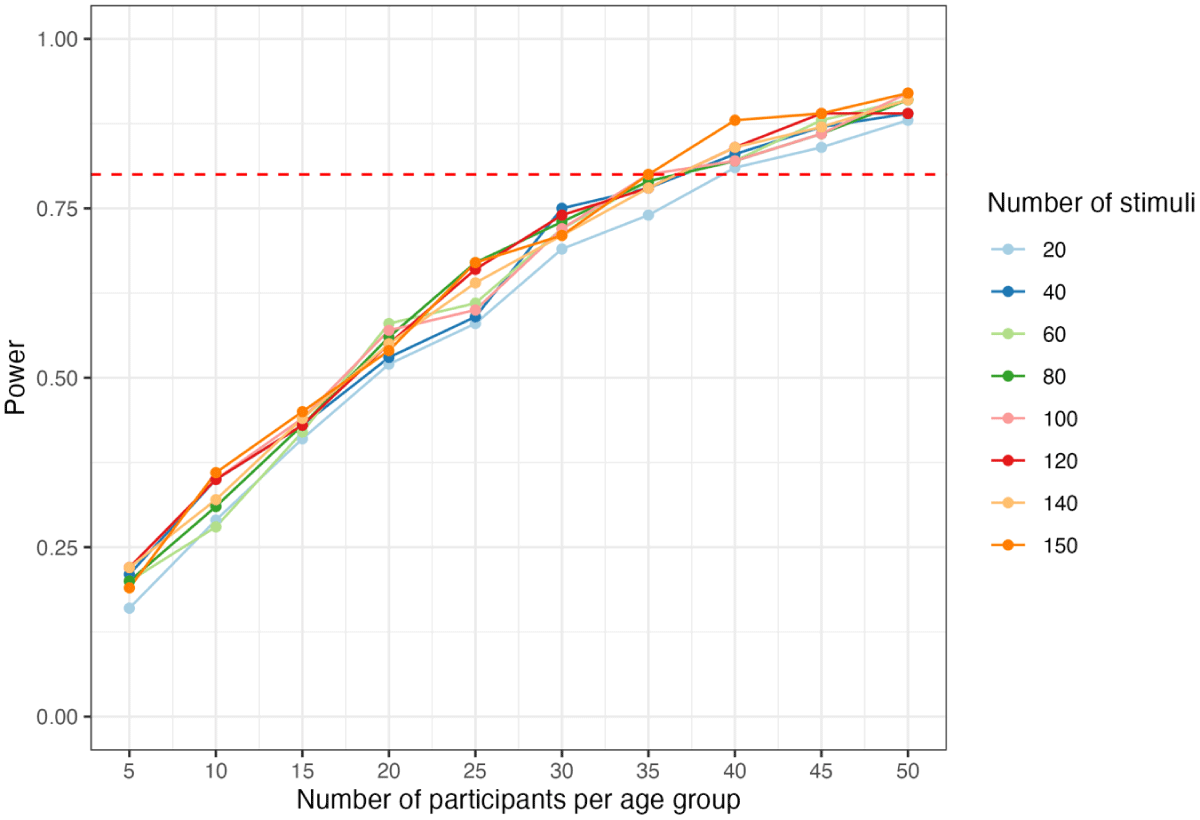
Figure 4
Statistical power to detect an effect of age on naming latencies as a function of the number of participants per age group and the number of items.
Note. We simulate power for 10 to 100 participants in increments of 10 and for 20 to 140 items in increments of 20, and 150 items. The red line indicates 80% power.