
Table 1
Sub-character units. In the literature the term radical is used flexibly to refer to various parts of a character: the indexing component, the residual component, a general stroke pattern, among others; we adopt the first definition. The term 部件 is translated as ‘Chinese character component’ in the GF 0014-2009 standard (National Language Commission, 2009). We instead use stroke pattern to differentiate it from the broader use of component elsewhere in the paper, and to emphasise its close link to strokes. Stroke patterns vary in stroke complexity, ranging from single-stroke components (e.g., 一 in character 丛) to compound components composed of multiple stroke patterns (e.g., 相 in character 想).
| TERM | DEFINITION |
|---|---|
| Radical 部首 bu4 shou3 | The indexing component used for dictionary look-up. |
| Residual component | The remaining part of a character after its radical is removed (Wang et al., 2025). |
| Stroke pattern 部件 bu4 jian4 | A stroke-based unit serving as a functional building block in character composition (National Language Commission, 2009). |
| Stroke 笔画 bi3 hua4 | The smallest writing unit in regular script (National Language Commission, 2009). |
| Semantic component 声旁 sheng1 pang2 | The component in a character that is indicative of its meaning. |
| Phonetic component 形旁 xing2 pang2 | The component in a character that is indicative of its pronunciation. |
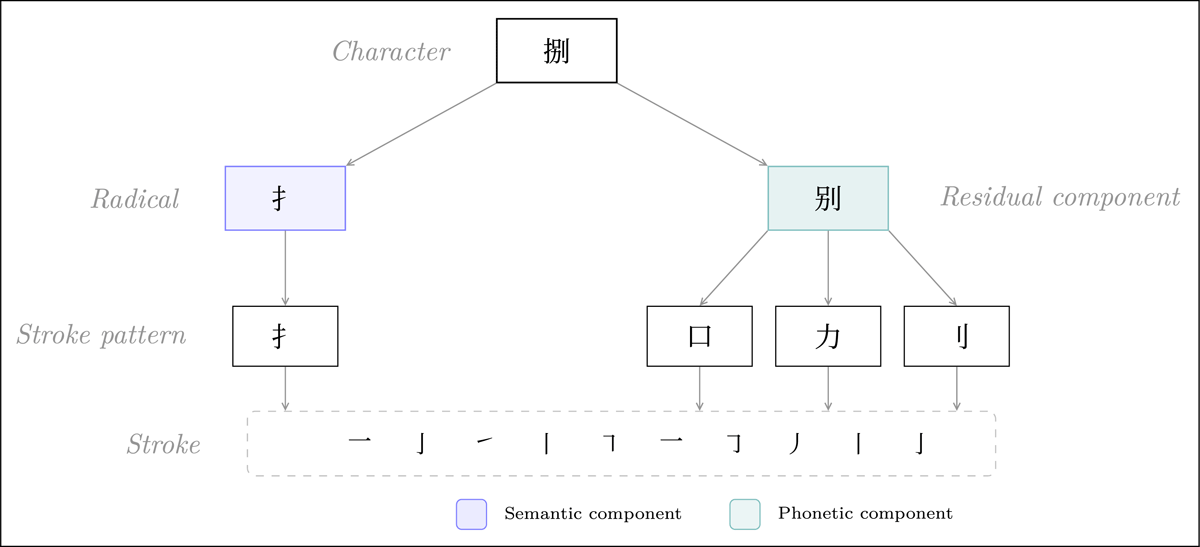
Figure 1
An example character 捌 ba1 ‘eight’ to illustrate the hierarchical structure of Chinese characters. It denotes the number ‘eight’ in a formal context or refers to a specific agricultural tool. The components of characters can be categorised at different levels. Strokes form stroke patterns, which assemble into a radical and a residual component (i.e., the non-radical part), and further form the whole structure. In addition, for many characters their components at the radical levels usually manifest linguistic features. The radical 扌 serves as a semantic component meaning ‘hand’, while the residual component 别 bie2 serves as a phonetic component, sharing its onset consonant /b/ with the character’s pronunciation ba1.
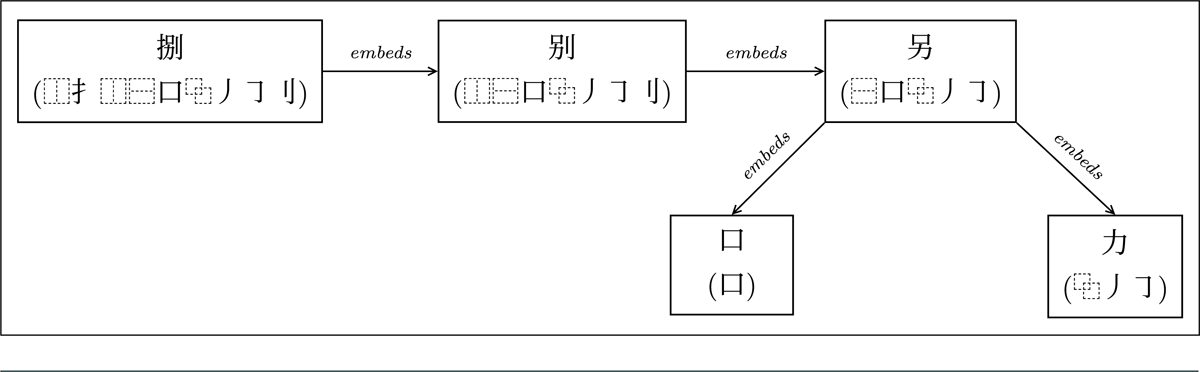
Figure 2
Illustration of nested character structures with their fully decomposed IDSs provided. We show five characters here, three of which embed individual characters. 捌 ba1 contains 别 bie2 ‘farewell’, which contains 另 ling4 ‘other’, which in turn embeds 口 kou3 ‘mouth’ and 力 li4 ‘power’.
Table 2
Definition of the independent variables used in Study 1. Consistency and regularity were included to control for potential phonological influence. Nstrokes and character frequency were included as they are strong predictors of word recognition performance.
| VARIABLE | DEFINITION |
|---|---|
| N-sc | number of phonograms sharing a semantic component with a target |
| N-pc | number of phonograms sharing a phonetic component with a target |
| consistency | number of characters sharing the same pronunciation (regardless of tones) divided by the total number of characters sharing the same phonetic components |
| regularity | a binary measure encoding whether the phonetic component’s pronunciation agrees with the pronunciation of the character (regardless of tones) |
| NStrokes | number of strokes retrieved from online Xinhua Dictionary5 |
| character frequency | character frequency calculated as Zipf value according to Van Heuven et al. (2014) |
Table 3
The criterion for removal at each step of data cleaning. Incorrect responses, IQR outliers, and RT outliers were removed at the trial level; Mean accuracy was assessed at the character level. The number of trials and characters removed is provided.
| DATA CLEANING STEPS | NUMBER OF TRIALS | NUMBER OF CHARACTERS | ||||
|---|---|---|---|---|---|---|
| BEFORE | REMAINING | REMOVED | BEFORE | REMAINING | REMOVED | |
| Raw data | 235,045 | 8,105 | ||||
| Incorrect responses | 235,045 | 144,079 | 90,966 | 8,105 | 7,745 | 360 |
| IQR outliers (±3 IQR) | 144,079 | 137,766 | 6,313 | 7,745 | 7,680 | 65 |
| RT outliers (< 200 ms or > 1,500 ms) | 137,766 | 134,204 | 3,562 | 7,680 | 7,650 | 30 |
| Low accuracy (<= 67%) | 134,204 | 115,518 | 18,686 | 7,650 | 4,528 | 3,122 |
| Clean character set | 115,518 | 4,528 | ||||
Table 4
Descriptive statistics of the continuous variables used in Study 1. For the variable regularity, there are 1,410 regular characters and 1,350 irregular characters.
| VARIABLE | FIVE-NUMBER SUMMARY | ||||
|---|---|---|---|---|---|
| MIN. | Q1 | MEDIAN | Q3 | MAX. | |
| RT | 341.010 | 583.355 | 657.088 | 771.030 | 1499.745 |
| N-sc | 1 | 25 | 63 | 140 | 224 |
| N-pc | 1 | 3 | 5 | 8 | 17 |
| consistency | .059 | .333 | .556 | 1.000 | 1.000 |
| NStrokes | 3 | 8 | 10 | 13 | 25 |
| character frequency | 1.614 | 3.374 | 4.111 | 4.783 | 7.559 |
Table 5
Spearman’s rank correlations between response times and independent variables for characters (N = 2767) used in the replication of neighbourhood size effects based on semantic components and phonetic components.
| RT | CHARACTER FREQUENCY | NSTROKES | N-SC | N-PC | REGULARITY | CONSISTENCY | |
|---|---|---|---|---|---|---|---|
| RT | 1.000 | –.289 | .164 | .012 | –.038 | .023 | .057 |
| character frequency | 1.000 | –.215 | –.038 | .044 | –.069 | –.107 | |
| NStrokes | 1.000 | –.129 | –.159 | .031 | .159 | ||
| N-sc | 1.000 | –.127 | .086 | .151 | |||
| N-pc | 1.000 | –.149 | –.579 | ||||
| regularity | 1.000 | .516 | |||||
| consistency | 1.000 |
Table 6
Fixed effects results from the LMM in Study 1 (fitted to 2,767 characters and 69,370 trials). The variance inflation factors, marginal R2, and 95% confidence intervals with lower and upper limits are provided.
| VARIABLE | ESTIMATE | STD. ERROR | DF | T | P | VIF | MARGINAL R2 |
|---|---|---|---|---|---|---|---|
| (Intercept) | –1.278 | 0.027 | 54.261 | –46.552 | <.001*** | — | — |
| character frequency | –0.087 | 0.002 | 2752.663 | –42.455 | <.001*** | 1.059 | .076 [.072, .078] |
| NStrokes | 0.012 | 0.001 | 2738.669 | 17.903 | <.001*** | 1.114 | .015 [.013, .016] |
| consistency | 0.011 | 0.009 | 2717.062 | 1.253 | .210 | 1.963 | .000 [.000, .000] |
| regularity | –0.002 | 0.005 | 2722.966 | –0.408 | .683 | 1.415 | .000 [.000, .000] |
| N-sc | 0.000 | 0.000 | 2715.690 | 1.642 | .101 | 1.050 | .000 [.000, .000] |
| N-pc | –0.000 | 0.001 | 2711.059 | –0.259 | .795 | 1.458 | .000 [.000, .000] |

Figure 3
Illustration of edit distance calculation under the weighted scheme. Both pairs (央 & 英 and英 & 苗) have a distance of 2.
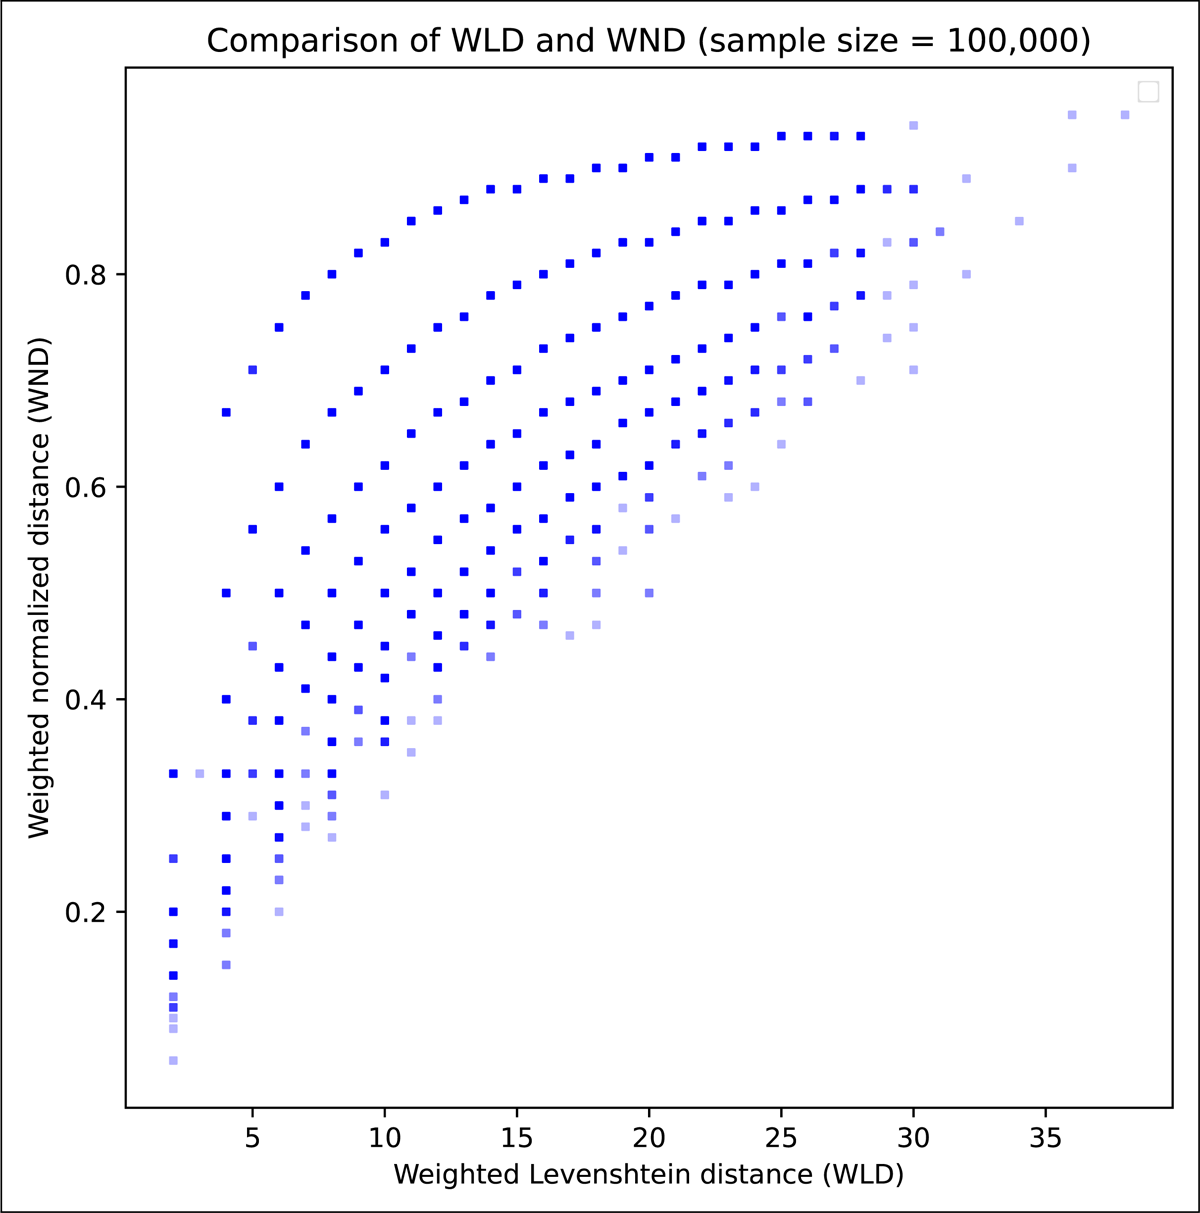
Figure 4
Comparison of weighted Levenshtein distance (WLD) and weighted normalised distance (WND). For each character, its distance from the full dataset (20,830 characters) was identified separately under each measure. A total of 100,000 characters were randomly sampled, with coordinates of each dot showing WLD and its corresponding WND.
Table 7
Comparison of absolute and normalised edit distance measures. The steps of WLD calculation for the English word examples are illustrated in Figure 5. Chinese characters: 鬰 yu4 ‘lush and growing abundantly’, 礬 fan2 ‘alum’, and 匕 bi3 ‘spoon’. The IDS of 鬰 is ⿳⿲木⿱㐅⿻丿乀 木冖⿰⿱⿶凵⿻ 㐅⿳丶⿰丶 丶丶⿺乚丿彡, of 礬 is ⿱⿱⿲ 木⿱㐅⿻丿乀木⿻一人⿸⿱一 丿口, and of 匕 is ⿺乚丿.
| WEIGHTED LEVENSHTEIN DISTANCE | WEIGHTED NORMALISED DISTANCE | |
|---|---|---|
| D(hair, pen) | 7 | 1.000 |
| D(hair,hailstone) | 7 | .540 |
| D(鬰, 匕) | 23 | .793 |
| D(鬰, 礬) | 24 | .545 |

Figure 5
WLD calculations for two English word pairs. Each has a distance of 7.
Table 8
Descriptive statistics for variables used in Study 2.
| VARIABLE | FIVE-NUMBER SUMMARY | ||||
|---|---|---|---|---|---|
| MIN. | Q1 | MEDIAN | Q3 | MAX. | |
| RT | 298.450 | 574.375 | 649.328 | 764.340 | 1499.745 |
| Character frequency | 1.313 | 3.243 | 4.141 | 4.898 | 7.559 |
| NStrokes | 2 | 8 | 10 | 12 | 25 |
| N-ch | 0 | 1 | 5 | 13 | 117 |
| WLD-10 | 1.800 | 2.000 | 2.000 | 3.200 | 11.300 |
| WND-10 | .060 | .151 | .200 | .265 | .619 |
Table 9
Correlations between variables used in Study 2 (Spearman’s r).
| RT | CHARACTER FREQUENCY | NSTROKES | N-ch | WLD-10 | WND-10 | |
|---|---|---|---|---|---|---|
| RT | 1.000 | –.351 | .236 | –.025 | .120 | –.029 |
| Character frequency | 1.000 | –.286 | .040 | –.149 | .055 | |
| NStrokes | 1.000 | –.253 | .363 | –.199 | ||
| N-ch | 1.000 | –.770 | .007 | |||
| WLD-10 | 1.000 | .236 | ||||
| WND-10 | 1.000 |
Table 10
Results for fixed effects factors across the LMMs in Study 2. For model architectures, the three models only differed in the neighbourhood measure used (initial N = 4,384 characters, 111,518 observations). After removing residual outliers, the number of characters remained unchanged for all models and the final observation counts were similar across models (2a: 109,632; 2b: 109,631; 2c: 109,630).
| ID | VARIABLE | ESTIMATE | STD. ERROR | DF | T | P | VIF | MARGINAL R2 |
|---|---|---|---|---|---|---|---|---|
| Study 2a | (Intercept) | –1.332 | 0.025 | 37.841 | –53.485 | <.001*** | / | / |
| Character frequency | –0.089 | 0.001 | 4402.104 | –60.589 | <.001*** | 1.083 | .104 [.100, .107] | |
| NStrokes | 0.017 | 0.001 | 4364.659 | 31.137 | <.001*** | 1.147 | .030 [.028, .032] | |
| N-ch | 0.001 | 0.000 | 4332.447 | 6.531 | <.001*** | 1.062 | .001 [.001, .002]) | |
| Study 2b | (Intercept) | –1.330 | 0.025 | 38.286 | –53.239 | <.001*** | / | / |
| Character frequency | –0.088 | 0.001 | 4401.886 | –60.350 | <.001*** | 1.085 | .103 [.100, .107] | |
| NStrokes | 0.015 | 0.001 | 4359.706 | 26.732 | <.001*** | 1.242 | .023 [.021, .024] | |
| WLD-10 | 0.008 | 0.002 | 4377.645 | 4.550 | <.001*** | 1.172 | .001 [.000, .001] | |
| Study 2c | (Intercept) | –1.338 | 0.025 | 41.372 | –52.557 | <.001*** | / | / |
| Character frequency | –0.089 | 0.001 | 4402.396 | –60.599 | <.001*** | 1.082 | .104 [.101, .108] | |
| NStrokes | 0.016 | 0.001 | 4373.708 | 30.538 | <.001*** | 1.123 | .029 [.027, .031] | |
| ND10 | 0.087 | 0.023 | 4329.019 | 3.811 | <.001*** | 1.041 | .000 [.000, .001] |
Table 11
Ten nearest characters for two example characters 憬 (left, lower WLD-10) and 器 (right, higher WLD-10). Both have an N-ch of 4, pointing to the first four characters listed in both columns that were formed by one substitution of one stroke pattern from each character. Character 憬 (NStrokes = 15, WND-10 = .103) occupies a denser orthographic neighbourhood beyond its N-ch neighbours, while character 器 (NStrokes = 16, WND-10 = .242) occupies a sparser neighbourhood. Our results show that characters like 憬 with denser neighbourhood are easier to recognise, after controlling for character frequency and number of strokes.
| 憬 (WLD-10 = 2.0) | 器 (WLD-10 = 3.3) | |||
|---|---|---|---|---|
| CHARACTER | DISTANCE | CHARACTER | DISTANCE | |
| 澋 | 2 | 噐 | 2 | |
| 幜 | 2 | 嚚 | 2 | |
| 暻 | 2 | 嚣 | 2 | |
| 撔 | 2 | 囂 | 2 | |
| 晾 | 2 | 噪 | 5 | |
| 惊 | 2 | 嘽 | 5 | |
| 景 | 2 | 吅 | 5 | |
| 颢 | 2 | 品 | 5 | |
| 影 | 2 | 嘔 | 5 | |
Table 12
Loadings from principal component analysis for predictors used in Study 1.
| VARIABLE | RC1 | RC2 | RC3 | RC4 | RC5 | RC6 |
|---|---|---|---|---|---|---|
| NStrokes | .07 | .99 | –.07 | .01 | –.11 | –.07 |
| character frequency | –.04 | –.11 | –.01 | –.03 | .99 | .02 |
| N-sc | .05 | –.07 | .99 | .03 | –.01 | –.06 |
| N-pc | –.24 | –.07 | –.06 | –.04 | .02 | .96 |
| regularity | .24 | .01 | .03 | .97 | –.03 | –.04 |
| consistency | .90 | .08 | .07 | .30 | –.05 | –.30 |
Table 13
Results of the fixed effects factors from the LMM with rotated components from PCA in Study 1 (N = 2,767). For each rotated component, the primary representative variable is shown. Variables with moderate contributions to the components are listed in descending order of absolute loading values with + showing positive loading and - negative loading.
| VARIABLE | PCA-BASED MODEL | ||||
|---|---|---|---|---|---|
| ESTIMATE | STD. ERROR | t | df | p | |
| Intercept | –1.497 | 0.023 | 28.320 | –64.170 | < .001*** |
| RC1 (N-pc - Con.) | –0.006 | 0.002 | 2711.766 | –2.874 | < .01** |
| RC2 (NStrokes) | 0.046 | 0.002 | 2740.083 | 23.479 | < .001*** |
| RC3 (N-sc) | 0.002 | 0.002 | 2715.640 | 1.080 | .279 |
| RC4 (regularity + Con.) | 0.003 | 0.002 | 2720.881 | 1.512 | .131 |
| RC5 (character frequency) | –0.090 | 0.002 | 2752.641 | –45.587 | < .001*** |
| RC6 (Con. - N-pc + regularity) | 0.009 | 0.002 | 2716.008 | 4.415 | < .001*** |
Table 14
Results for fixed effects factors across the LMMs combining variables from Study 1 and Study 2 (initial N = 2,767 characters, 70,534 trials). After identical outlier removal, final trial counts were 69,374 for the N-ch model, 69,370 for the WLD-10 model, and 69,372 for the WND-10 model. The unrounded estimate for N-ch is 0.0004 (SE = 0.0001).
| MODEL | VARIABLE | ESTIMATE | STD. ERROR | t | df | p |
|---|---|---|---|---|---|---|
| N-ch Model | (Intercept) | –1.288 | 0.027 | –48.308 | 48.200 | <.001*** |
| Character frequency | –0.087 | 0.002 | –42.533 | 2754.000 | <.001*** | |
| NStrokes | 0.012 | 0.001 | 18.221 | 2743.000 | <.001*** | |
| consistency | 0.015 | 0.007 | 2.066 | 2719.000 | .039* | |
| regularity | –0.002 | 0.005 | –0.513 | 2725.000 | .608 | |
| N-ch | 0.000 | 0.000 | 3.390 | 2727.000 | <.001*** | |
| WLD-10 Model | (Intercept) | –1.285 | 0.027 | –48.386 | 47.663 | <.001*** |
| Character frequency | –0.087 | 0.002 | –42.555 | 2753.924 | <.001*** | |
| NStrokes | 0.011 | 0.001 | 15.873 | 2739.439 | <.001*** | |
| consistency | 0.012 | 0.007 | 1.546 | 2719.351 | .122 | |
| regularity | –0.002 | 0.005 | –0.422 | 2725.011 | .673 | |
| WLD-10 | 0.007 | 0.002 | 3.377 | 2738.607 | <.001*** | |
| WND-10 Model | (Intercept) | –1.297 | 0.027 | –47.720 | 52.251 | <.001*** |
| Character frequency | –0.087 | 0.002 | –42.642 | 2754.705 | <.001*** | |
| NStrokes | 0.012 | 0.001 | 18.316 | 2746.701 | <.001*** | |
| consistency | 0.012 | 0.007 | 1.557 | 2721.490 | .120 | |
| regularity | –0.002 | 0.005 | –0.458 | 2725.904 | .647 | |
| WND-10 | 0.094 | 0.028 | 3.402 | 2724.459 | <.001*** |