
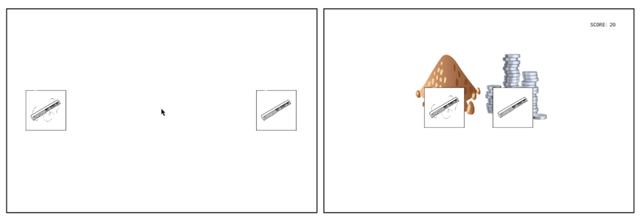
Figure 1
Example trial of the Guesser’s display (left) and Speaker’s display (right).
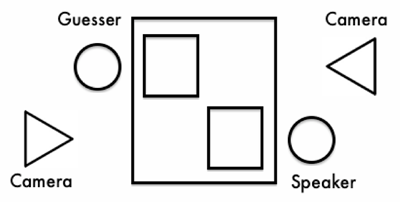
Figure 2
Diagrammatic setup of experiment.
| (1) | S: the treasure is not behind the flower that is not dying |
| G: as in it’s behind the dead flower | |
| S: it’s behind the alive flower |
Table 1
Descriptive statistics and Cohen’s Kappa (κ) between the two coders for the individual speech and gesture variables.
| raw count | mean (SD) | κ | |
|---|---|---|---|
| Speech variables (n = 1, 149) | |||
| Filled pauses | 288 | – | .95 |
| Silent pauses | 588 | – | .97 |
| Repetitions | 55 | – | .87 |
| Restarts | 109 | – | .95 |
| Substitutions | 36 | – | .95 |
| Additions | 12 | – | 1.0 |
| Prolongations | 334 | – | .82 |
| Utterance duration | – | 3008.92 (1329.35) | – |
| Silent pause duration | – | 651.65 (1080.5) | – |
| Speech syllable rate | – | 3.82 (1.42) | – |
| Gestures (n = 1, 101) | – | ||
| Head movements | 651 | – | .76 |
| Hand movements | 280 | – | .92 |
| Body movements | 377 | – | .87 |
| Shoulder movements | 26 | – | .85 |
| Lip/mouth movements | 85 | – | .50 |
| Eyebrow movements | 242 | – | .83 |
| Smiles/laughter | 156 | – | .81 |
| Gaze | 130 | – | .95 |
Table 2
Correlations between Speakers’ truths, Guessers’ perception of utterances as truths, and individual speech variables.
| 1 | 2 | 3 | 4 | 5 | 6 | 7 | 8 | 9 | 10 | 11 | 12 | |
|---|---|---|---|---|---|---|---|---|---|---|---|---|
| 1. Truths | 1.00 | |||||||||||
| 2. Perception of truths | 0.08 | 1.00 | ||||||||||
| 3. Filled pauses | 0.12 | –0.09 | 1.00 | |||||||||
| 4. Silent pauses | 0.11 | –0.17 | –0.33 | 1.00 | ||||||||
| 5. Repetitions | 0.01 | 0.01 | –0.25 | –0.42 | 1.00 | |||||||
| 6. Restarts | 0.19 | –0.06 | –0.30 | –0.42 | –0.20 | 1.00 | ||||||
| 7. Substitutions | –0.07 | –0.10 | –0.07 | –0.28 | –0.21 | 0.03 | 1.00 | |||||
| 8. Additions | –0.12 | 0.11 | –0.18 | –0.24 | 0.03 | –0.13 | –0.19 | 1.00 | ||||
| 9. Prolongations | –0.01 | –0.09 | –0.17 | –0.61 | –0.19 | 0.00 | 0.18 | –0.21 | 1.00 | |||
| 10. Utterance duration | –0.05 | 0.07 | 0.31 | 0.56 | 0.18 | 0.28 | 0.07 | 0.08 | 0.47 | 1.00 | ||
| 11. Silent pause duration | –0.03 | 0.09 | 0.17 | 0.59 | 0.23 | 0.17 | 0.05 | 0.07 | 0.35 | –0.55 | 1.00 | |
| 12. Speech syllable rate | 0.08 | –0.06 | –0.23 | –0.68 | –0.13 | –0.13 | –0.01 | –0.03 | –0.51 | 0.64 | 0.59 | 1.00 |
[i] Note. Correlations are tetrachoric for associations between binomial variables (1–9); Pearson’s for associations between continuous variables (10–12); and point-biserial for associations between binomial and continuous variables. All correlations are conducted at the observation level and do not take participant or item dependencies into account.
Table 3
Disfluency categories and examples from data.
| Disfluency category | Example |
|---|---|
| Pause | behind um the banana that’s not peeled |
| behind the camel with (0.32) two humps | |
| Repetition | behind the- the cut cake |
| Repair | the money is th- behind the one with the big tail fin |
| behind the necklace which has beads coming- falling off it | |
| behind the open- more open book | |
| Prolongation | behind thee leaf that looks like the ace on a pack of cards |
Table 4
Correlations between Speakers’ truths, Guessers’ perception of utterances as truths, and individual gestures.
| 1 | 2 | 3 | 4 | 5 | 6 | 7 | 8 | 9 | 10 | |
|---|---|---|---|---|---|---|---|---|---|---|
| 1. Truths | 1.00 | |||||||||
| 2. Perception of truths | 0.08 | 1.00 | ||||||||
| 3. Head movements | –0.07 | –0.01 | 1.00 | |||||||
| 4. Hand movements | –0.12 | 0.08 | –0.22 | 1.00 | ||||||
| 5. Body movements | –0.10 | –0.09 | –0.11 | –0.08 | 1.00 | |||||
| 6. Shoulder movements | 0.12 | 0.11 | –0.16 | –0.07 | 0.00 | 1.00 | ||||
| 7. Lip/mouth movements | 0.11 | –0.10 | –0.22 | 0.16 | –0.10 | –0.25 | 1.00 | |||
| 8. Eyebrow movements | 0.01 | 0.03 | –0.41 | 0.12 | –0.08 | –0.12 | –0.33 | 1.00 | ||
| 9. Smiles/laughter | 0.07 | 0.16 | –0.27 | –0.17 | –0.30 | –0.02 | –0.15 | –0.17 | 1.00 | |
| 10. Eye contact | –0.07 | 0.01 | –0.37 | –0.57 | –0.15 | 0.10 | 0.19 | –0.11 | –0.30 | 1.00 |
[i] Note. All correlations are tetrachoric. Correlations are conducted at the observation level and do not take participant or item dependencies into account.
Table 5
Gesture categories and examples from data.
| Gesture category | Example |
|---|---|
| Adaptor | Hand movements such as scratching one’s head, adjusting one’s clothing, clasping one’s hands etc. |
| Body movements such as rocking forwards, backwards or sideways Postural adjustments such as slumping or straightening one’s back | |
| Illustrator | Hand movements such as chopping motions to indicate a sliced carrot |
| Head movements such as a head shake to indicate a tree with no fruit on it | |
| Affect display | Eyebrow movements such as raised eyebrows to demonstrate surprise or furrowed brows to express concentration |
| Mouth movements such as pursed lips to indicate thought Smiling or laughing during the utterance | |
| Eye contact | Raising eyes from the screen to make eye contact with the Guesser |
| (2) | behind the comb with hairs in it |
| behind the hairy comb | |
| behind the comb without any hair | |
| behind the comb that has no hair |
| (3) | S: the treasure is behind the candle that isn’t f- very melted |
| G: isn’t very melted | |
| S: yeah the like fresh candle |
| (4) | S: it’s behind the- the key that has the bit on the end |
| G: as in the old-fashioned key | |
| S: they old-fashioned key, yeah |
Table 6
Cumulative AICc weights (0 ≤ Σwi ≤ 1) of speech model parameters for Speaker veracity and Guesser response.
| Model parameter | Σwi | |
|---|---|---|
| Speaker veracity | Guesser response | |
| pauses | 0.61 | 0.79 |
| repetitions | 0.27 | 0.33 |
| repairs | 0.56 | 0.64 |
| prolongations | 0.43 | 0.36 |
| speech rate | 0.43 | 0.33 |
Table 7
Cumulative AICc weights (0 ≤ Σwi ≤ 1) of gesture model parameters for Speaker veracity and Guesser response.
| Model parameter | Σwi | |
|---|---|---|
| Speaker veracity | Guesser response | |
| adaptors | 0.81 | 0.27 |
| affect displays | 0.28 | 0.76 |
| illustrators | 0.36 | 0.30 |
| gaze behaviour | 0.32 | 0.27 |
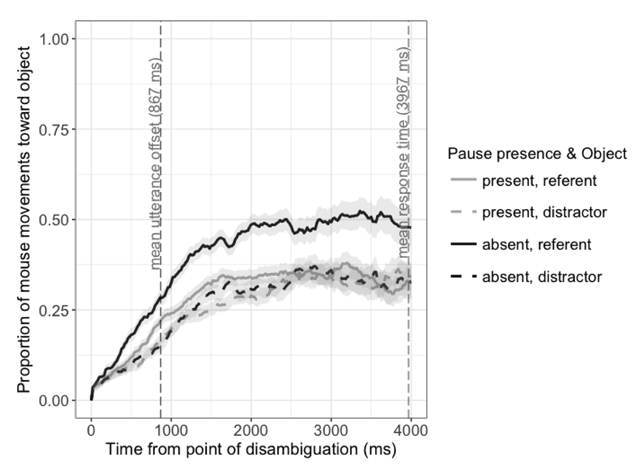
Figure 3
Proportion of cumulative distance travelled towards each object in response to utterances including a pause, compared to other utterances, from 0 to 4000 ms after the disambiguation point. Proportions are based on the total cumulative distance covered by the mouse pointer over time. Shaded areas represent ±1 standard error of the mean.
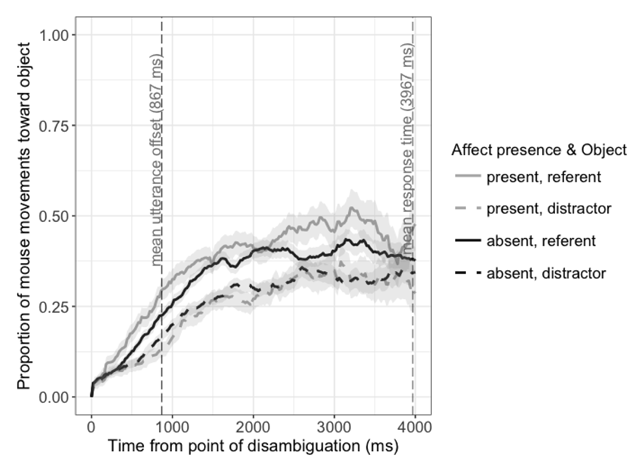
Figure 4
Proportion of cumulative distance travelled towards each object in response to utterances accompanied by affect gestures, compared to other utterances, from 0 to 4000 ms after the disambiguation point. Proportions are based on the total cumulative distance covered by the mouse pointer over time. Shaded areas represent ±1 standard error of the mean.