
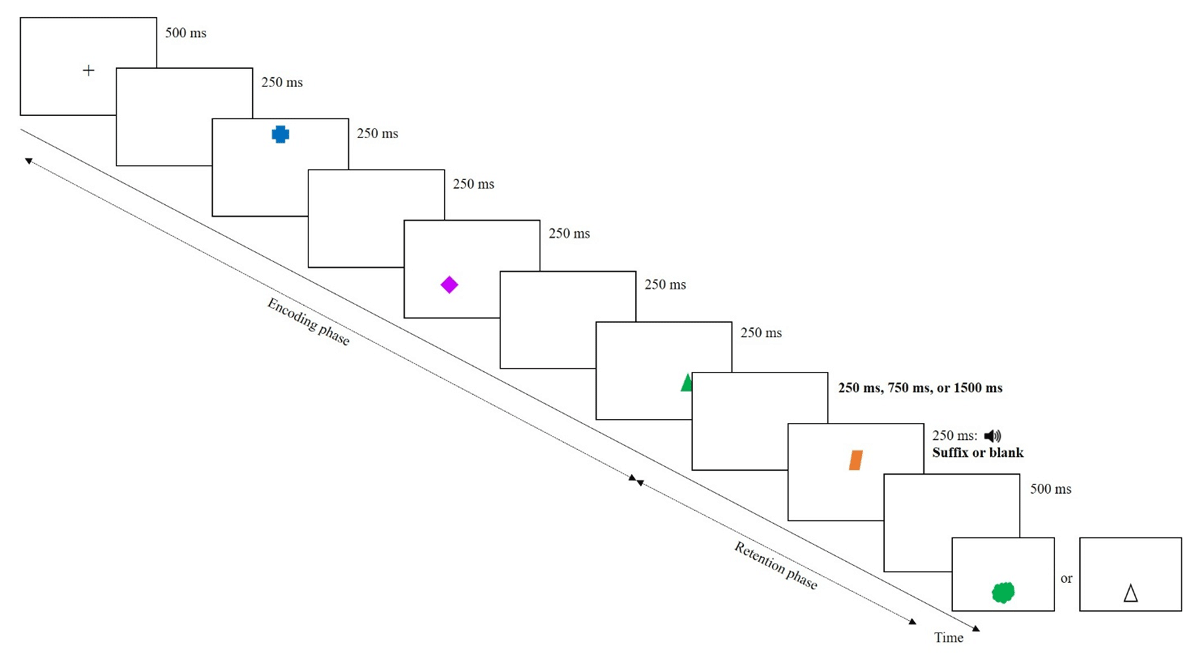
Figure 1
Schematic illustration of a trial in Experiment 1.
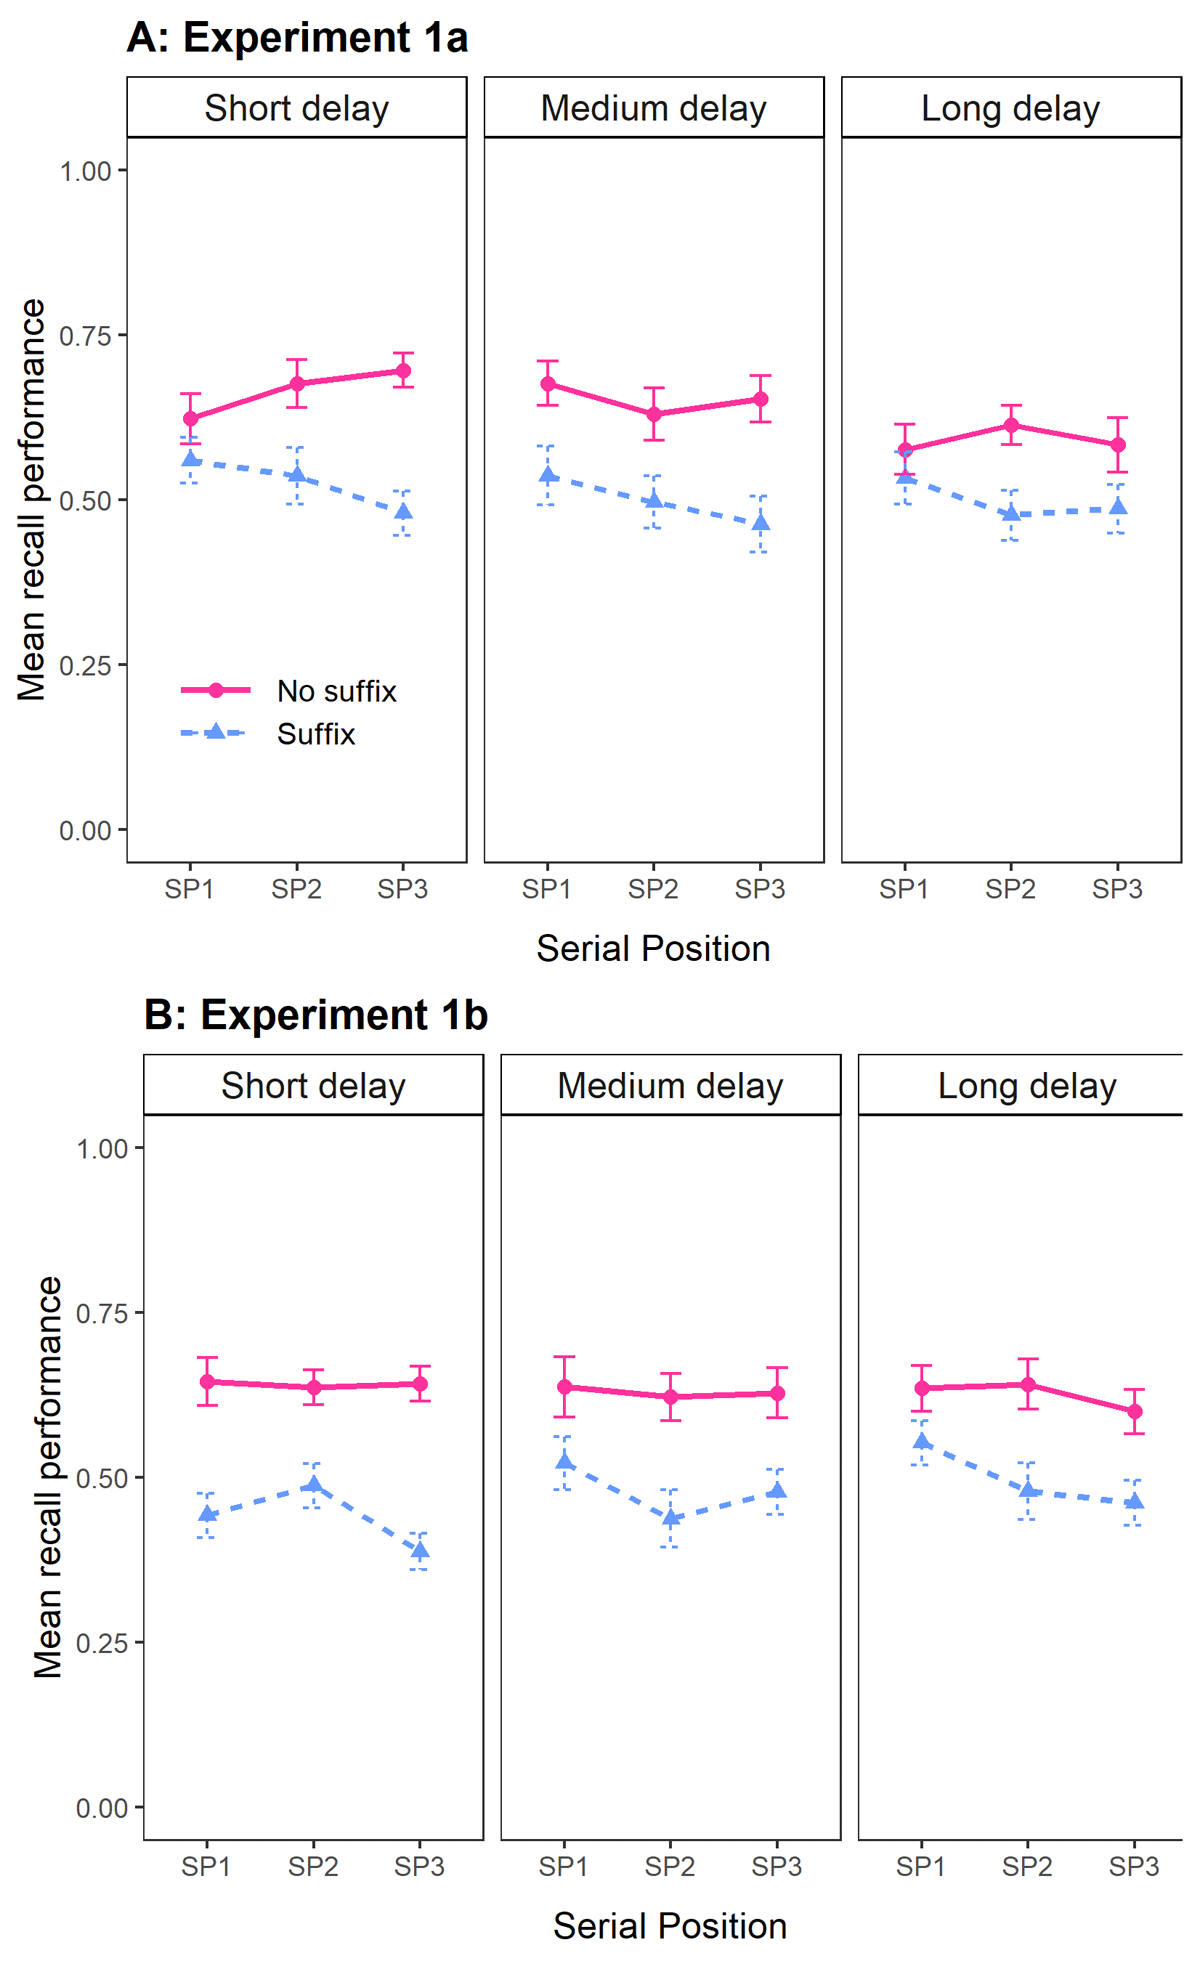
Figure 2
Mean recall performance in Experiments 1a (Panel A) and 1b (Panel B), as a function of Distraction (No suffix vs. Suffix), Delay (short, medium, or long), and Serial Position (SP; memory item 1, 2, or 3). Error bars represent standard error of the mean.
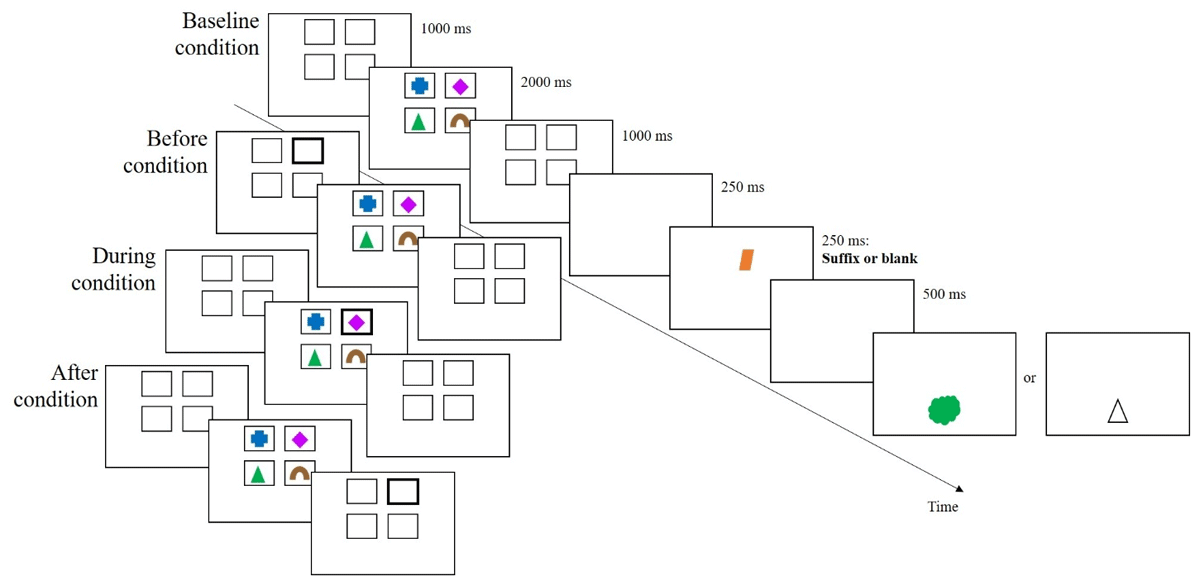
Figure 3
Schematic illustration of a trial in the different conditions of Experiment 2.
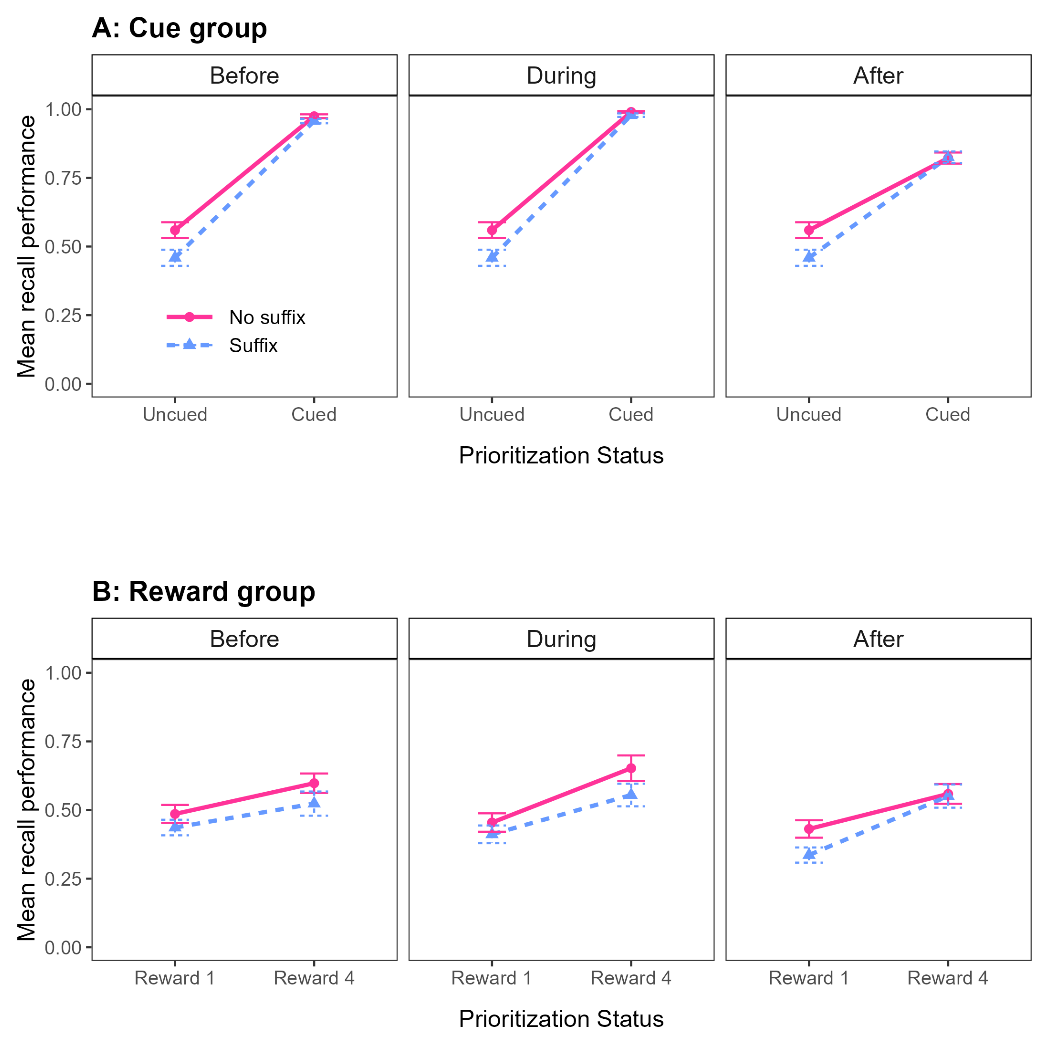
Figure 4
Mean recall performance in Experiment 2, as a function of Prioritization Type (Cue group in panel A, Reward group in panel B), Distraction (No suffix vs. Suffix), and Prioritization Status (Uncued vs. Cued in the Cue group, panel A; Low-reward 1 vs. Reward 4 for the conventional comparison in the Reward group, panel B). Error bars represent standard error of the mean. Note that in Panel A, unprioritized items are taken from baseline trials and thus the same values are shown in the three panels for uncued items. This allows for a direct comparison of the pattern across panels.