
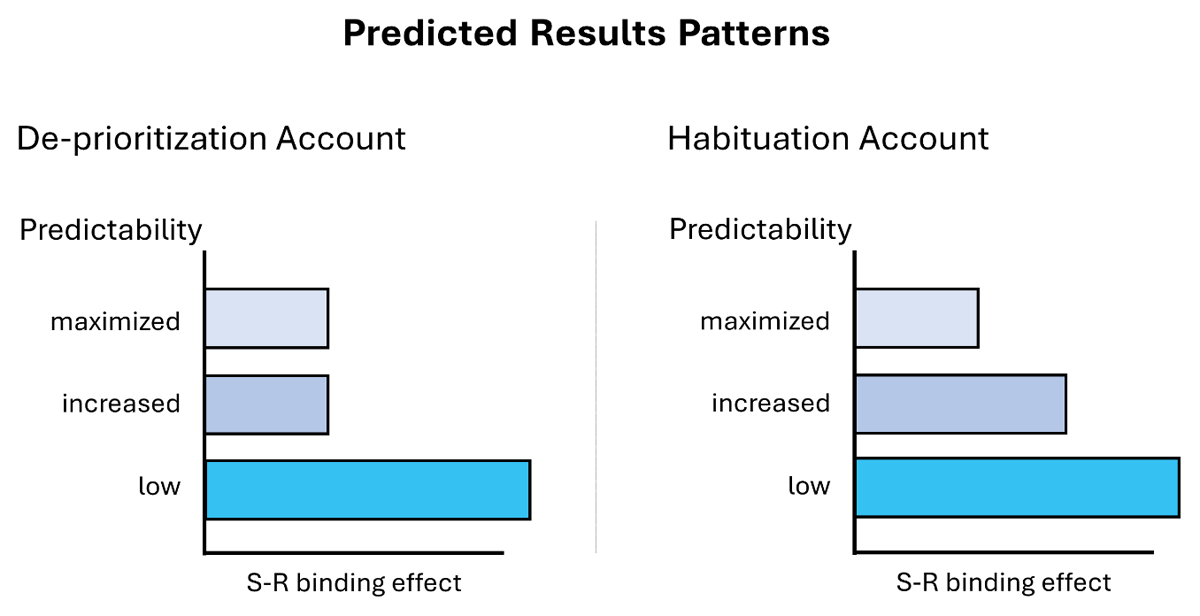
Figure 1
Expected Result Patterns for the De-prioritization Account and the Habituation Account.
Note. The De-Prioritization Account suggests no difference between maximized and increased predictability groups. The Habituation Account suggests weaker S-R binding effects in the maximized compared to the increased predictability groups.
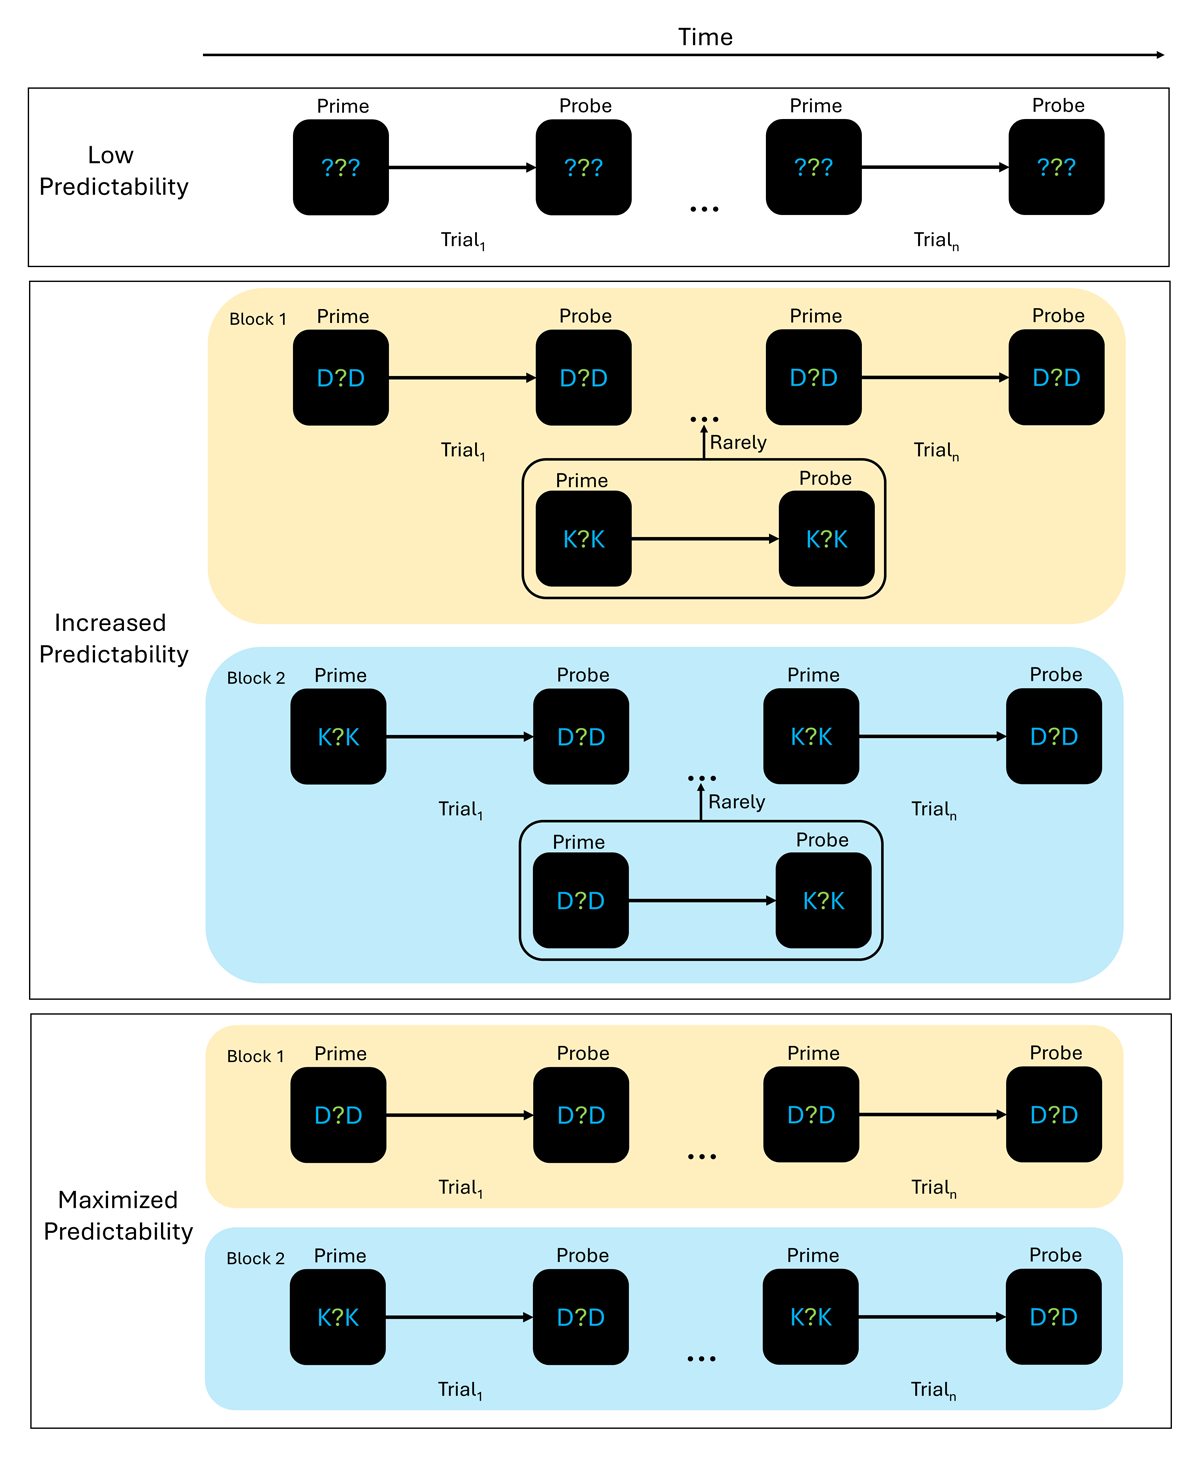
Figure 2
Experimental logic with three different experimental groups.
Note. Experimental setup. Participants identified the centrally presented, green letter. To them, it was always unpredictable which response they would have to give. Presentation of the different experimental trial types was trial-wise in the low predictability group and blocked in both the increased and maximized groups. Within these blocks, the presentation of the two blue distractors followed a strict rule. Prime and probe distractors never changed within a block in the maximized group. In the increased group, prime and probe distractors were mostly not changed but rarely other distractors were shown.
The four different configurations for prime and probe distractors were: Prime D, Probe D; Prime K, Probe K; Prime K, Probe D; Prime D, Probe K.
For readability purposes, only two exemplary blocks are presented here. In total, there were four blocks in the increased and maximized predictability group.
Table 1
Overview Trial combinations.
| PREDICTABILITY | GROUP | BLOCK 1 | BLOCK 2 | BLOCK 3 | BLOCK 4 |
|---|---|---|---|---|---|
| LOW | NO GROUPS | NO BLOCKS | |||
| Increased | A | D (Prime), D (Probe) | K, K | D, K | K, D |
| B | D, D | K, D | D, K | K, K | |
| C | D, K | K, D | D, D | K, K | |
| D | D, K | K, K | D, D | K, D | |
| Maximized | A | D, D | K, K | D, K | K, D |
| B | D, D | K, D | D, K | K, K | |
| C | D, K | K, D | D, D | K, K | |
| D | D, K | K, K | D, D | K, D | |
[i] Note. In the low predictability group, no blocks but a single stream of trials was presented. Hence neither different groups nor blocks existed.
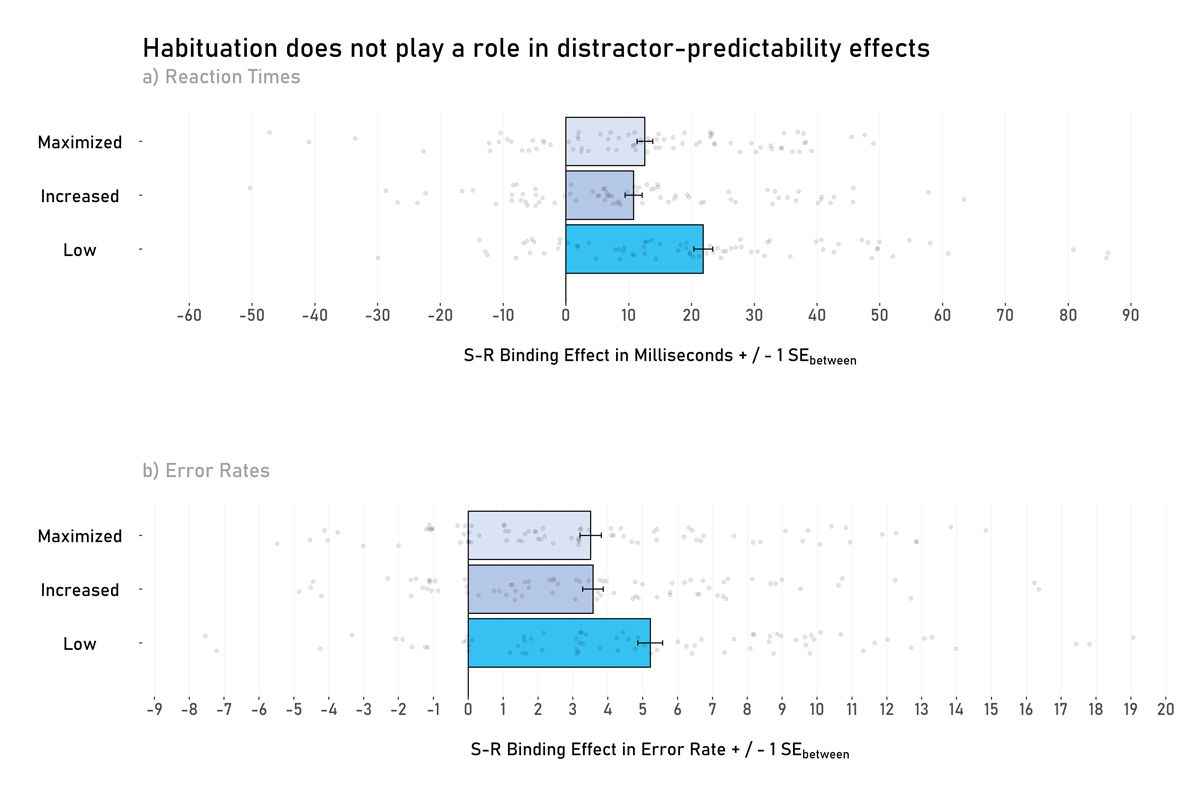
Figure 3
Stimulus-Response binding effects as a function of predictability (Low vs. Increased vs. Maximized). Panel a) shows S-R binding effects in reaction times and panel b) shows S-R binding effects in error rates.
Note. There is no difference in S-R binding effects between the maximized and increased predictability groups in reaction times (Panel a) or error rates (Panel B). However, there is a difference between maximized/increased groups and the low predictability group (at least statistically in the reaction times and descriptively in both reaction times and error rates). Transparent dots represent the individual S-R binding effect of each participant. Error bars show between-participants standard errors.
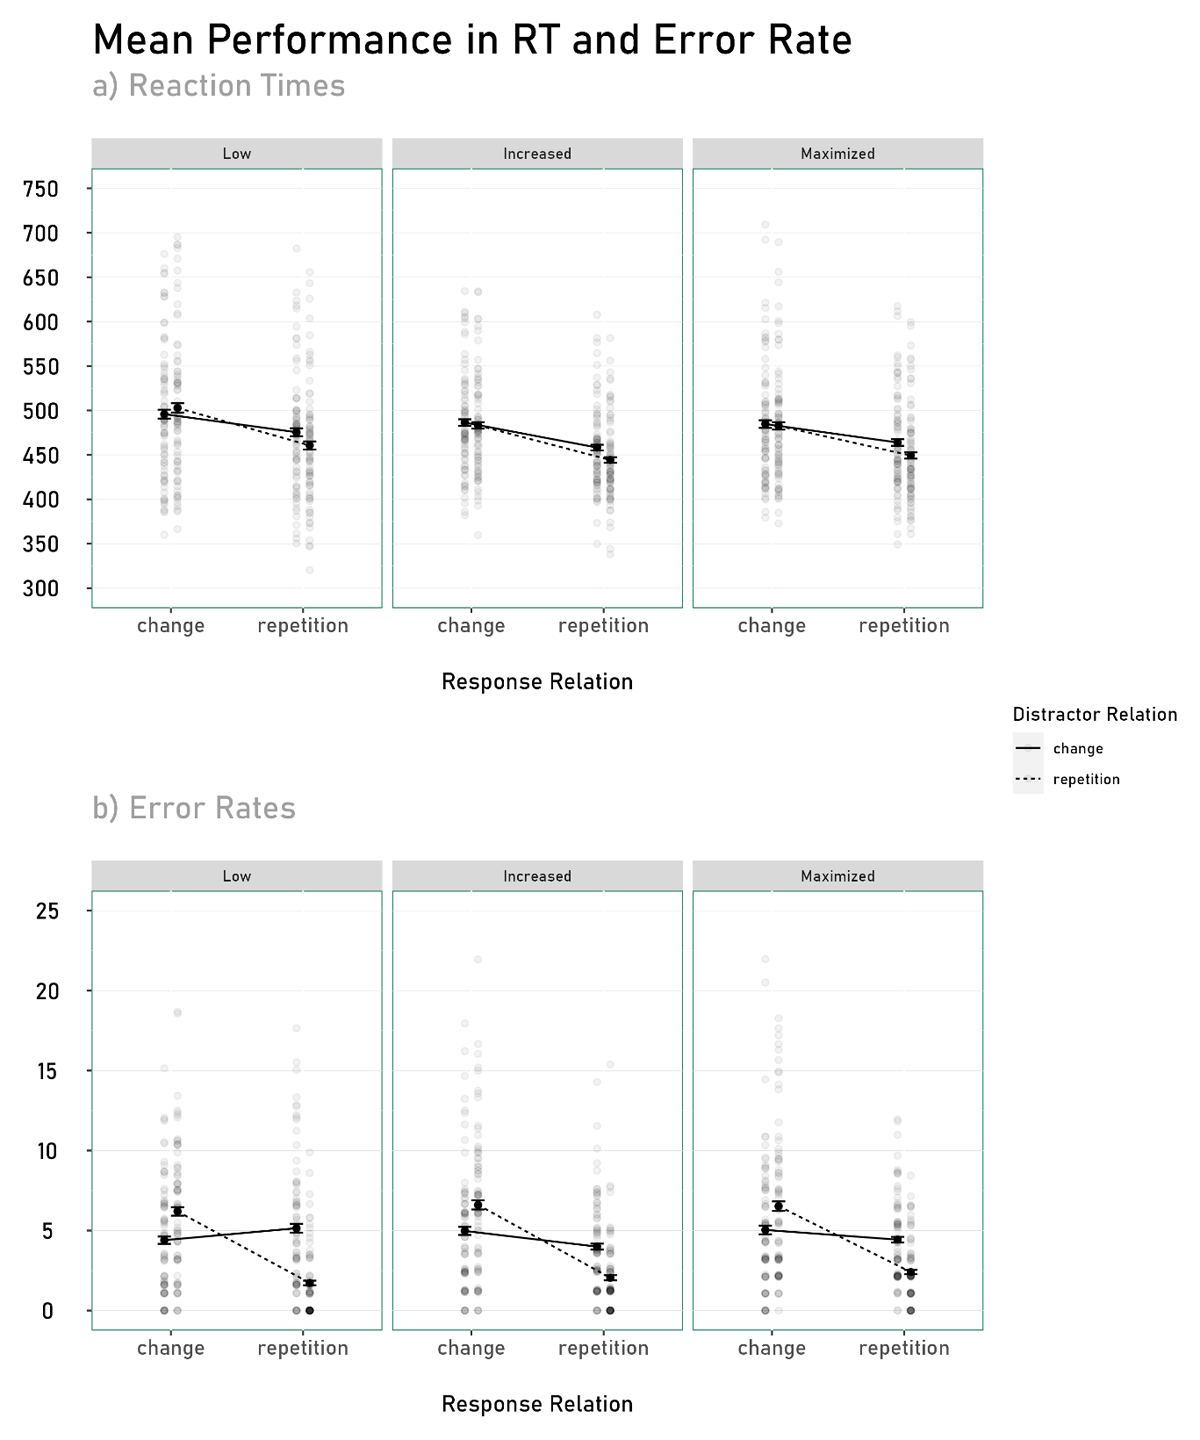
Figure 4
Mean Reaction Times and Error Rate as a function of Response Relation, Distractor Relation, and Predictability.
Note. Transparent dots represent the individual performance of each participant. Error bars show between-participants standard errors.