
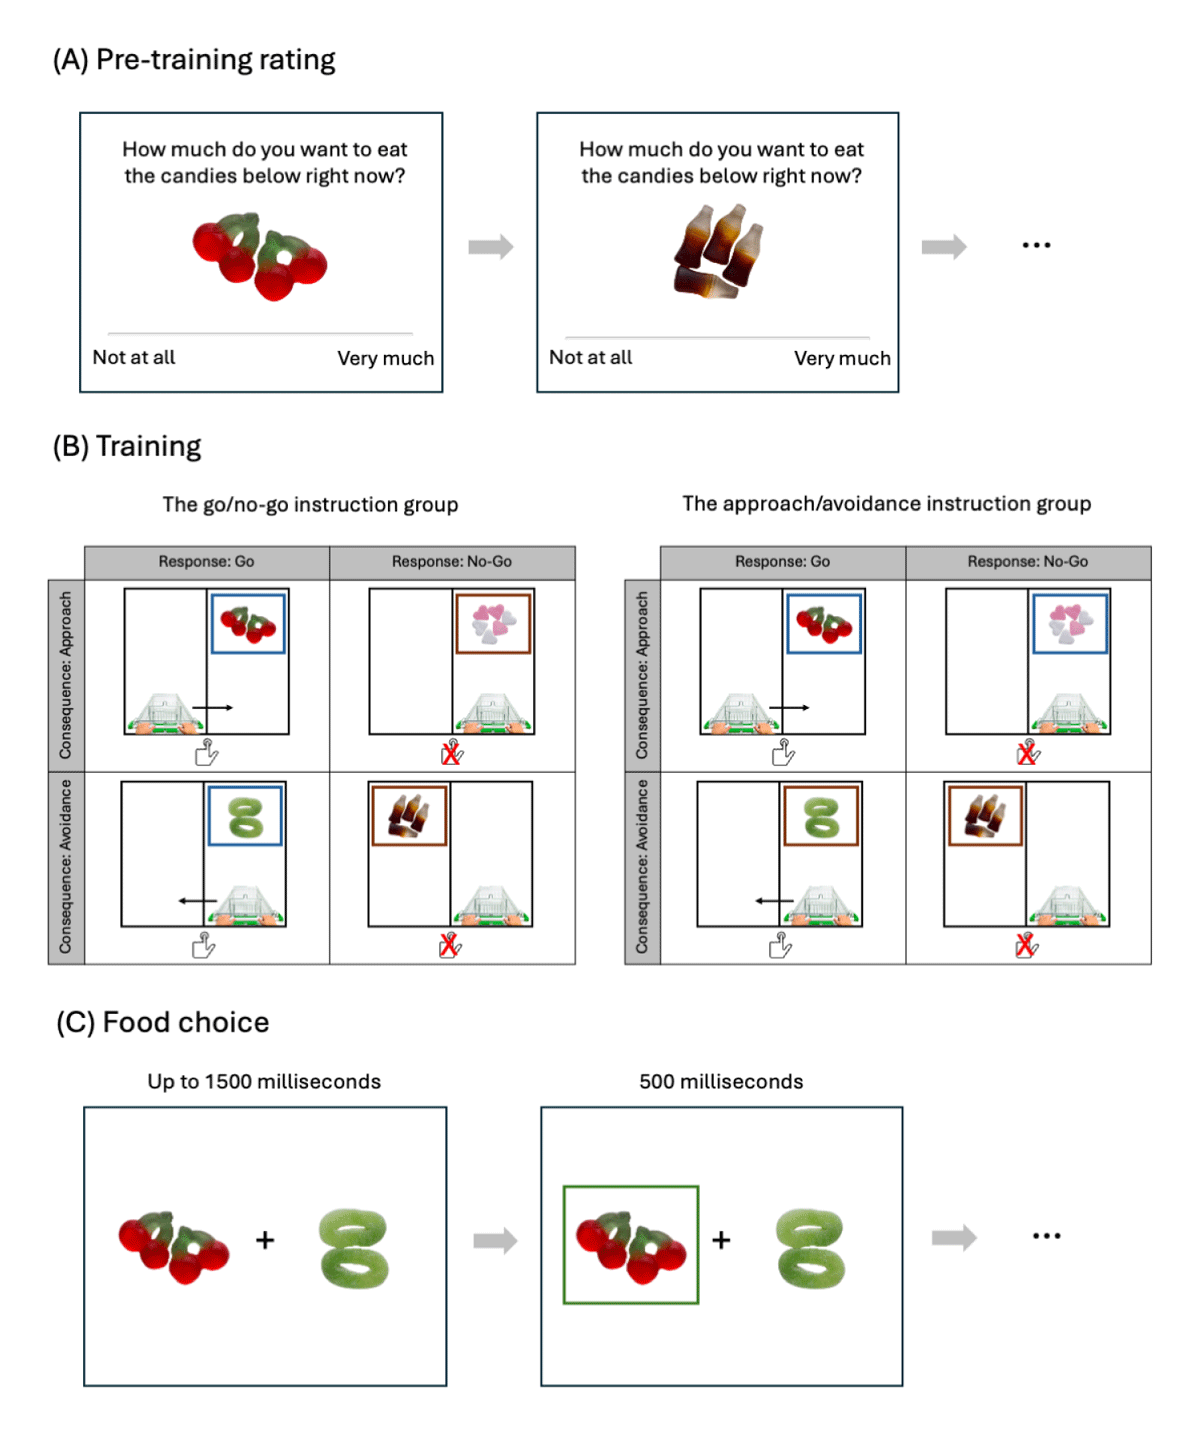
Figure 1
Schematics of the main tasks. (A) Pre-training rating. (B) Training. Note that the colored frames (blue and brown) indicate go/no-go conditions in the go/no-go instruction group, and indicate approach/avoidance conditions in the approach/avoidance instruction group. The solid arrows in the Go-Approach and Go-Avoidance conditions indicate how the cart moves after participants respond, and are not shown in the task. (C) Food choice. The candy images are from Chen et al. (2019). The shopping cart image is from pngwing.com, and the hand pushing button image is from stockio.com.
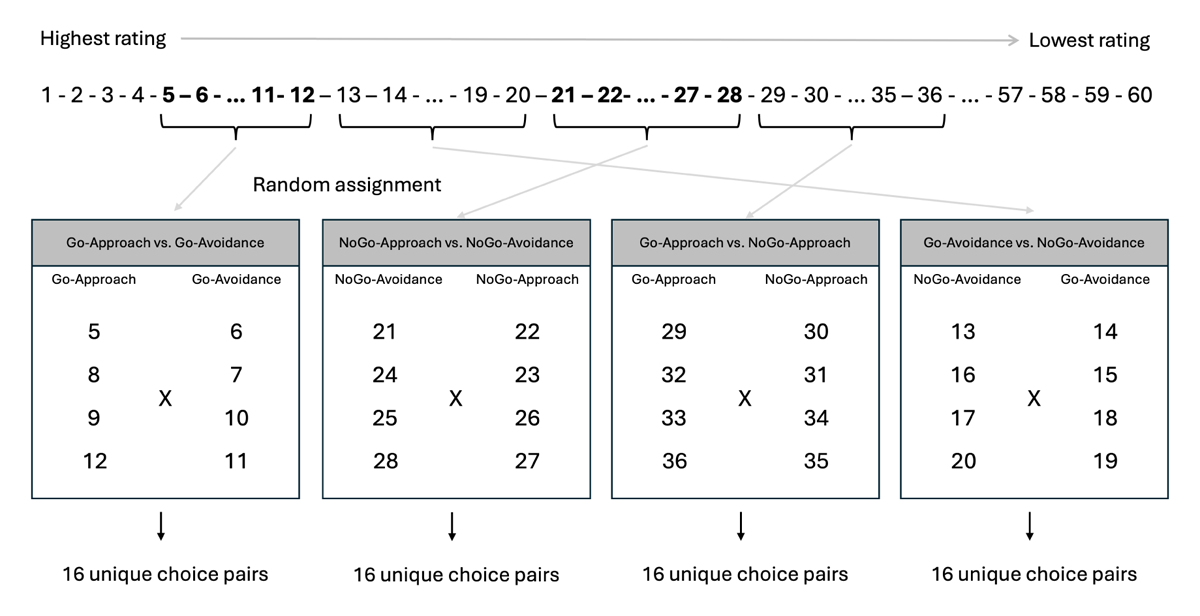
Figure 2
An illustration of the item selection procedure.
Table 1
Ratings before the training for items used in the Go-Approach vs. Go-Avoidance and the NoGo-Approach vs. NoGo-Avoidance choice trials.
| INSTRUCTION GROUP | RESPONSE | CONSEQUENCE | MEAN | SD |
|---|---|---|---|---|
| Approach/Avoidance | Go | Approach | 18.82 | 48.27 |
| Avoidance | 18.88 | 48.17 | ||
| NoGo | Approach | 21.20 | 47.20 | |
| Avoidance | 20.82 | 47.13 | ||
| Go/No-Go | Go | Approach | 13.58 | 50.94 |
| Avoidance | 13.82 | 51.04 | ||
| NoGo | Approach | 19.12 | 50.45 | |
| Avoidance | 19.34 | 50.70 |
Table 2
Ratings before the training for items used in the Go-Approach vs. NoGo-Approach and the Go-Avoidance vs. NoGo-Avoidance choice trials.
| INSTRUCTION GROUP | CONSEQUENCE | RESPONSE | MEAN | SD |
|---|---|---|---|---|
| Approach/Avoidance | Approach | Go | 15.08 | 52.23 |
| NoGo | 14.86 | 52.64 | ||
| Avoidance | Go | 27.41 | 44.97 | |
| NoGo | 27.49 | 45.14 | ||
| Go/No-Go | Approach | Go | 24.42 | 50.04 |
| NoGo | 24.82 | 49.56 | ||
| Avoidance | Go | 18.23 | 49.64 | |
| NoGo | 18.23 | 49.59 |
Table 3
Bayesian repeated-measures ANOVAs on ratings before the training and accuracies in the training.
| EFFECTS | BF01 – AAT | BF01 – GNG | BF10 – ACCURACY |
|---|---|---|---|
| Response | 4.84 | 12.23 | 7.19 × 1029 |
| Consequence | 12.72 | 6.58 | 7.45 × 10¹⁵ |
| Instruction group | 5.57 | 6.33 | 4637.7 |
| Response * Consequence | 9.25 | 9.68 | 1.47 × 1032 |
| Response * Instruction group | 7.71 | 9.66 | 5117.4 |
| Consequence * Instruction group | 9.24 | 0.016 | 495.1 |
| Response * Consequence * Instruction group | 6.67 | 6.66 | 1912.1 |
[i] Note: BF01 – AAT shows the results from the Bayesian ANOVA on ratings before the training for items used in the Go-Approach vs. Go-Avoidance and the NoGo-Approach vs. NoGo-Avoidance choice trials. BF01 – GNG shows the results from the Bayesian ANOVA on ratings before the training for items used the Go-Approach vs. NoGo-Approach and the Go-Avoidance vs. NoGo-Avoidance choice trials. BF10 – Accuracy shows the results from the Bayesian ANOVA on accuracies in the training. Note that BF01 – AAT and BF01 – GNG quantify the support for the null hypothesis over the alternative hypothesis, while BF10 – Accuracy quantifies the support for the alternative hypothesis over the null hypothesis.
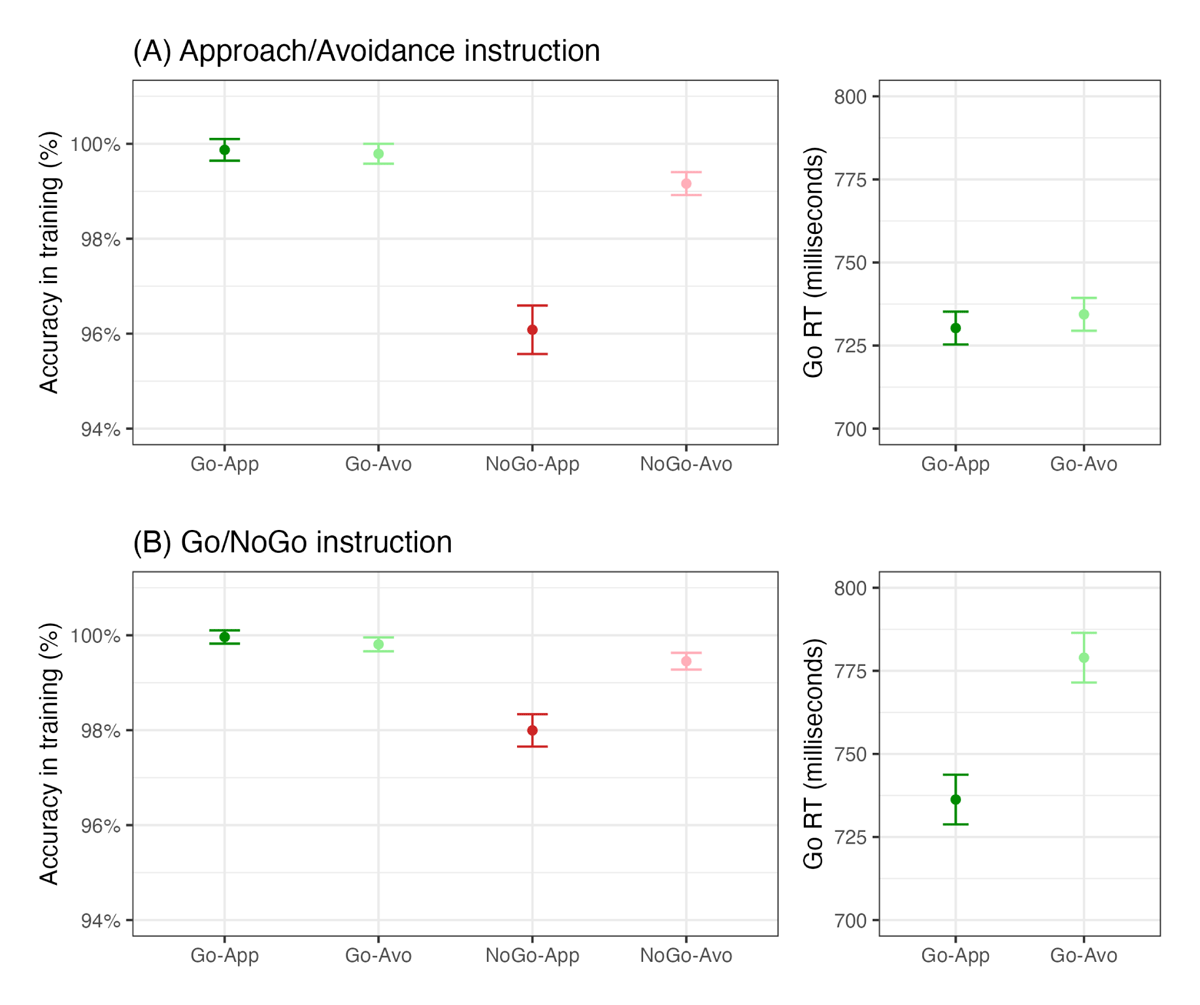
Figure 3
Performance in the training task in the (A) approach/avoidance and (B) go/no-go instruction group. The error bars stand for within-subject 95% confidence intervals.
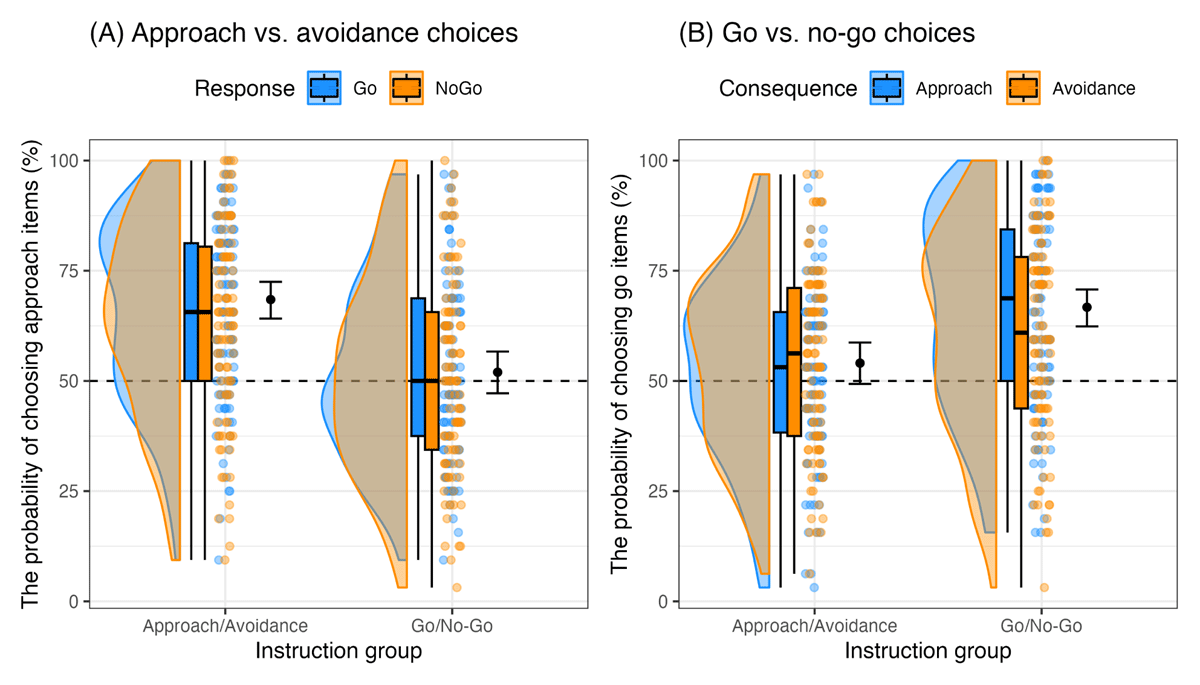
Figure 4
Choices between (A) approach and avoidance items and (B) go and no-go items. The blue and orange dots show for each participant, the probabilities of choosing approach items in (A), and the probabilities of choosing go items in (B). The black dots show for each group, the estimated probability of choosing approach items in (A), and the estimated probability of choosing go items in (B). The error bars stand for 95% credible intervals.
Table A1
Study design table.
| QUESTION | HYPOTHESIS | SAMPLING PLAN | ANALYSIS PLAN | RATIONALE FOR DECIDING THE SENSITIVITY OF THE TEST FOR CONFIRMING OR DISCONFIRMING THE HYPOTHESIS | INTERPRETATION GIVEN DIFFERENT OUTCOMES | THEORY THAT COULD BE SHOWN WRONG BY THE OUTCOMES |
|---|---|---|---|---|---|---|
| Does the effect of approach/avoidance actions on choice depend on action interpretation? | Approach/avoidance actions will more strongly influence choice when task instructions indicate approach/avoidance actions than when they indicate go/no-go actions. Furthermore, the approach/avoidance instruction group overall will choose approach items more frequently than avoidance items. | We will recruit 100 participants who are at least 18 years old in each group, resulting in 200 participants in total before any data exclusion. In case the sample size in an instruction group is below 90 after exclusions, we will continue recruiting participants for that specific instruction group, until the final sample size is 90. | Hierarchical logistic regression on choices on the Go-Approach vs.Go-Avoidance and NoGo-Approach vs. NoGo-Avoidance trials. Whether participants choose the Approach or Avoidance item is the dependent variable (Approach = 1, Avoidance = 0). Whether both items are Go or NoGo is used as a within-subjects predictor, and the instruction group is used as a between-subjects predictor. Random intercept and random slope per participant, left candy and right candy are included. | Previous work found an effect size of Cohen’s d of 0.533 for GNG on food choices. We expect the effect of AAT on food choices to be at least as big as that of GNG. To be conservative, we use 80% of the expected effect size, which is 0.426. 60 participants are needed (with a two-sided one sample t test) for 90% power with an alpha level of .05. Furthermore, instruction increased the effect of actions on stimulus evaluation in previous work, with Hedge’s g = 0.611 and 0.923 for GNG and AAT, respectively. Again, using 80% of 0.611 (0.488), 90 participants per condition (180 in total) are needed (with a two-sided independent samples t test) for 90% power with an alpha level of .05. To leave room for potential exclusions, we will initially recruit 100 participants per group (200 in total). | If task cues influence the effect of AAT on choice, this would indicate that the effect of approach/avoidance actions on choice depends on action interpretation. If not, this would indicate that different from stimulus evaluation, choice change by AAT is not dependent on action interpretation. | The results will help us arbitrate between theoretical accounts that emphasize action execution in the effects by go/no-go and approach/avoi dance actions on choice, and those that emphasize action interpretation in the effects by go/no-go and approach/avoi dance actions. |
| Does the effect of go/no-go actions on choice depend on action interpretation? | Go/no-go actions will more strongly influence choice when task instructions indicate go/no-go actions than when they indicate approach/avoidance actions. Furthermore, the go/no-go instruction group overall will choose go items more frequently than no-go items. | Hierarchical logistic regression on choices on the Go-Approach vs. NoGo-Approach and Go-Avoidance vs. NoGo-Avoidance trials. Whether participants choose the Go or NoGo item is the dependent variable (Go = 1, NoGo = 0). Whether both items are Approach or Avoidance is used as a within-subjects predictor, and the instruction group is used as a between-subjects predictor. Random intercept and random slope per participant, left candy and right candy are included. | If task cues influence the effect of GNG on choice, this would indicate that the effect of go/no-go actions on choice depends on action interpretation. If not, this would indicate that different from stimulus evaluation, choice change by GNG is not dependent on action interpretation. |