
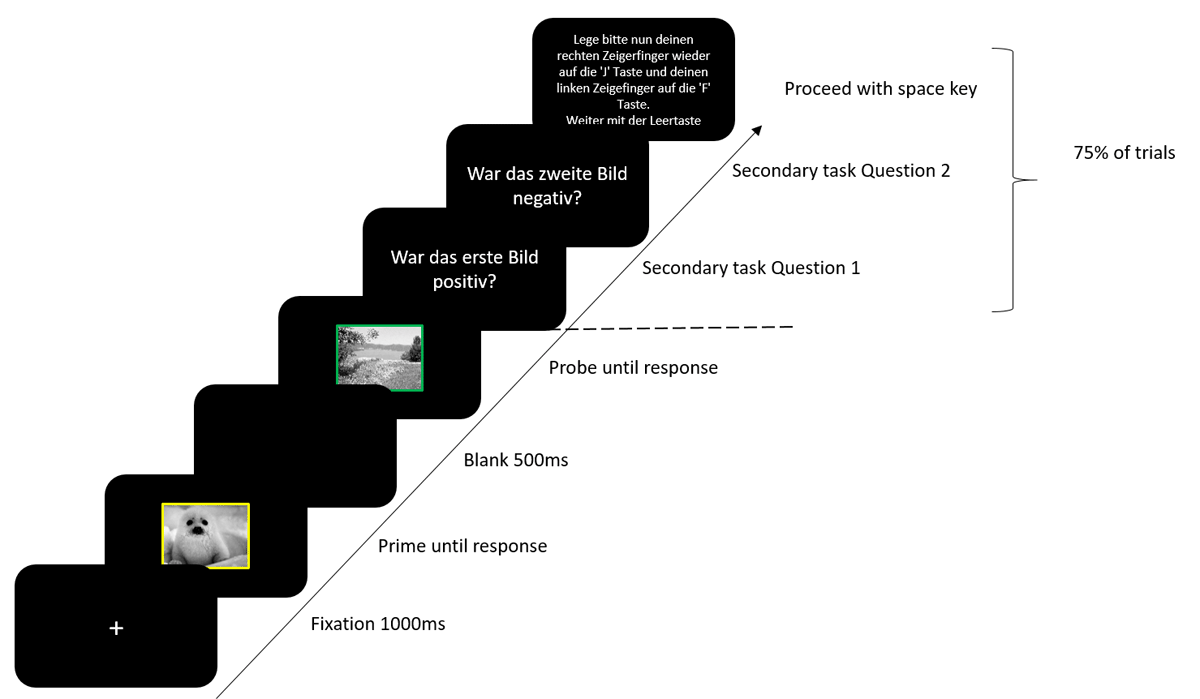
Figure 1
Trial sequence. Secondary task Question 1 translates to “was the first image positive?”. Secondary task Question 2 translates to “was the second image negative?”. Questions could be regarding the valence or the category of the stimulus. For valence, the question could refer to whether the image was positive or negative. For category, the question could refer to whether the image was animate or inanimate. The ‘Proceed with space key’ instruction translates to “Place your right index finger back on the ’J’ key and your left index finger on the ‘F’ key. Proceed with the spacebar.”
Table 1
Mean RTs and SD in ms for picture stimuli and word stimuli from Singh et al. (2018).
| VR | VC | ||||
|---|---|---|---|---|---|
| CR | CC | CR | CC | ||
| MEAN (SD) | MEAN (SD) | MEAN (SD) | MEAN (SD) | ||
| Valence Attended | |||||
| RR | Picture | 833 (219) | 824 (198) | 898 (266) | 907 (272) |
| Word | 582 (102) | 580 (116) | 619 9(5) | 628 (117) | |
| RC | Picture | 912 (248) | 923 (268) | 875 (240) | 894 (262) |
| Word | 668 (118) | 673 (122) | 658 (125) | 658 (132) | |
| Category Attended | |||||
| RR | Picture | 786 (207) | 839 (249) | 801 (231) | 827 (230) |
| Word | 537 (66) | 552 (67) | 540 (55) | 559 (70) | |
| RC | Picture | 817 (180) | 824 (180) | 820 (197) | 819 (212) |
| Word | 592 (57) | 592 (64) | 588 (66) | 584 (44) | |
[i] VR/VC = Valence repetition and valence change, CR/CC = Category repetition and category change, RR/RC = response repetition and response change.
Table 2
Full analysis of RTs in Experiment 1.
| EFFECT | DFs | F | p | ηp2 |
|---|---|---|---|---|
| Attended Feature (A) | 1, 51 | 1.17 | .284 | .02 |
| Response Relation (R) | 1, 51 | 5.99 | .018 | .11 |
| Valence Relation (V) | 1, 51 | 3.95 | .052 | .07 |
| Category Relation (C) | 1, 51 | 8.96 | .004 | .15 |
| A × R | 1, 51 | 2.81 | .100 | .05 |
| A × V | 1, 51 | 3.89 | .054 | .07 |
| A × C | 1, 51 | 2.09 | .155 | .04 |
| R × V | 1, 51 | 20.89 | <.001 | .29 |
| R × C | 1, 51 | 0.94 | .338 | .02 |
| V × C | 1, 51 | 0.06 | .802 | .00 |
| A × R × V | 1, 51 | 19.29 | <.001 | .27 |
| A × R × C | 1, 51 | 5.32 | .025 | .09 |
| A × V × C | 1, 51 | 3.53 | .066 | .06 |
| R × V × C | 1, 51 | 0.07 | .797 | .00 |
| A × R × V × C | 1, 51 | 0.54 | .464 | .01 |
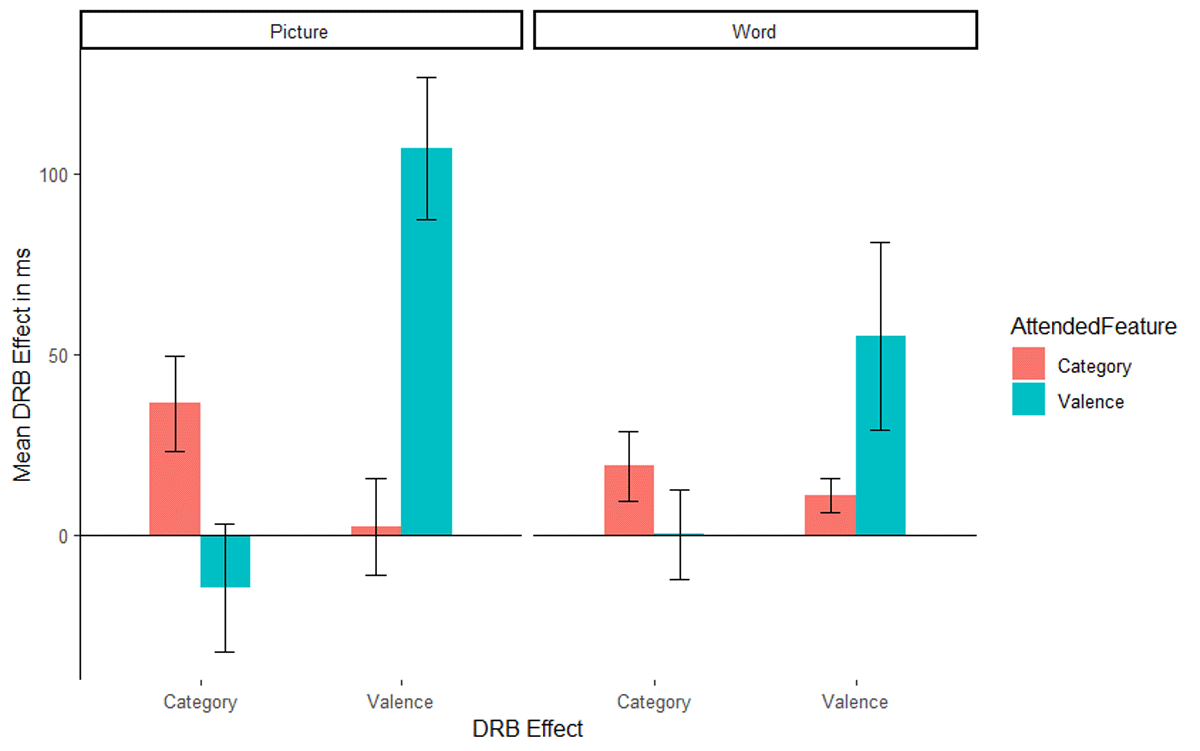
Figure 2
Mean distractor-response binding effects in RTs as a function of second task and stimulus material: picture stimuli of the present study (left panel) and word stimuli of the Singh et al. (2018) study (right panel). The x-axis depicts both Distractor-Response Binding effects (DRB Effect), i.e., valence-response or category-response binding effect. The y-axis depicts the mean Distractor-Response Binding effect (DRB Effect) in ms. The colour legend depicts which feature was attended. Error bars denote the standard error of the mean.
Table 3
Mean Error Rates and SD in error percent for picture stimuli and word stimuli from Singh et al. (2018).
| VR | VC | ||||
|---|---|---|---|---|---|
| CR | CC | CR | CC | ||
| MEAN (SD) | MEAN (SD) | MEAN (SD) | MEAN (SD) | ||
| Valence Attended | |||||
| RR | Picture | 2.34 (3.69) | 1.62 (2.48) | 5.35 (4.94) | 5.76 (5.83) |
| Word | 1.30 (2.71) | 1.11 (2.02) | 2.76 (4.21) | 4.16 (5.69) | |
| RC | Picture | 6.39 (5.41) | 5.42 (5.46) | 5.03 (5.48) | 3.39 (4.92) |
| Word | 2.91 (5.12) | 2.88 (5.34) | 1.96 (4.16) | 2.90 (5.81) | |
| Category Attended | |||||
| RR | Picture | 2.67 (3.97) | 6.39 (5.36) | 2.44 (3.25) | 6.41 (6.41) |
| Word | 1.00 (1.99) | 3.93 (5.41) | 1.50 (2.45) | 2.75 (4.05) | |
| RC | Picture | 6.47 (6.00) | 2.59 (4.08) | 5.81 (5.14) | 3.25 (5.37) |
| Word | 3.07 (2.69) | 0.90 (2.13) | 3.50 (4.60) | 1.12 (1.83) | |
[i] VR/VC = Valence repetition and valence change, CR/CC = Category repetition and category change, RR/RC = response repetition and response change.
Table 4
Full analysis of error rates of Experiment 1.
| EFFECT | DFs | F | p | ηp2 |
|---|---|---|---|---|
| Attended Feature (A) | 1, 51 | 0.02 | .900 | .00 |
| Response Relation (R) | 1, 51 | 1.09 | .301 | .02 |
| Valence Relation (V) | 1, 51 | 1.22 | .274 | .02 |
| Category Relation (C) | 1, 51 | 0.36 | .552 | .01 |
| A × R | 1, 51 | 0.93 | .339 | .02 |
| A × V | 1, 51 | 1.54 | .220 | .03 |
| A × C | 1, 51 | 2.26 | .139 | .04 |
| R × V | 1, 51 | 8.85 | .004 | .15 |
| R × C | 1, 51 | 24.23 | <.001 | .32 |
| V × C | 1, 51 | 0.41 | .525 | .01 |
| A × R × V | 1, 51 | 9.58 | .003 | .16 |
| A × R × C | 1, 51 | 12.58 | .001 | .20 |
| A × V × C | 1, 51 | 0.12 | .734 | .00 |
| R × V × C | 1, 51 | 0.07 | .795 | .00 |
| A × R × V × C | 1, 51 | 1.03 | .316 | .02 |
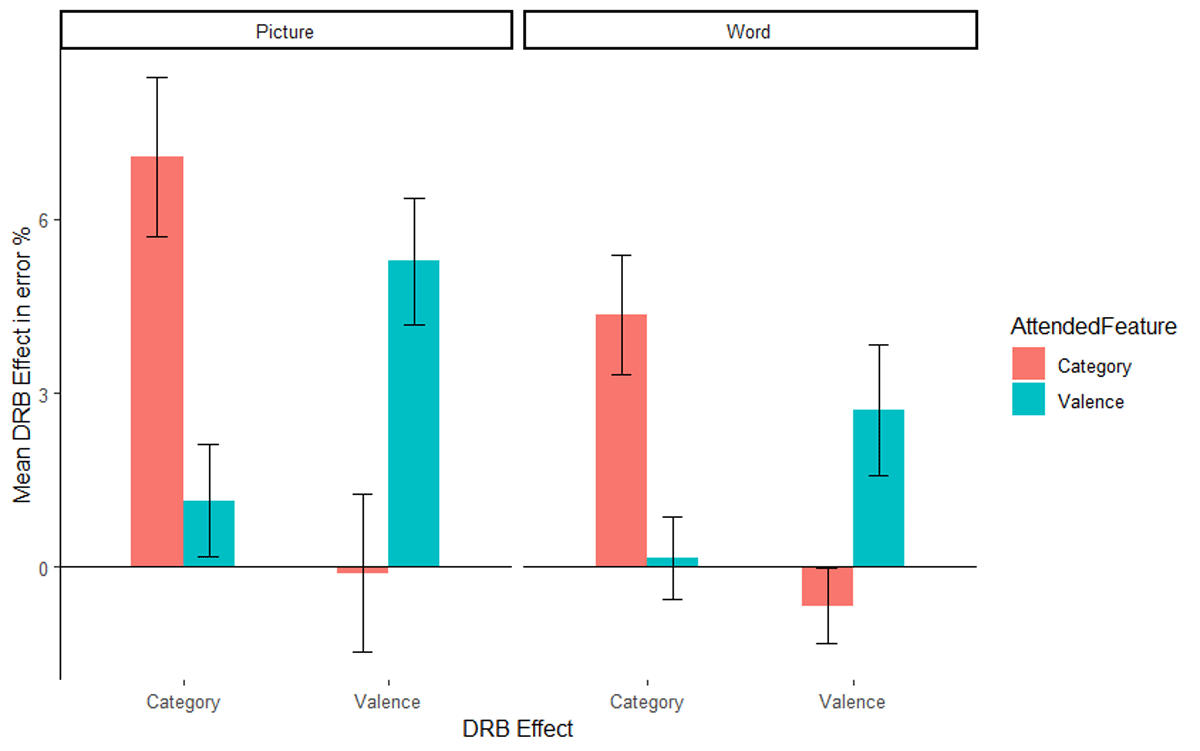
Figure 3
Mean distractor-response binding effects in error rates as a function of second task and stimulus material: picture stimuli of the present study (left panel) and word stimuli of the Singh et al. (2018) study (right panel). The x-axis depicts both Distractor-Response Binding effects (DRB Effect), i.e., valence-response or category-response binding effect. The y-axis depicts the mean Distractor-Response Binding effect (DRB Effect) in error percentage. The colour legend depicts which feature was attended. Error bars denote the standard error of the mean.
Table 5
Full results of between experiment analysis for reaction times.
| EFFECT | DFs | F | p | ηp2 |
|---|---|---|---|---|
| Attended feature (A) | 1, 109 | 2.80 | .097 | .03 |
| Stimulus type (S) | 1, 109 | 40.16 | <.001 | .27 |
| Response relation (R) | 1, 109 | 60.79 | <.001 | .36 |
| Valence relation (V) | 1, 109 | 8.15 | .005 | .07 |
| Category relation (C) | 1, 109 | 14.74 | <.001 | .12 |
| A × S | 1, 109 | 0.00 | .982 | .00 |
| A × R | 1, 109 | 6.75 | .011 | .06 |
| S × R | 1, 109 | 10.94 | .001 | .09 |
| A × V | 1, 109 | 8.53 | .004 | .07 |
| S × V | 1, 109 | 0.24 | .626 | .00 |
| A × C | 1, 109 | 3.27 | .073 | .03 |
| S × C | 1, 109 | 3.33 | .071 | .03 |
| R × V | 1, 109 | 23.60 | <.001 | .18 |
| R × C | 1, 109 | 2.28 | .134 | .02 |
| V × C | 1, 109 | 0.00 | .974 | .00 |
| A × S × R | 1, 109 | 0.23 | .635 | .00 |
| A × S × V | 1, 109 | 0.16 | .690 | .00 |
| A × S × C | 1, 109 | 0.86 | .357 | .01 |
| A × R × V | 1, 109 | 17.16 | <.001 | .14 |
| S × R × V | 1, 109 | 1.47 | .229 | .01 |
| A × R × C | 1, 109 | 6.86 | .010 | .06 |
| S × R × C | 1, 109 | 0.01 | .928 | .00 |
| A × V × C | 1, 109 | 2.94 | .089 | .03 |
| S × V × C | 1, 109 | 0.14 | .705 | .00 |
| R × V × C | 1, 109 | 0.13 | .716 | .00 |
| A × S × R × V | 1, 109 | 2.85 | .094 | .03 |
| A × S × R × C | 1, 109 | 1.44 | .233 | .01 |
| A × S × V × C | 1, 109 | 1.83 | .179 | .01 |
| A × R × V × C | 1, 109 | 0.77 | .383 | .01 |
| S × R × V × C | 1, 109 | 0.73 | .395 | .01 |
| A × S × R × V × C | 1, 109 | 0.27 | .605 | .00 |
Table 6
Full results of between experiment analysis for error rates.
| EFFECT | DFs | F | p | ηp2 |
|---|---|---|---|---|
| Attended feature (A) | 1, 109 | 0.04 | .845 | .00 |
| Stimulus type (S) | 1, 109 | 19.82 | <.001 | .15 |
| Response relation (R) | 1, 109 | 0.89 | .346 | .01 |
| Valence relation (V) | 1, 109 | 3.35 | .070 | .03 |
| Category relation (C) | 1, 109 | 0.00 | .979 | .00 |
| A × S | 1, 109 | 0.15 | .698 | .00 |
| A × R | 1, 109 | 1.14 | .288 | .01 |
| S × R | 1, 109 | 0.52 | .472 | .00 |
| A × V | 1, 109 | 3.84 | .053 | .03 |
| S × V | 1, 109 | 0.00 | 1.00 | .00 |
| A × C | 1, 109 | 0.26 | .609 | .00 |
| S × C | 1, 109 | 1.06 | .305 | .01 |
| R × V | 1, 109 | 11.36 | .001 | .09 |
| R × C | 1, 109 | 38.38 | <.001 | .26 |
| V × C | 1, 109 | 0.53 | .467 | .00 |
| A × S × R | 1, 109 | 0.22 | .638 | .00 |
| A × S × V | 1, 109 | 0.01 | .923 | .00 |
| A × S × C | 1, 109 | 4.06 | .046 | .04 |
| A × R × V | 1, 109 | 16.72 | <.001 | .13 |
| S × R × V | 1, 109 | 2.12 | .148 | .02 |
| A × R × C | 1, 109 | 24.31 | <.001 | .18 |
| S × R × C | 1, 109 | 3.24 | .074 | .03 |
| A × V × C | 1, 109 | 0.84 | .362 | .01 |
| S × V × C | 1, 109 | 0.14 | .710 | .00 |
| R × V × C | 1, 109 | 0.00 | .971 | .00 |
| A × S × R × V | 1, 109 | 0.87 | .353 | .01 |
| A × S × R × C | 1, 109 | 0.69 | .408 | .01 |
| A × S × V × C | 1, 109 | 2.26 | .135 | .02 |
| A × R × V × C | 1, 109 | 2.33 | .130 | .02 |
| S × R × V × C | 1, 109 | 0.24 | .623 | .00 |
| A × S × R × V × C | 1, 109 | 0.06 | .812 | .00 |
Table 7
Mean RTs and SD in ms for each condition in Experiment 2.
| VR | VC | |||
|---|---|---|---|---|
| CR | CC | CR | CC | |
| MEAN (SD) | MEAN (SD) | MEAN (SD) | MEAN (SD) | |
| Valence Attended | ||||
| RR | 722 (212) | 714 (189) | 785 (267) | 788 (307) |
| RC | 785 (285) | 792 (269) | 761 (232) | 776 (225) |
| Category Attended | ||||
| RR | 781 (235) | 824 (269) | 769 (218) | 814 (257) |
| RC | 820 (235) | 805 (225) | 807 (233) | 803 (228) |
[i] VR/VC = Valence repetition and valence change, CR/CC = Category repetition and category change, RR/RC = response repetition and response change.
Table 8
Full results of analysis of RTs for Experiment 2.
| EFFECT | DFs | F | p | ηp2 |
|---|---|---|---|---|
| Attended Feature (A) | 1, 56 | 0.35 | .556 | .01 |
| Response Relation (R) | 1, 56 | 10.44 | .002 | .16 |
| Valence Relation (V) | 1, 56 | 1.50 | .226 | .03 |
| Category Relation (C) | 1, 56 | 6.46 | .014 | .10 |
| A × R | 1, 56 | 1.60 | .211 | .03 |
| A × V | 1, 56 | 7.51 | .008 | .12 |
| A × C | 1, 56 | 2.34 | .132 | .04 |
| R × V | 1, 56 | 7.24 | .009 | .11 |
| R × C | 1, 56 | 3.93 | .052 | .07 |
| V × C | 1, 56 | 0.64 | .427 | .01 |
| A × R × V | 1, 56 | 8.26 | .006 | .13 |
| A × R × C | 1, 56 | 11.28 | .001 | .17 |
| A × V × C | 1, 56 | 0.02 | .829 | .00 |
| R × V × C | 1, 56 | 0.06 | .813 | .00 |
| A × R × V × C | 1, 56 | 0.19 | .662 | .00 |
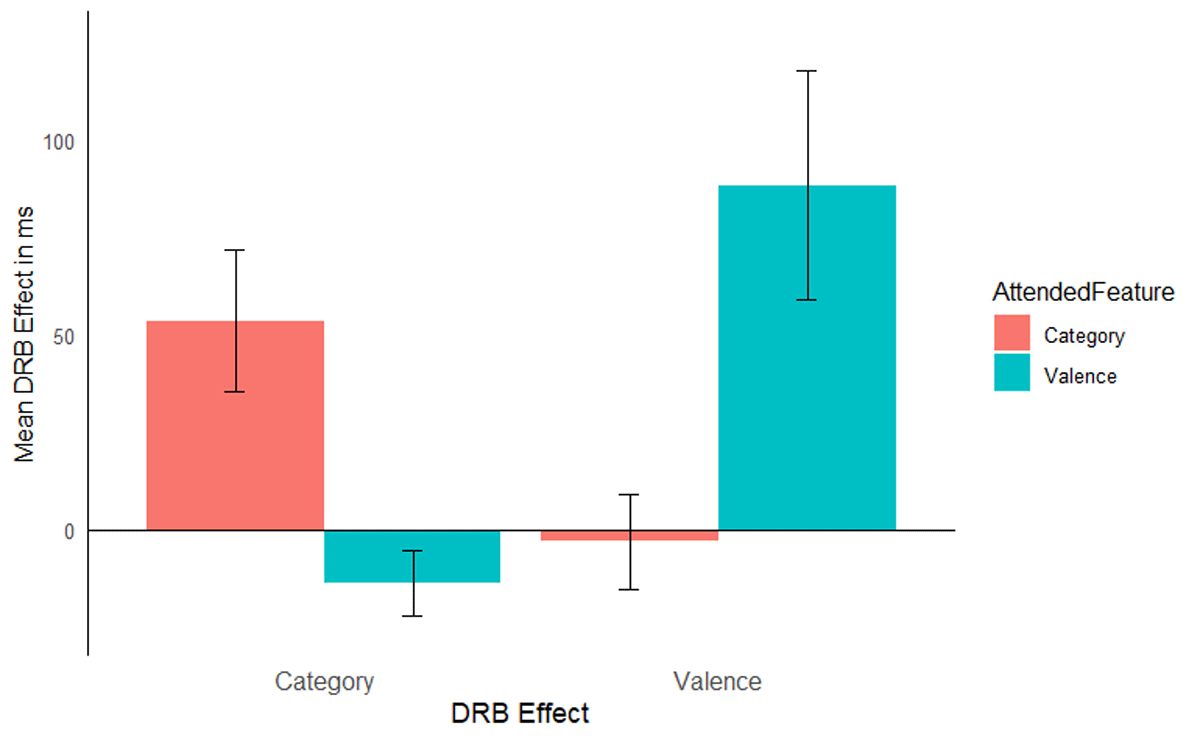
Figure 4
Mean distractor-response binding effects in RTs as a function of second task for Experiment 2. The x-axis depicts both Distractor-Response Binding effects (DRB Effect), i.e., valence-response or category-response binding effect. The y-axis depicts the mean Distractor-Response Binding effect (DRB Effect) in ms. The colour legend depicts which feature was attended. Error bars denote the standard error of the mean.
Table 9
Mean error rates and SD in error percent for Experiment 2.
| VR | VC | |||
|---|---|---|---|---|
| CR | CC | CR | CC | |
| MEAN (SD) | MEAN (SD) | MEAN (SD) | MEAN (SD) | |
| Valence Attended | ||||
| RR | 3.77 (4.04) | 4.20 (4.20) | 3.88 (4.55) | 6.36 (5.63) |
| RC | 4.85 (5.32) | 4.85 (4.98) | 4.63 (4.84) | 3.99 (5.14) |
| Category Attended | ||||
| RR | 4.09 (4.66) | 4.20 (4.60) | 2.91 (3.23) | 4.74 (4.39) |
| RC | 3.56 (5.06) | 4.20 (4.60) | 4.09 (4.88) | 5.06 (6.05) |
[i] VR/VC = Valence repetition and valence change, CR/CC = category repetition and category change, RR/RC = response repetition and response change.
Table 10
Full results of the analysis of error rates for Experiment 2.
| EFFECT | DFs | F | p | ηp2 |
|---|---|---|---|---|
| Attended Feature (A) | 1, 56 | 0.23 | .631 | .00 |
| Response Relation (R) | 1, 56 | 0.17 | .681 | .00 |
| Valence Relation (V) | 1, 56 | 0.70 | .405 | .01 |
| Category Relation (C) | 1, 56 | 5.28 | .025 | .09 |
| A × R | 1, 56 | 0.11 | .743 | .00 |
| A × V | 1, 56 | 0.03 | .853 | .00 |
| A × C | 1, 56 | 0.26 | .612 | .00 |
| R × V | 1, 56 | 0.21 | .649 | .00 |
| R × C | 1, 56 | 2.41 | .127 | .04 |
| V × C | 1, 56 | 2.15 | .148 | .04 |
| A × R × V | 1, 56 | 3.63 | .062 | .06 |
| A × R × C | 1, 56 | 1.67 | .201 | .03 |
| A × V × C | 1, 56 | 0.08 | .784 | .00 |
| R × V × C | 1, 56 | 2.91 | .093 | .05 |
| A × R × V × C | 1, 56 | 0.29 | .592 | .01 |
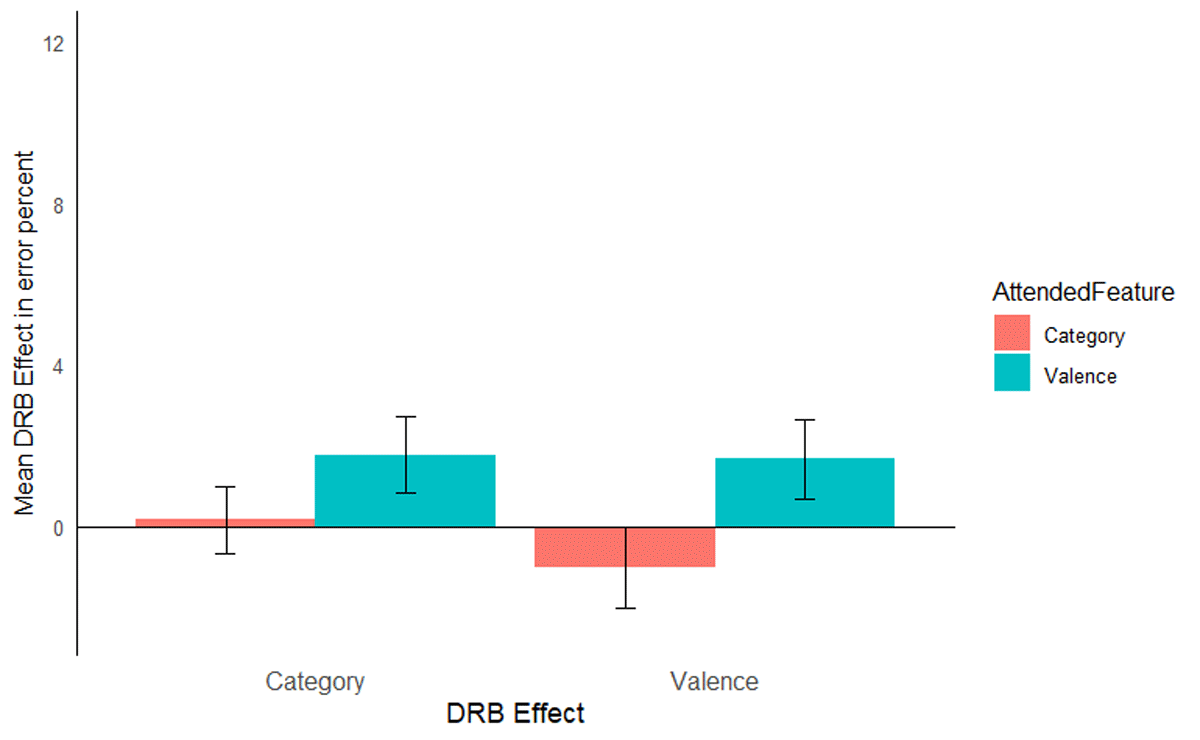
Figure 5
Mean distractor-response binding effects in error rates as a function of second task for Experiment 2. The x-axis depicts both Distractor-Response Binding effects (DRB Effect), i.e., valence-response or category-response binding effect. The y-axis depicts the mean Distractor-Response Binding effect (DRB Effect) in error percentage. The colour legend depicts which feature was attended. Error bars denote the standard error of the mean.