
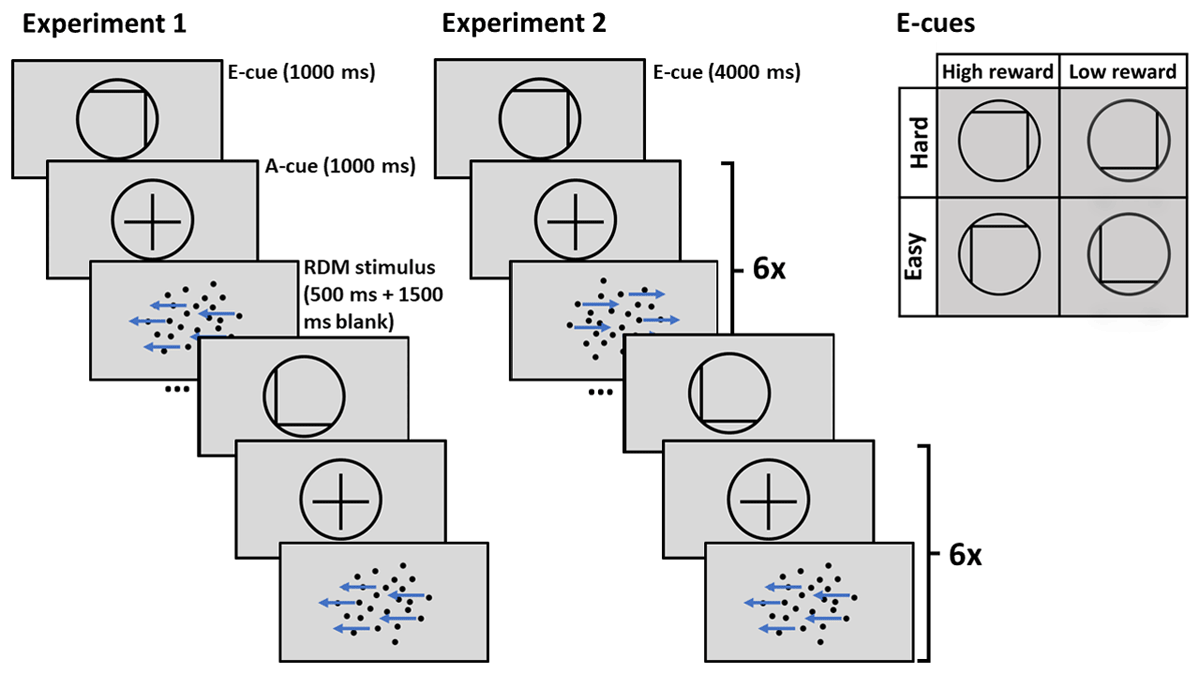
Figure 1
Trial structure of Experiment 1 with short prediction horizon, and Experiment 2 with long prediction horizon.
Note. E-cue stands for evaluation cue, a-cue stands for allocation cue. In Experiment 1 only one allocation cue and one RDM stimulus follow each evaluation cue. In Experiment 2 the allocation cue and RDM stimulus are repeated six times after each evaluation cue.
Table 1
Output of a GLMM of RT across all difficulty levels with random effect structure reward * difficulty | participant.
| PREDICTORS | RT | ||
|---|---|---|---|
| ESTIMATES | CI | p | |
| (Intercept) | 542.84 | 510.30–577.46 | <0.001 |
| Reward (high) | 1.00 | 0.99–1.00 | 0.213 |
| Difficulty (easy) | 0.95 | 0.94–0.96 | <0.001 |
| Experiment 2 | 1.01 | 0.95–1.08 | 0.671 |
| Reward (high) * Difficulty (easy) | 1.00 | 1.00–1.01 | 0.208 |
| Reward (high) * Experiment 2 | 1.00 | 0.99–1.00 | 0.450 |
| Difficulty (easy) * Experiment 2 | 1.00 | 0.99–1.01 | 0.529 |
| Reward (high) * Difficulty (easy) * Experiment 2 | 1.00 | 0.99–1.01 | 0.874 |
| Random Effects | |||
| σ2 | 0.05 | ||
| τ00 participant | 0.01 | ||
| τ11 participant.Reward (high) | 0.00 | ||
| τ11 participant.Difficulty (easy) | 0.00 | ||
| τ11 participant.Reward (high):Difficulty (easy) | 0.00 | ||
| ρ01 | –0.09 | ||
| –0.06 | |||
| 0.02 | |||
| ICC | 0.17 | ||
| N participant | 94 | ||
| Observations | 14780 | ||
| Marginal R2/Conditional R2 | 0.047/0.205 | ||
Table 2
Output of GLMM of accuracy across all difficulty levels with random effect structure difficulty | participant.
| PREDICTORS | ACCURACY | ||
|---|---|---|---|
| ODDS RATIOS | CI | p | |
| (Intercept) | 6.78 | 5.57–8.26 | <0.001 |
| Reward (high) | 1.03 | 0.99–1.08 | 0.162 |
| Difficulty (easy) | 2.11 | 1.92–2.33 | <0.001 |
| Experiment 2 | 0.95 | 0.78–1.15 | 0.577 |
| Reward (high) * Difficulty (easy) | 1.03 | 0.99–1.08 | 0.147 |
| Reward (high) * Experiment 2 | 1.05 | 1.00–1.09 | 0.038 |
| Difficulty (easy) * Experiment 2 | 1.02 | 0.93–1.12 | 0.699 |
| Reward (high) * Difficulty (easy) * Experiment 2 | 1.05 | 1.01–1.10 | 0.028 |
| Random Effects | |||
| σ2 | 3.29 | ||
| τ00 participant | 0.86 | ||
| τ11 participant.Difficulty (easy) | 0.14 | ||
| ρ01 | 0.90 | ||
| ICC | 0.23 | ||
| N participant | 94 | ||
| Observations | 18050 | ||
| Marginal R2/Conditional R2 | 0.117/0.322 | ||
Table 3
Output of a GLMM of RT in intermediate difficulty trials with random effect structure reward * difficulty cue | participant.
| PREDICTORS | RT | ||
|---|---|---|---|
| ESTIMATES | CI | p | |
| (Intercept) | 547.44 | 513.11–584.08 | <0.001 |
| Reward (high) | 1.00 | 0.99–1.01 | 0.899 |
| Difficulty cue (easy) | 0.99 | 0.99–1.00 | 0.117 |
| Experiment 2 | 1.02 | 0.96–1.09 | 0.563 |
| Reward (high) * Difficulty cue (easy) | 1.00 | 0.99–1.01 | 0.726 |
| Reward (high) * Experiment 2 | 1.00 | 0.99–1.01 | 0.893 |
| Difficulty cue (easy) * Experiment 2 | 0.99 | 0.99–1.00 | 0.184 |
| Reward (high) * Difficulty cue (easy) * Experiment 2 | 1.00 | 0.99–1.01 | 0.676 |
| Random Effects | |||
| σ2 | 0.05 | ||
| τ00 participant | 0.01 | ||
| τ11 participant.Reward (high) | 0.00 | ||
| τ11 participant.Difficulty cue (easy) | 0.00 | ||
| τ11 participant. Reward (high): Difficulty cue (easy) | 0.00 | ||
| ρ01 | –0.05 | ||
| 0.01 | |||
| 0.11 | |||
| ICC | 0.52 | ||
| N participant | 94 | ||
| Observations | 7413 | ||
| Marginal R2/Conditional R2 | 0.007/0.204 | ||
Table 4
Output of a GLMM of accuracy in intermediate difficulty trials with random effect structure reward | participant.
| PREDICTORS | ACCURACY | ||
|---|---|---|---|
| ODDS RATIOS | CI | p | |
| (Intercept) | 5.83 | 4.83–7.03 | <0.001 |
| Reward (high) | 1.01 | 0.93–1.09 | 0.883 |
| Difficulty cue (easy) | 1.03 | 0.97–1.09 | 0.341 |
| Experiment 2 | 0.95 | 0.79–1.15 | 0.618 |
| Reward (high) * Difficulty cue (easy) | 1.07 | 1.01–1.13 | 0.019 |
| Reward (high) * Experiment 2 | 0.95 | 0.89–1.02 | 0.170 |
| Difficulty cue (easy) * Experiment 2 | 1.06 | 1.00–1.12 | 0.046 |
| Reward (high) * Difficulty cue (easy) * Experiment 2 | 1.06 | 1.00–1.12 | 0.061 |
| Random Effects | |||
| σ2 | 3.29 | ||
| τ00 participant | 0.75 | ||
| τ11 participant. Reward (high) | 0.03 | ||
| ρ01 | 0.15 | ||
| ICC | 0.19 | ||
| N participant | 94 | ||
| Observations | 9020 | ||
| Marginal R2/Conditional R2 | 0.004/0.195 | ||
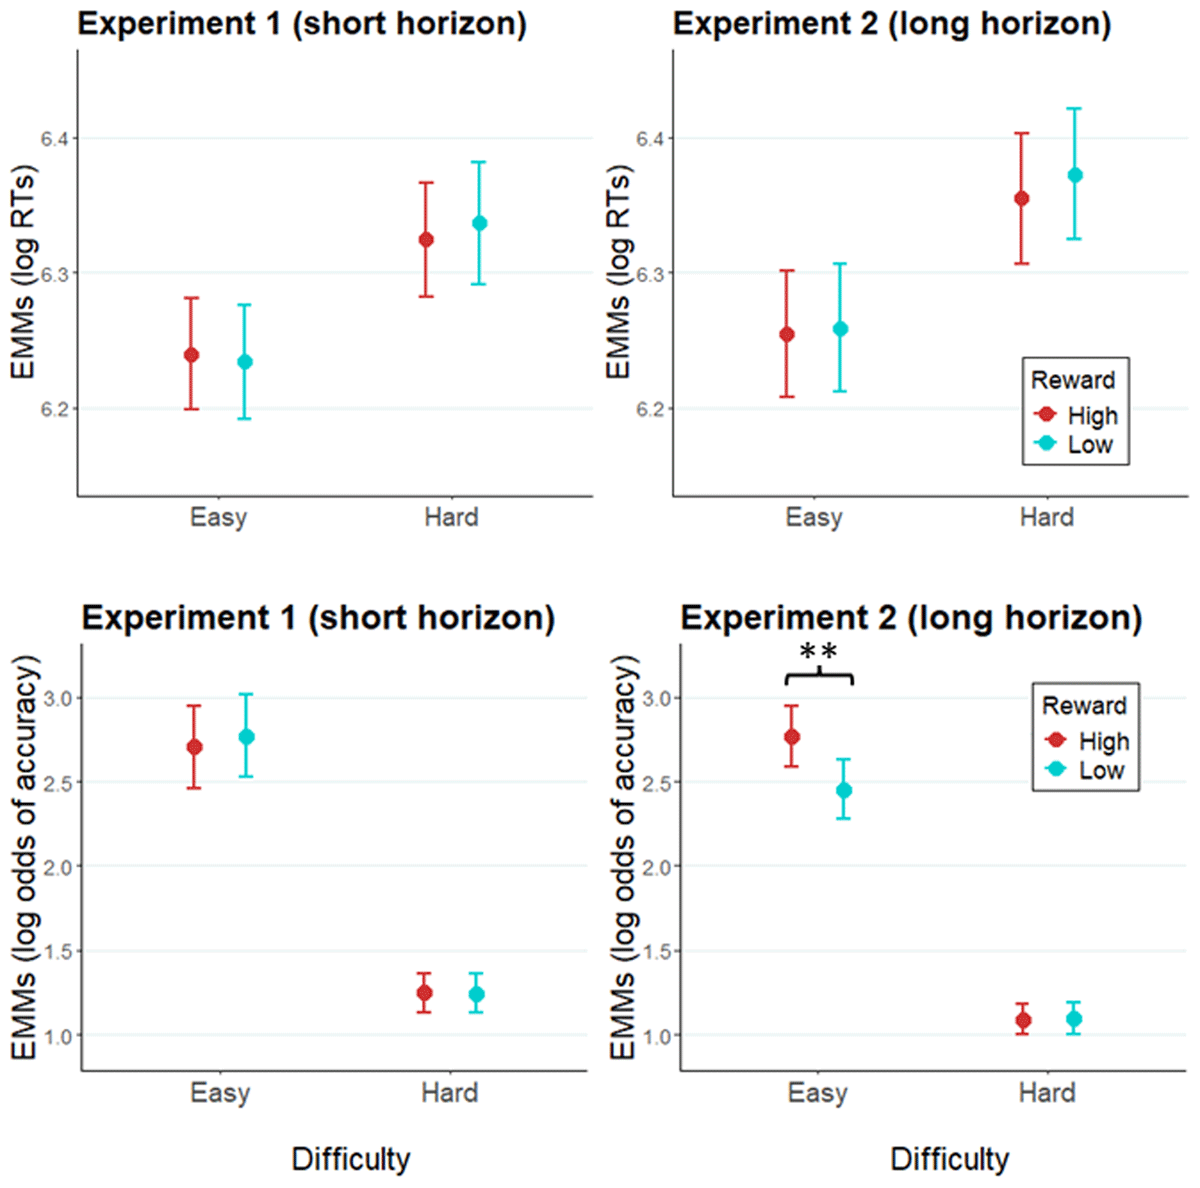
Figure 2
Modelled performance indices across easy and hard trials.
Note. Estimated marginal means of log RT and of log odds of accuracy in Experiment 1 (left panel), and Experiment 2 (right panel). Error bars represent the standard error of the estimated marginal mean. ** = p < .01.
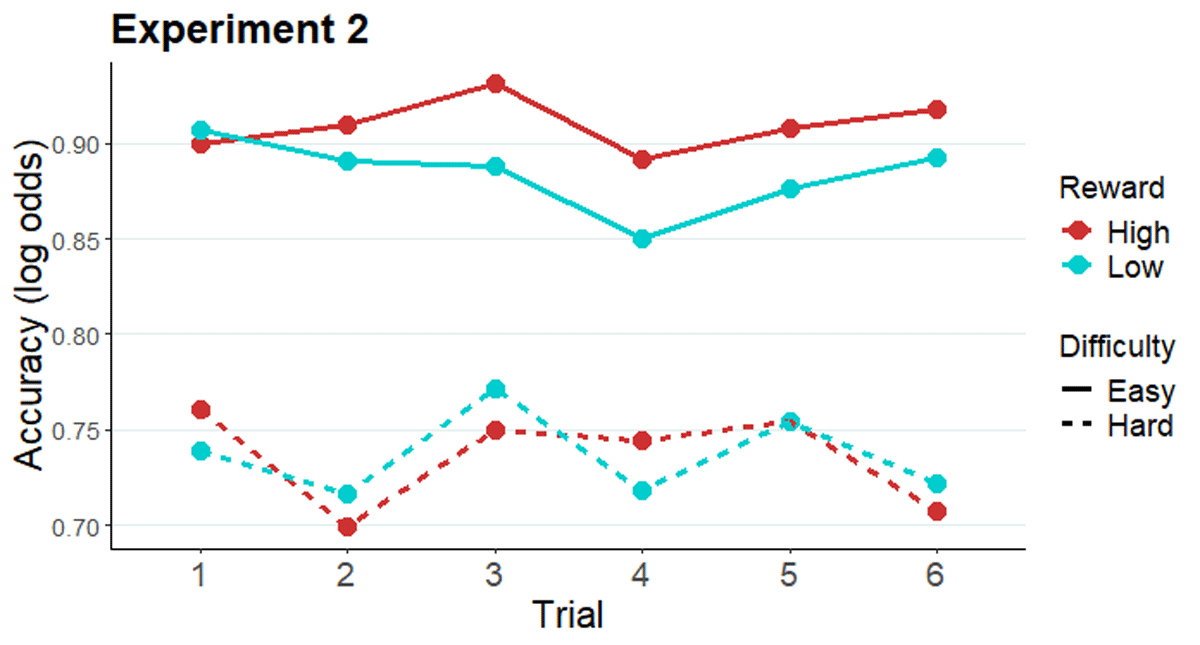
Figure 3
Modelled performance indices across all six trials after an evaluation-cue (easy and hard conditions).
Note. Estimated marginal means of log odds of accuracy along the miniblock of six trials preceded by an evaluation-cue in Experiment 2.
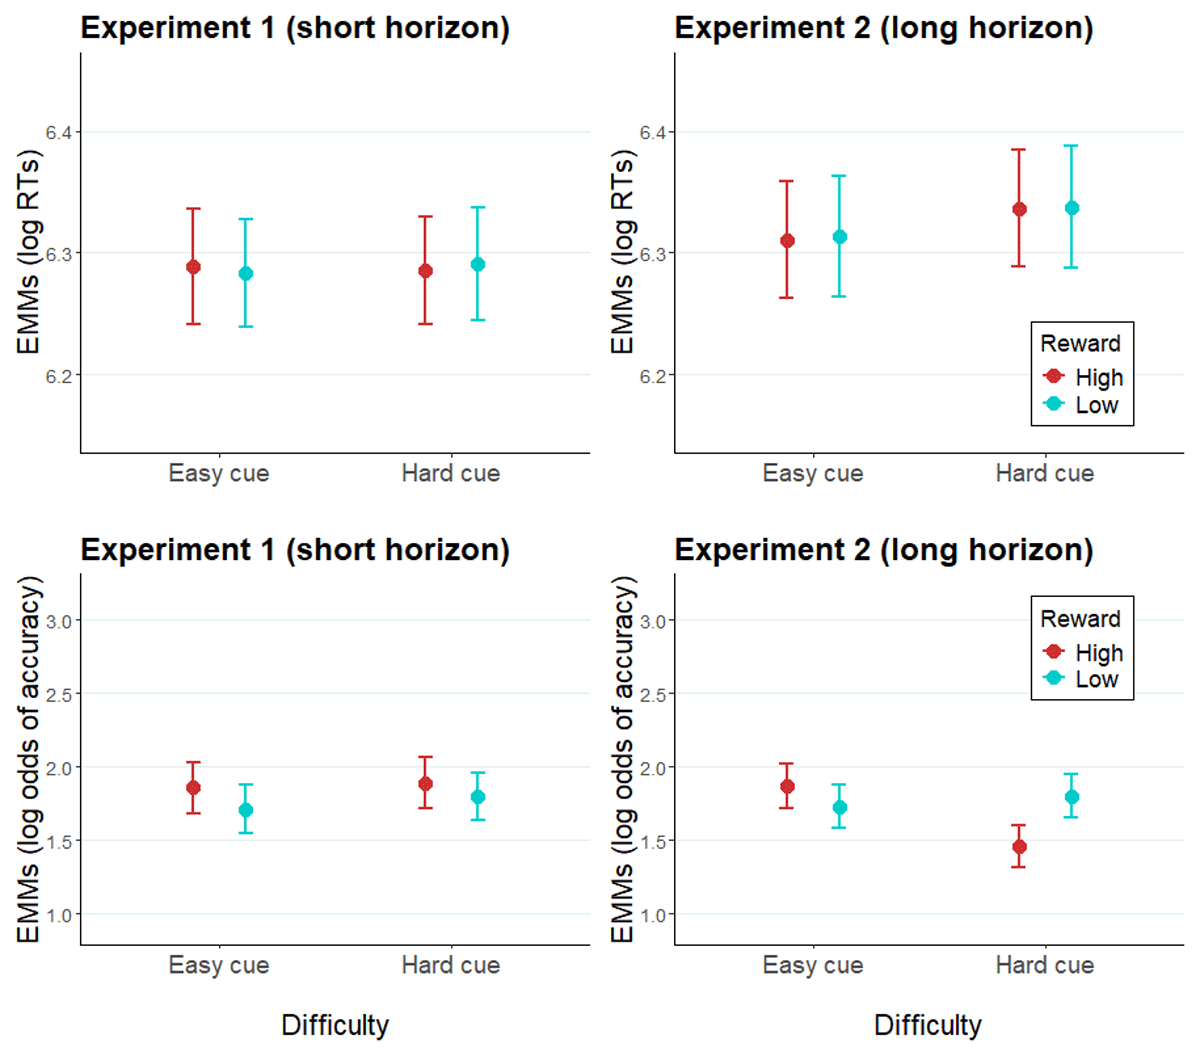
Figure 4
Modelled performance indices of intermediate difficulty trials in Experiment 1 and Experiment 2.
Note. Estimated marginal means of log RTs and log odds of accuracy of intermediate difficulty trials in Experiment 1 (left panel) and Experiment 2 (right panel). Error bars represent the standard error of the estimated marginal means.
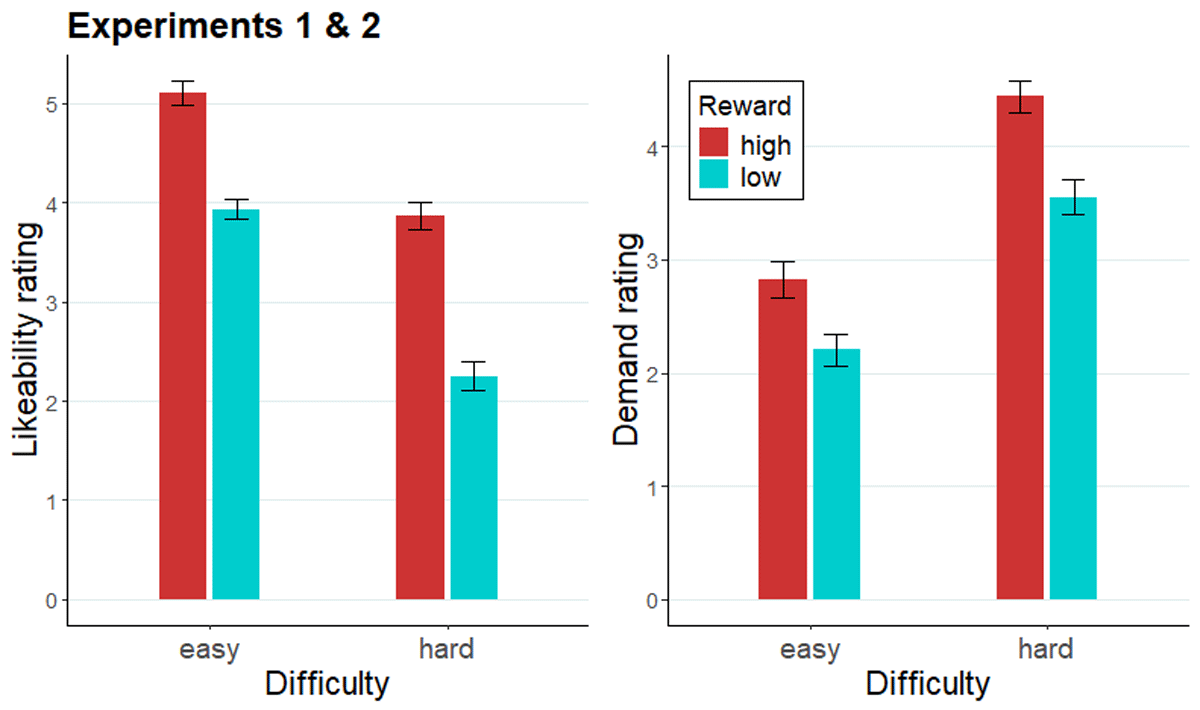
Figure 5
Likeability and demand ratings of evaluation cues across Experiments 1 and 2.
Note. Likeability (left panel) and demand (right panel) rating of evaluation cues across Experiment 1 and 2. Error bars represent the standard error of the mean.
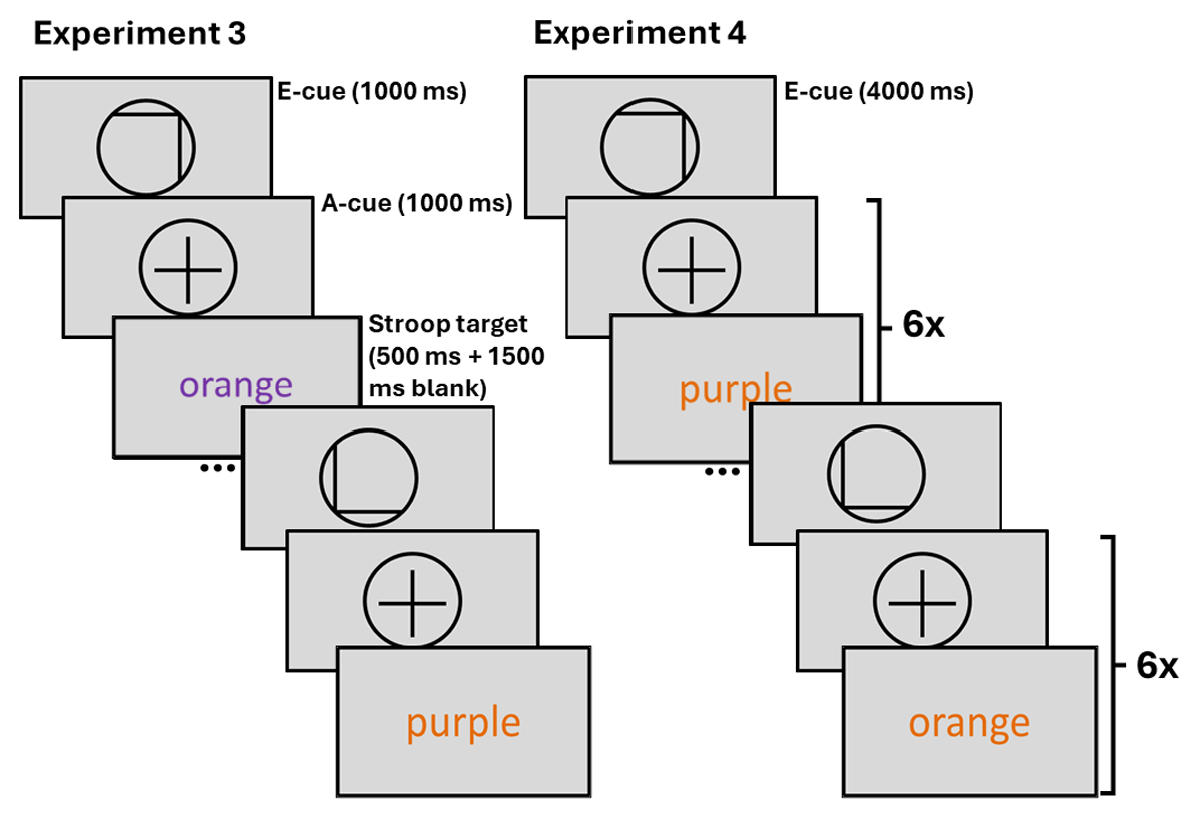
Figure 6
Trial structure of Experiment 3 with short prediction horizon, and Experiment 4 with long prediction horizon.
Note. E-cue stands for evaluation cue, a-cue stands for allocation cue. In Experiment 3 only one allocation cue and one Stroop target follow each evaluation cue. In Experiment 4 the allocation cue and a varying Stroop target of the cued difficulty (congruency) are presented six times after each evaluation cue.
Table 5
Output of a GLMM of RT across all difficulty levels with random effect structure 1 | participant.
| PREDICTORS | RT | ||
|---|---|---|---|
| ESTIMATES | CI | p | |
| (Intercept) | 405.23 | 393.00–417.84 | <0.001 |
| Reward (high) | 1.00 | 0.99–1.00 | <0.001 |
| Difficulty (easy) | 0.99 | 0.99–0.99 | <0.001 |
| Experiment 4 | 0.99 | 0.96–1.02 | 0.592 |
| Reward (high) * Difficulty (easy) | 1.00 | 1.00–1.00 | 0.345 |
| Reward (high) * Experiment 4 | 1.00 | 1.00–1.00 | 0.039 |
| Difficulty (easy) * Experiment 4 | 1.00 | 1.00–1.00 | 0.249 |
| Reward (high) * Difficulty (easy) * Experiment 4 | 1.00 | 1.00–1.00 | 0.510 |
| Random Effects | |||
| σ2 | 0.03 | ||
| τ00 participant | 0.00 | ||
| ICC | 0.06 | ||
| N participant | 98 | ||
| Observations | 25547 | ||
| Marginal R2/Conditional R2 | 0.005/0.068 | ||
Table 6
Output of a GLMM of accuracy across all difficulty levels with random effect structure difficulty | participant.
| PREDICTORS | ACCURACY | ||
|---|---|---|---|
| ODDS RATIOS | CI | p | |
| (Intercept) | 20.25 | 17.19–23.85 | <0.001 |
| Reward (high) | 1.04 | 0.99–1.10 | 0.130 |
| Difficulty (easy) | 1.18 | 1.10–1.26 | <0.001 |
| Experiment 4 | 1.21 | 1.03–1.42 | 0.023 |
| Reward (high) * Difficulty (easy) | 1.03 | 0.98–1.09 | 0.226 |
| Reward (high) * Experiment 4 | 1.02 | 0.96–1.07 | 0.538 |
| Difficulty (easy) * Experiment 4 | 1.02 | 0.96–1.09 | 0.437 |
| Reward (high) * Difficulty (easy) * Experiment 4 | 1.00 | 0.95–1.05 | 0.970 |
| Random Effects | |||
| σ2 | 3.29 | ||
| τ00 participant | 0.58 | ||
| τ11 participant.Difficulty (easy) | 0.02 | ||
| ρ01 participant | –0.74 | ||
| ICC | 0.16 | ||
| N participant | 98 | ||
| Observations | 27233 | ||
| Marginal R2/Conditional R2 | 0.016/0.169 | ||
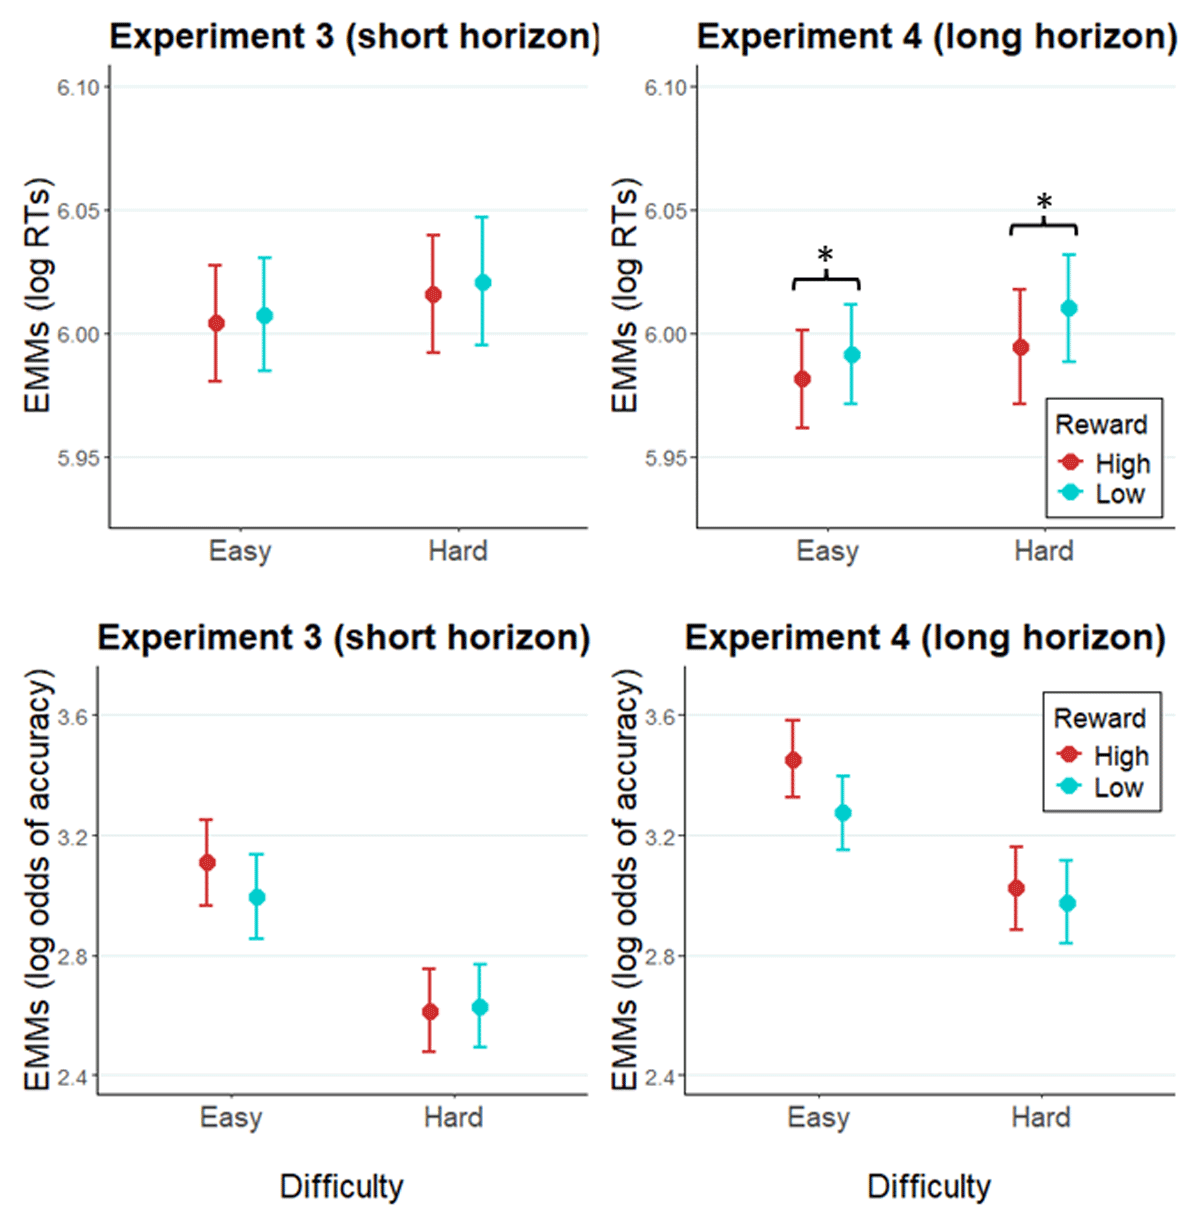
Figure 7
Modelled performance indices in Experiment 3 and Experiment 4.
Note. Estimated marginal means of RTs and of log odds of accuracy in Experiment 3 (left panel), and Experiment 4 (right panel). Error bars represent the standard error of the estimated marginal mean. * = p < .05.
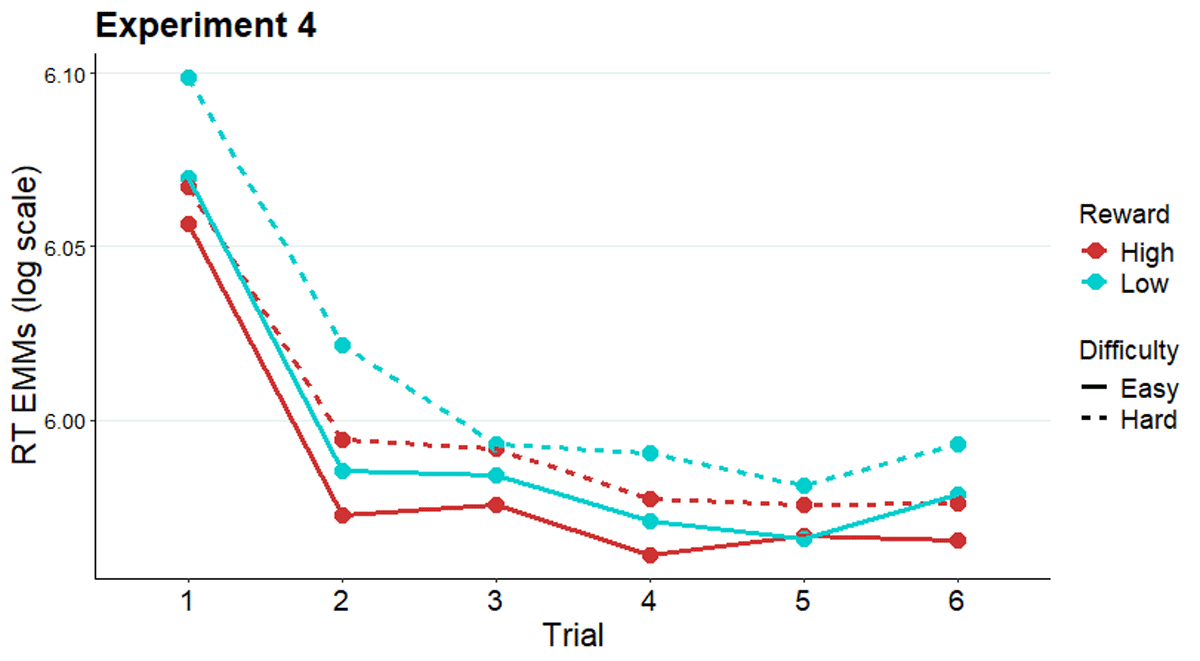
Figure 8
Modelled reaction times across trials of a miniblock in Experiment 4.
Note. Estimated marginal means of RT along the miniblock of six trials preceded by an evaluation-cue in Experiment 4.
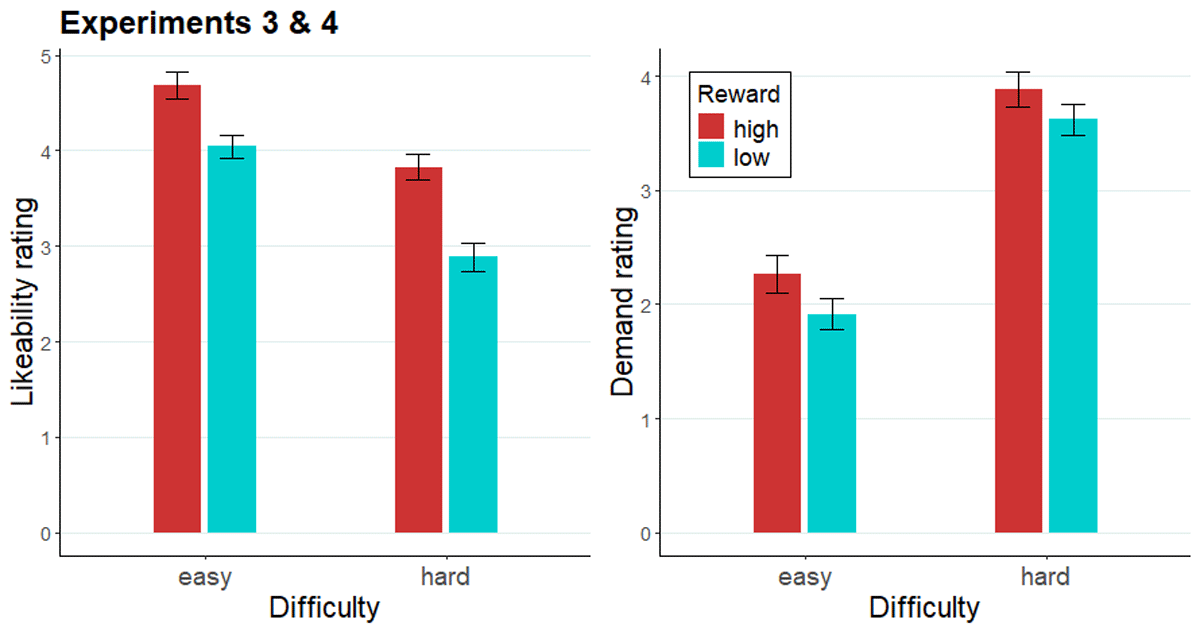
Figure 9
Likeability and demand ratings of evaluation cues across Experiments 3 and 4.
Note. The likeability rating (left) and demand rating (right) of each e-cue across Experiment 3 and 4.