
Table 1
Experiment 1: Numbers of Participants with Different Education Levels for Each Age Band.
| AGE BAND | HIGHEST EDUCATION LEVEL | |||||
|---|---|---|---|---|---|---|
| NO FORMAL QUALIFICATIONS | SECONDARY SCHOOL/GCSE | COLLEGE/A LEVELS | UNDERGRADUATE DEGREE (E.G., BA/BSC) | GRADUATE DEGREE (E.G., MA/MSC) | DOCTORATE DEGREE (E.G., PhD) | |
| 18–29 | 0 | 1 | 11 | 7 | 0 | 0 |
| 30–39 | 0 | 10 | 3 | 14 | 0 | 1 |
| 40–49 | 0 | 2 | 7 | 8 | 4 | 1 |
| 50–59 | 1 | 4 | 7 | 3 | 4 | 0 |
| 60–69 | 0 | 6 | 4 | 7 | 3 | 0 |
| Total | 1 | 23 | 32 | 39 | 11 | 2 |
Table 2
Experiment 1: Descriptive Statistics (means and standard deviations) of Properties of Target Words, Synonyms, and Foils.
| LENGTH | FREQUENCY (RAW COUNTS) | FREQUENCY (PER MILLION) | FREQUENCY (LOG-TRANSFORMED) | |
|---|---|---|---|---|
| Target | 8.1 (1.87) | 613.98 (1510.38) | 3.05 (7.5) | 3.99 (2.41) |
| Synonym | 8.02 (2.35) | 1523.04 (3310.76) | 7.56 (16.43) | 5.88 (1.87) |
| Foil | 7.41 (1.97) | 3297.65 (5475.68) | 16.37 (27.18) | 6.24 (1.98) |
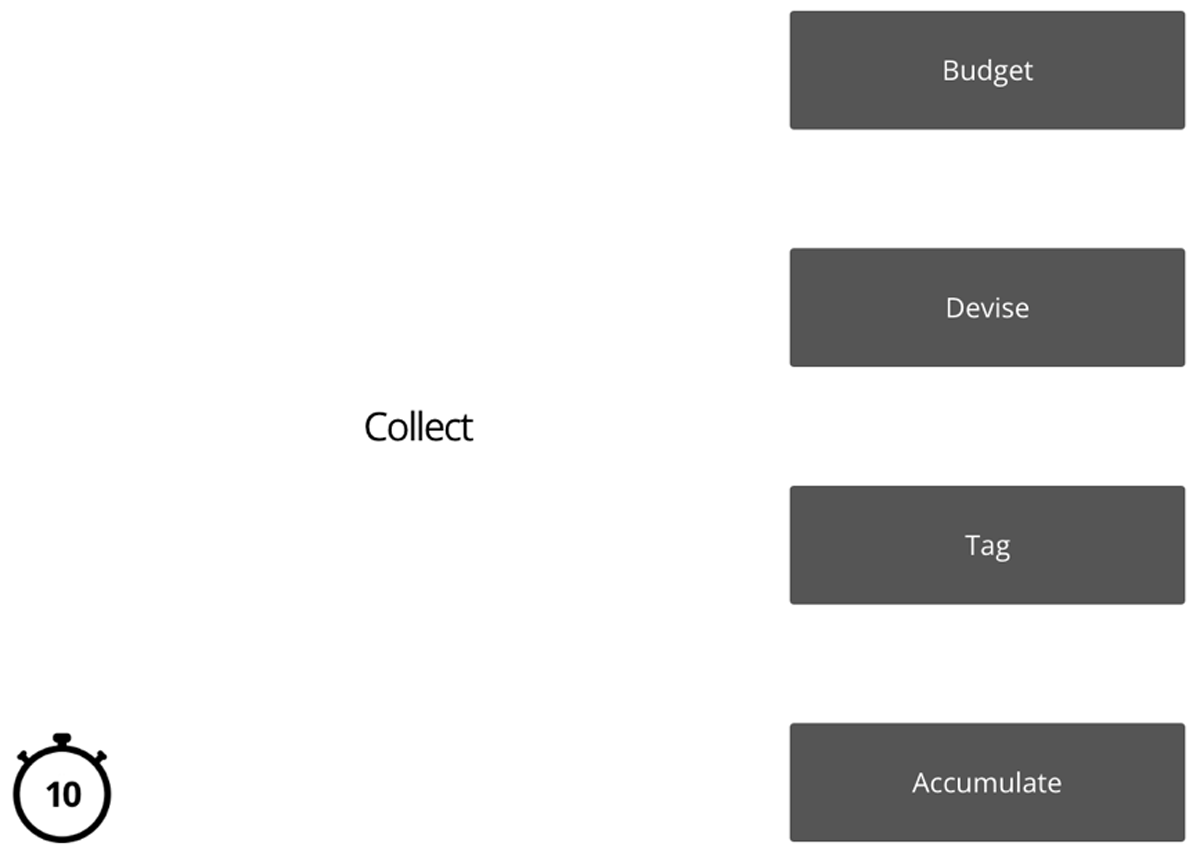
Figure 1
Experiment 1: Example trial.
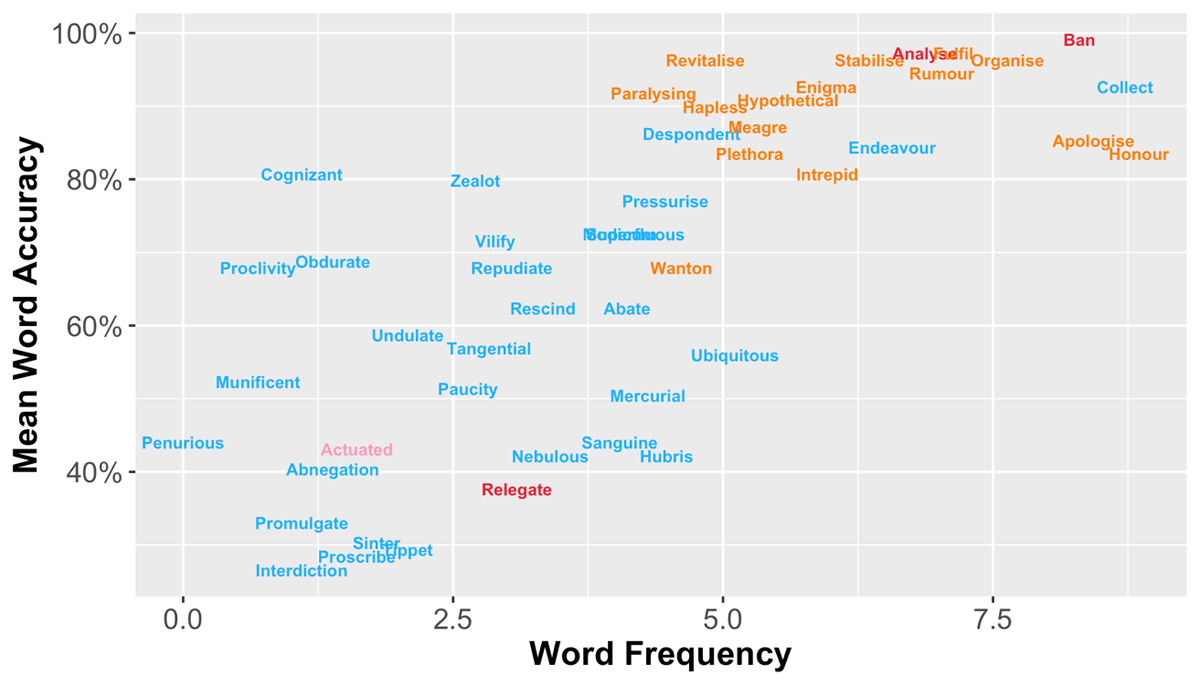
Figure 2
A scatter plot showing the relationship between log-transformed word frequency and mean accuracy for the final set of 30 words (blue) as well as items that were removed due to low correlation with participants’ overall performance (red), poor fit statistics of the Rasch model (orange), or unsatisfactory discriminability of the 2-PL logistic model (pink).
Table 3
Experiment 2: Numbers of Participants with Different Education Levels for Each Age Band.
| AGE BAND | HIGHEST EDUCATION LEVEL | |||||
|---|---|---|---|---|---|---|
| NO FORMAL QUALIFICATIONS | SECONDARY SCHOOL/GCSE | COLLEGE/A LEVELS | UNDERGRADUATE DEGREE (E.G., BA/BSC) | GRADUATE DEGREE (E.G., MA/MSC) | DOCTORATE DEGREE (E.G., PhD) | |
| 18–29 | 0 | 0 | 12 | 8 | 1 | 0 |
| 30–39 | 0 | 3 | 5 | 11 | 1 | 0 |
| 40–49 | 0 | 0 | 9 | 8 | 2 | 1 |
| 50–59 | 0 | 8 | 6 | 5 | 0 | 1 |
| 60–69 | 0 | 4 | 6 | 7 | 2 | 1 |
| 70–79 | 1 | 4 | 10 | 4 | 1 | 0 |
| Total | 1 | 19 | 48 | 43 | 7 | 3 |
Table 4
Experiment 2: Descriptive Statistics (means and standard deviations) of Properties of Target Words, Synonyms, and Foils.
| LENGTH | FREQUENCY (RAW COUNTS) | FREQUENCY (PER MILLION) | FREQUENCY (LOG-TRANSFORMED) | |
|---|---|---|---|---|
| Target | 8.4 (1.77) | 260.33 (1118.23) | 1.3 (5.55) | 3.02 (1.9) |
| Synonym | 7.77 (2.71) | 1184.77 (2476.69) | 5.88 (12.29) | 5.62 (1.95) |
| Foil | 7.41 (2.03) | 2304.08 (3704.84) | 11.44 (18.39) | 5.97 (1.97) |

Figure 3
Experiment 2: Example trial.
Table 5
Descriptive Statistics (means, standard deviations, minimums, and maximums) of Accuracy and Response Time for Each Age Band.
| AGE BAND | ACCURACY (%) | RESPONSE TIME (MS) | ||||||
|---|---|---|---|---|---|---|---|---|
| MEAN | SD | MIN | MAX | MEAN | SD | MIN | MAX | |
| 18–29 | 51.19 | 14.79 | 26.67 | 90.00 | 4385.80 | 1258.44 | 2580.94 | 7262.89 |
| 30–39 | 67.17 | 14.72 | 26.67 | 96.67 | 3902.85 | 786.70 | 2697.78 | 5612.14 |
| 40–49 | 64.48 | 16.16 | 42.86 | 96.67 | 4009.75 | 1147.89 | 2438.48 | 6548.14 |
| 50–59 | 61.83 | 15.65 | 30.00 | 96.67 | 4337.30 | 1020.83 | 2600.48 | 6073.26 |
| 60–69 | 76.50 | 14.73 | 53.33 | 100.00 | 3634.65 | 702.30 | 2619.40 | 5018.37 |
| 70–79 | 72.67 | 16.67 | 30.00 | 100.00 | 4077.52 | 896.66 | 2394.80 | 6127.77 |
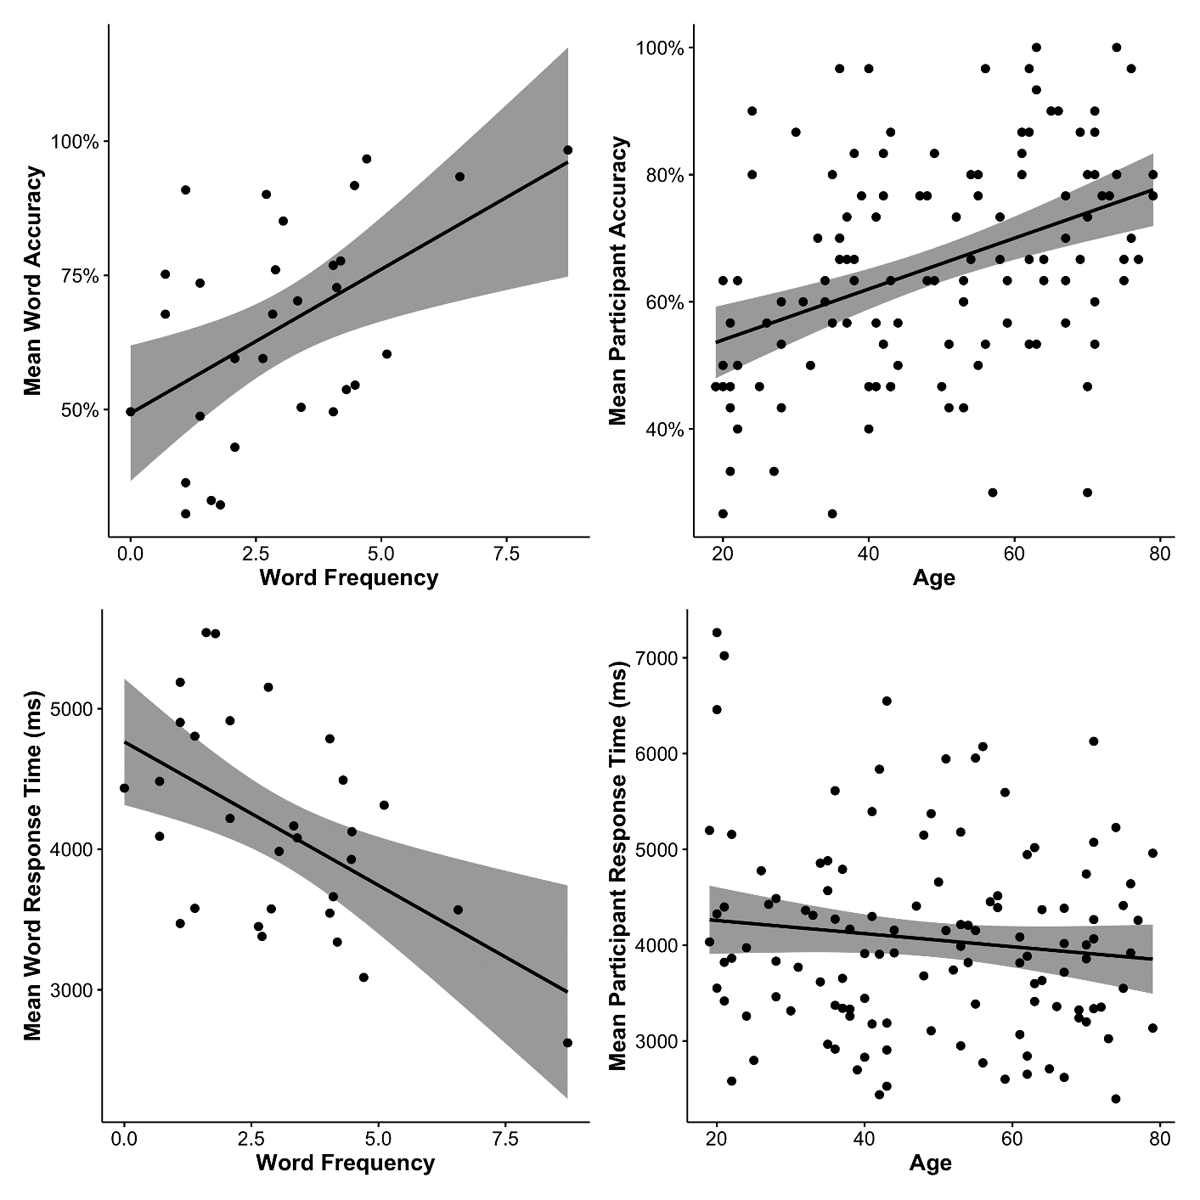
Figure 4
Scatter plots showing the relationships between task performances (accuracy rate; response time) and predictor variables (log-transformed word frequency; age by year). For both left-hand panels, each dot represents a target word. For both right-hand panels, each dot represents a participant. All panels were plotted with a linear regression line and 95% confidence interval (i.e., the shaded area).