
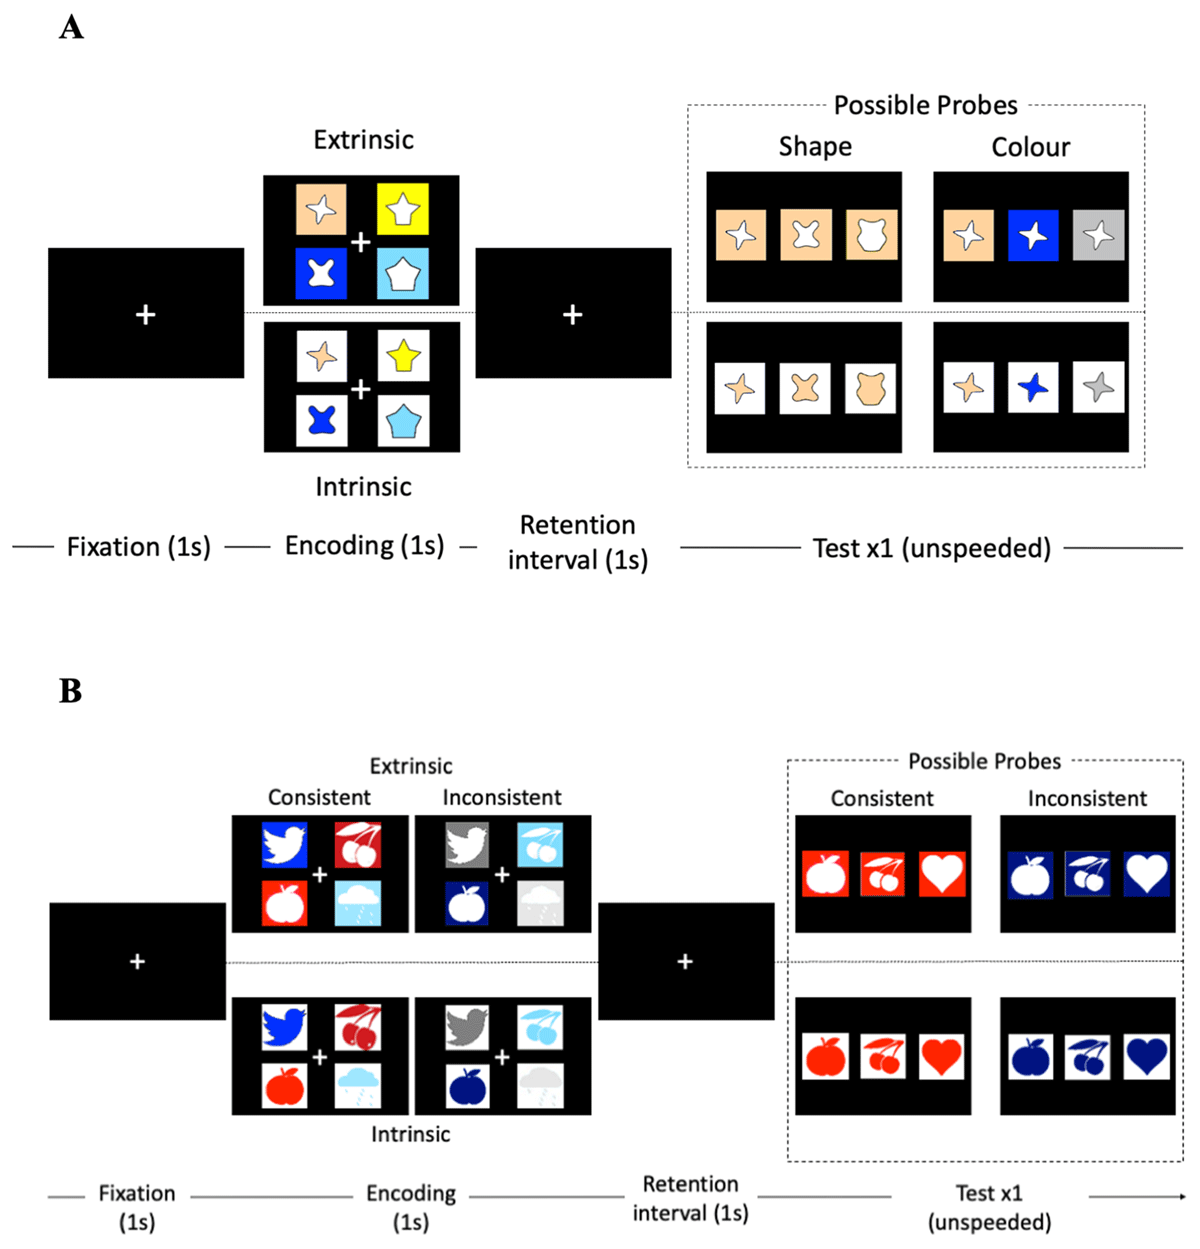
Figure 1
Schematic of the Task in Experiment 1 (Panel A) and 2 (Panel B).
Table 1
Sample Details and Exclusions.
| SAMPLE DETAILS | EXPERIMENT 1 | EXPERIMENT 2 | ||
|---|---|---|---|---|
| BRITISH | CHINESE | BRITISH | CHINESE | |
| Total N attempted | 70 | 82 | 49 | 77 |
| N failed to pass the colour blindness/ demographic screening phase | 3 | 2 | 5 | 0 |
| N excluded for pre-registered reasons: | 37 | 50 | 14 | 46 |
| 1. Technical issues | 0 | 0 | 0 | 0 |
| 2. Incomplete data (e.g., from quitting early) | 11 | 12 | 11 | 17 |
| 3. Mismatch of culture or place of birth | 26 | 18 | 2 | 6 |
| 4. Stayed outside their birth country for more than 3 years | 0 | 20 | 1 | 23 |
| Final N for analysis after pre-registered exclusions | 30 | 30 | 30 | 30 |
| Mean age (SD) | 20.33 (2.41) | 27.00 (4.90) | 26.63 (4.22) | 27.03 (4.58) |
| Gender: Male/Female/Prefer not to say | 6/23/1 | 6/24/0 | 14/15/1 | 6/25/0 |
| Mean number of years lived outside of home country (SD) | 0.00 (0.00) | 1.73 (0.81) | 0.00 (0.00) | 0.97 (1.00) |
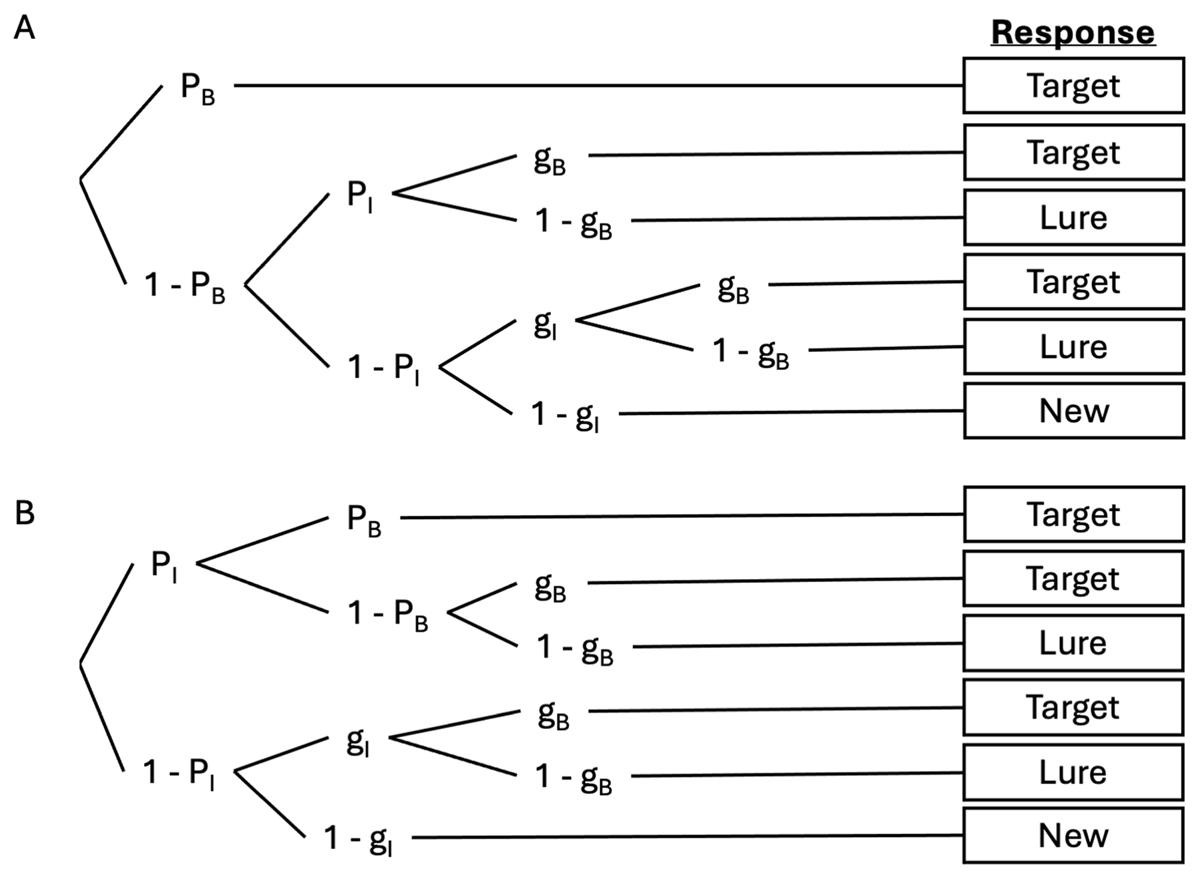
Figure 2
Multinomial processing tree (MPT) model, showing the independence model (Panel A) and dependence model (Panel B). The parameters shown represent the probability of binding memory (PB) and item memory (PI), and associated probabilities for guessing (gB, gI).
Table 2
Penalised Deviance of the Dependence and Independence Models for Both Cultural Groups in Experiments 1 and 2.
| MODEL | BRITISH | CHINESE | |
|---|---|---|---|
| Experiment 1 | Dependence | 1305 | 1306 |
| Independence | 1303 | 1311 | |
| Experiment 2 | Dependence | 1283 | 1316 |
| Independence | 1289 | 1319 |
Table 3
Mean Posterior Estimates and Differences for the Binding Memory Parameter (Pb) [and 95% Bayesian Credibility Intervals (CI)] as a Function of Cultural Group and Binding Condition in Experiment 1.
| CULTURAL GROUP | ||||||||
|---|---|---|---|---|---|---|---|---|
| BRITISH | CHINESE | CULTURAL DIFFERENCE | ||||||
| BINDING | CONDITION | MEAN | 95% CI | MEAN | 95% CI | MEAN | 95% CI | |
| Dependence model | Extrinsic | Colour | 0.287 | [0.166, 0.407] | 0.412 | [0.303, 0.518] | 0.073 | [–0.239, 0.498] |
| Shape | 0.605 | [0.490, 0.711] | 0.731 | [0.590, 0.870] | –0.006 | [–0.457, 0.351] | ||
| Intrinsic | Colour | 0.373 | [0.282, 0.457] | 0.398 | [0.263, 0.527] | –0.074 | [–0.304, 0.177] | |
| Shape | 0.809 | [0.631, 0.954] | 0.718 | [0.570, 0.855] | –0.334 | [–0.726, 0.078] | ||
| Binding difference | Colour | –0.084 | [–0.200, 0.029] | 0.064 | [–0.296, 0.499] | |||
| Shape | –0.203 | [–0.358, –0.038] | 0.125 | [–0.387, 0.603] | ||||
| Independence model | Extrinsic | Colour | 0.243 | [0.157, 0.330] | 0.332 | [0.240, 0.430] | 0.064 | [–0.143, 0.286] |
| Shape | 0.343 | [0.266, 0.417] | 0.393 | [0.317, 0.469] | 0.020 | [–0.174, 0.230] | ||
| Intrinsic | Colour | 0.304 | [0.224, 0.381] | 0.331 | [0.218, 0.452] | –0.033 | [–0.275, 0.305] | |
| Shape | 0.402 | [0.319, 0.481] | 0.406 | [0.331, 0.481] | –0.040 | [–0.276, 0.223] | ||
| Binding difference | Colour | –0.032 | [–0.165, 0.099] | 0.064 | [–0.279, 0.335] | |||
| Shape | –0.077 | [–0.181, 0.027] | –0.017 | [–0.288, 0.237] | ||||
Table 4
Mean Posterior Estimates and Differences for the Binding Memory Parameter (Pb) [and 95% Bayesian Credibility Intervals (CI)] as a Function of Cultural Group, Binding Condition, and Prior Knowledge in Experiment 2.
| CULTURAL GROUP | ||||||||
|---|---|---|---|---|---|---|---|---|
| BRITISH | CHINESE | CULTURAL DIFFERENCE | ||||||
| BINDING | CONDITION | MEAN | 95% CI | MEAN | 95% CI | MEAN | 95% CI | |
| Dependence model | Extrinsic | Consistent | 0.392 | [0.218, 0.570] | 0.292 | [0.079, 0.562] | 0.015 | [–0.421, 0.564] |
| Inconsistent | 0.305 | [0.164, 0.449] | 0.369 | [0.178, 0.585] | 0.104 | [–0.315, 0.638] | ||
| Prior Knowledge Benefit | 0.086 | [–0.055, 0.225] | –0.003 | [–0.687, 0.689] | ||||
| Intrinsic | Consistent | 0.394 | [0.238, 0.551] | 0.445 | [0.214, 0.684] | 0.106 | [–0.388, 0.605] | |
| Inconsistent | 0.300 | [0.162, 0.440] | 0.371 | [0.121, 0.662] | 0.168 | [–0.303, 0.688] | ||
| Prior Knowledge Benefit | 0.092 | [–0.043, 0.226] | 0.030 | [–0.707, 0.738] | ||||
| Binding difference | Consistent | –0.003 | [–0.139, 0.133] | –0.094 | [–0.759, 0.630] | |||
| Inconsistent | 0.003 | [–0.131, 0.139] | –0.061 | [–0.754, 0.659] | ||||
| Independence model | Extrinsic | Consistent | 0.279 | [0.170, 0.389] | 0.219 | [0.104, 0.345] | 0.094 | [–0.291, 0.632] |
| Inconsistent | 0.223 | [0.139, 0.307] | 0.244 | [0.144, 0.351] | 0.157 | [–0.222, 0.689] | ||
| Prior Knowledge Benefit | 0.058 | [–0.033, 0.146] | –0.004 | [–0.657, 0.653] | ||||
| Intrinsic | Consistent | 0.299 | [0.187, 0.412] | 0.304 | [0.160, 0.449] | 0.089 | [–0.303, 0.605] | |
| Inconsistent | 0.221 | [0.126, 0.317] | 0.253 | [0.127, 0.395] | 0.145 | [–0.228, 0.694] | ||
| Prior Knowledge Benefit | 0.079 | [–0.012, 0.169] | 0.023 | [–0.651, 0.662] | ||||
| Binding difference | Consistent | –0.020 | [–0.110, 0.069] | –0.015 | [–0.655, 0.649] | |||
| Inconsistent | 0.000 | [–0.084, 0.088] | 0.012 | [–0.670, 0.692] | ||||
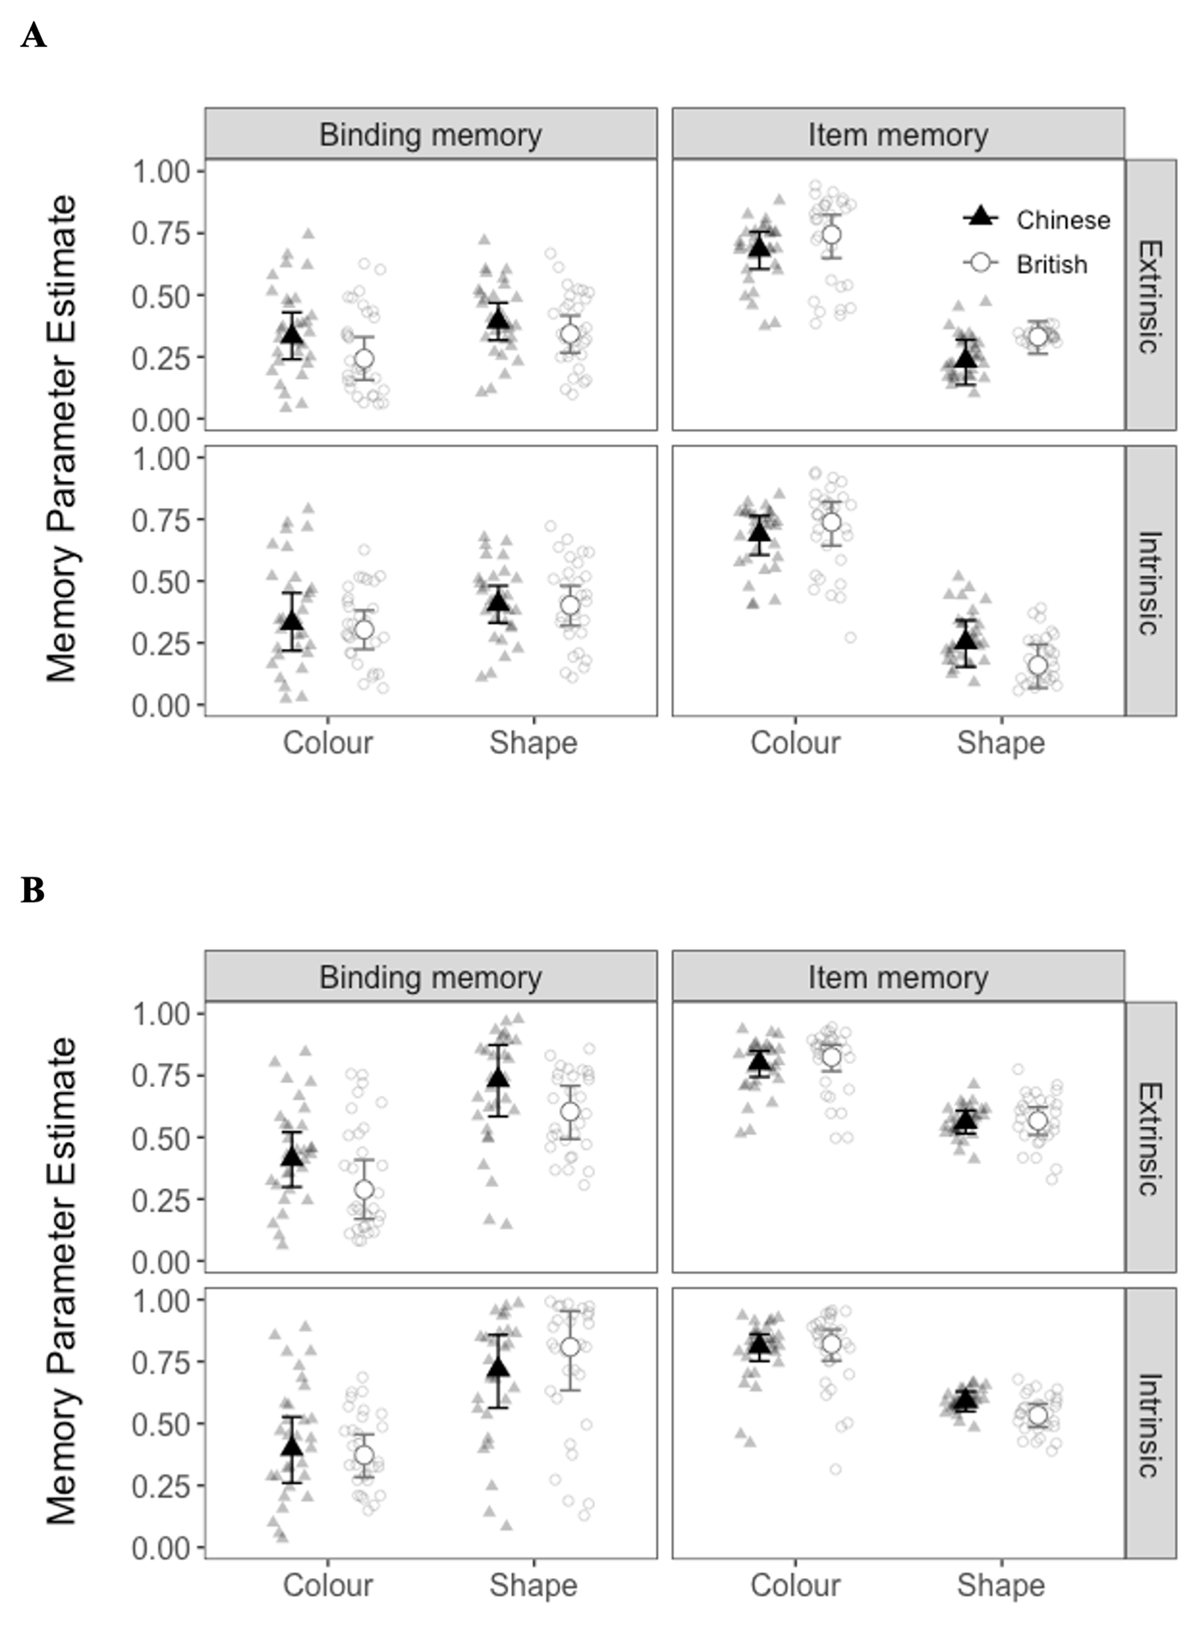
Figure 3
Memory Parameter Estimates for the (A) Independence Model and (B) Dependence Model for Each Cultural Group and Binding Condition in Experiment 1.
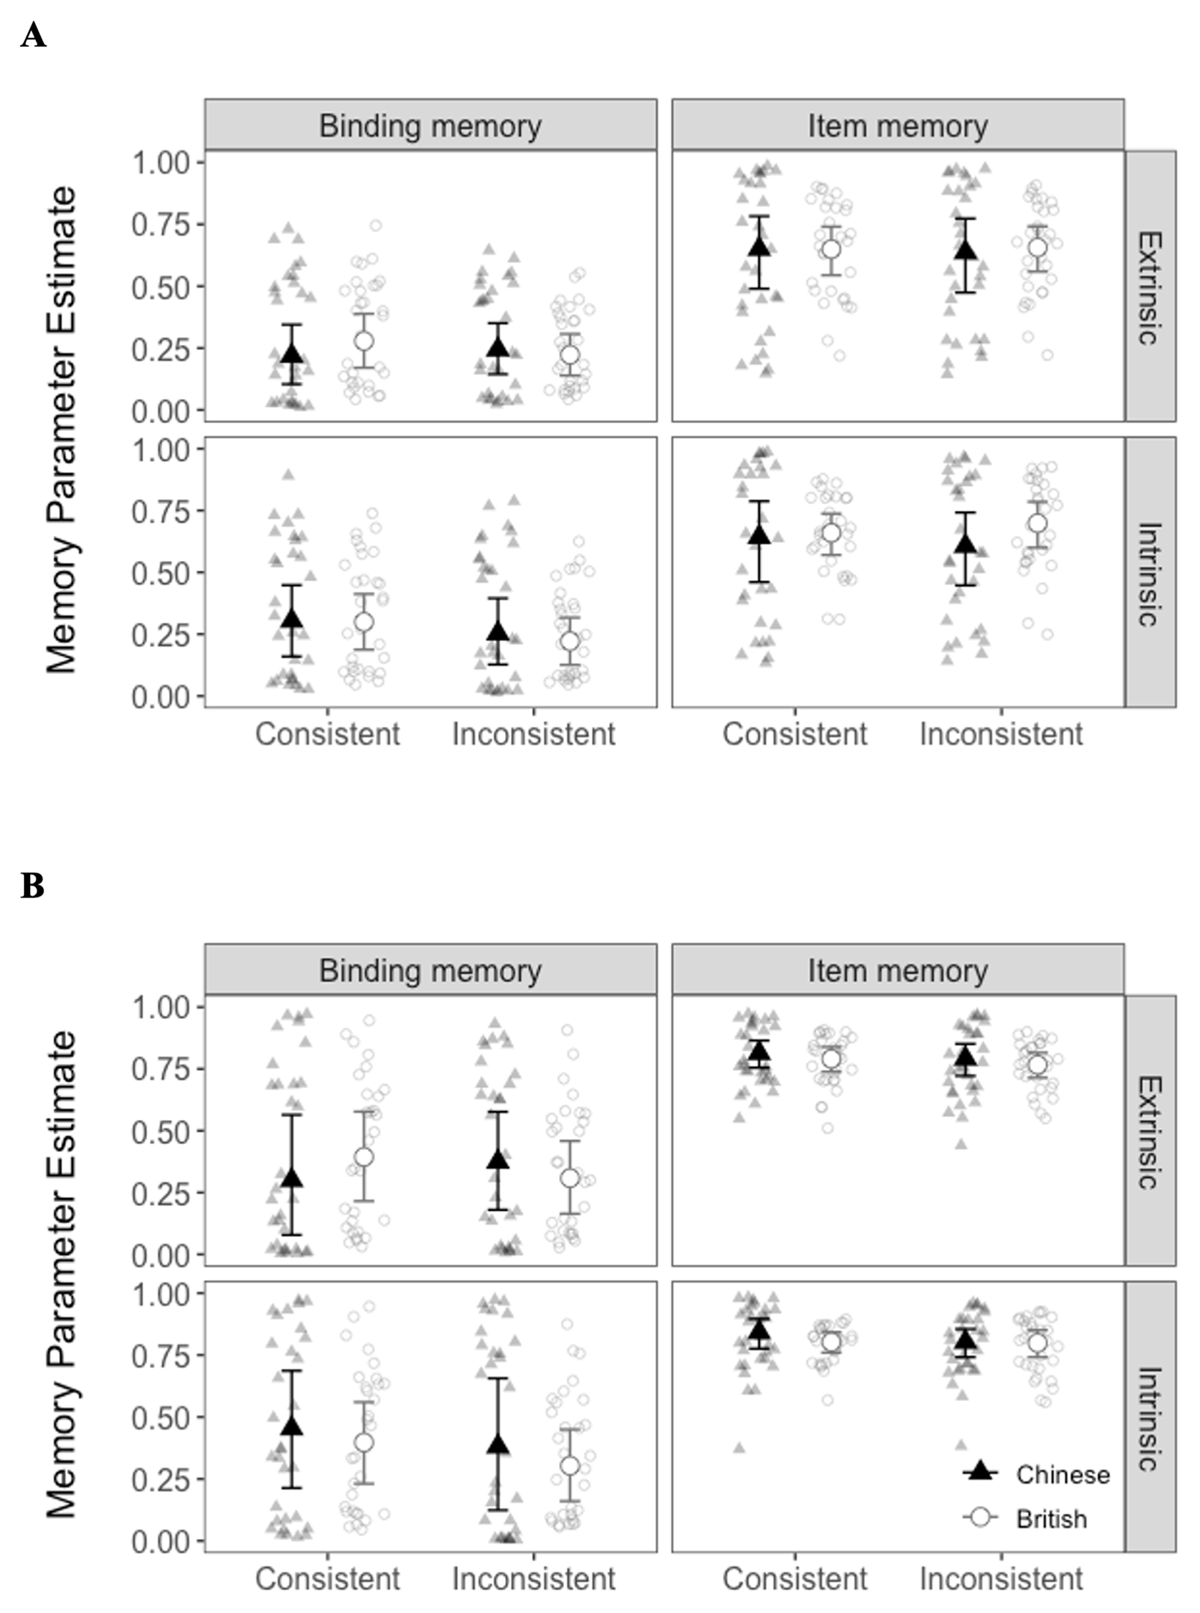
Figure 4
Memory Parameter Estimates for the (A) Independence Model and (B) Dependence Model for Each Cultural Group and Binding Condition in Experiment 2.