
Table 1
Descriptive statistics of participants’ age and sample size per clock-speed condition.
| EXPERIMENTAL CONDITION | EXPERIMENT 1 (LAB.) | EXPERIMENT 2 (ONLINE) | ||||
|---|---|---|---|---|---|---|
| AGE | N | AGE | N | |||
| M | SD | M | SD | |||
| faster | 23.4 | 4.28 | 27 | 28.7 | 4.92 | 36 |
| slower | 23.0 | 4.30 | 37 | 26.4 | 4.94 | 39 |
| control | 26.4 | 3.79 | 39 | |||
Table 2
Descriptive statistics (Experiment 1).
| EXPERIMENTAL CONDITION | RATE OF TBPM TASK COMPLETION (%) | TIMING ERROR OF PM RESPONSES (SECONDS) | MONITORING OVER TIME | ||||||||||
|---|---|---|---|---|---|---|---|---|---|---|---|---|---|
| FIRST TBPM BLOCK | SECOND TBPM BLOCK | FIRST TBPM BLOCK | SECOND TBPM BLOCK | FIRST TBPM BLOCK | SECOND TBPM BLOCK | ||||||||
| t1 | t2 | t3 | t4 | t1 | t2 | t3 | t4 | ||||||
| M | faster | 95.60 | 90.40 | 6.82 | 9.73 | 0.45 | 0.66 | 0.83 | 2.24 | 0.30 | 0.62 | 0.83 | 2.01 |
| slower | 85.80 | 90.50 | 2.83 | –3.60 | 0.66 | 0.97 | 1.20 | 2.34 | 0.76 | 1.23 | 1.48 | 2.92 | |
| SD | faster | 8.47 | 12.90 | 15.50 | 14.60 | 0.48 | 0.64 | 0.54 | 1.39 | 0.27 | 0.75 | 0.58 | 1.28 |
| slower | 18.00 | 12.90 | 14.30 | 15.90 | 0.80 | 1.48 | 1.52 | 1.74 | 1.77 | 1.88 | 1.80 | 2.22 | |
[i] Note. Mean and standard deviation for both the prospective memory task performance and time monitoring at Experiment 1 as a function of clock-speed condition (faster vs. slower) and task’s block (First vs. Second). Time-based prospective memory performance is reported as rate of prospective memory tasks completed (in percentage) and as timing error (i.e., as mean response deviation of the prospective response from the target time, in seconds; maximum accuracy = 0; positive values indicate later prospective memory responses; negative values indicate earlier prospective memory responses). Time monitoring is represented as mean clock check frequency in both time-based prospective memory blocks over time (minute 1 vs. minute 2 v. minute 3 vs. minute 4). TBPM: time-based prospective memory; t1: minute 1; t2: minute 2; t3: minute 3; t4: minute 4.
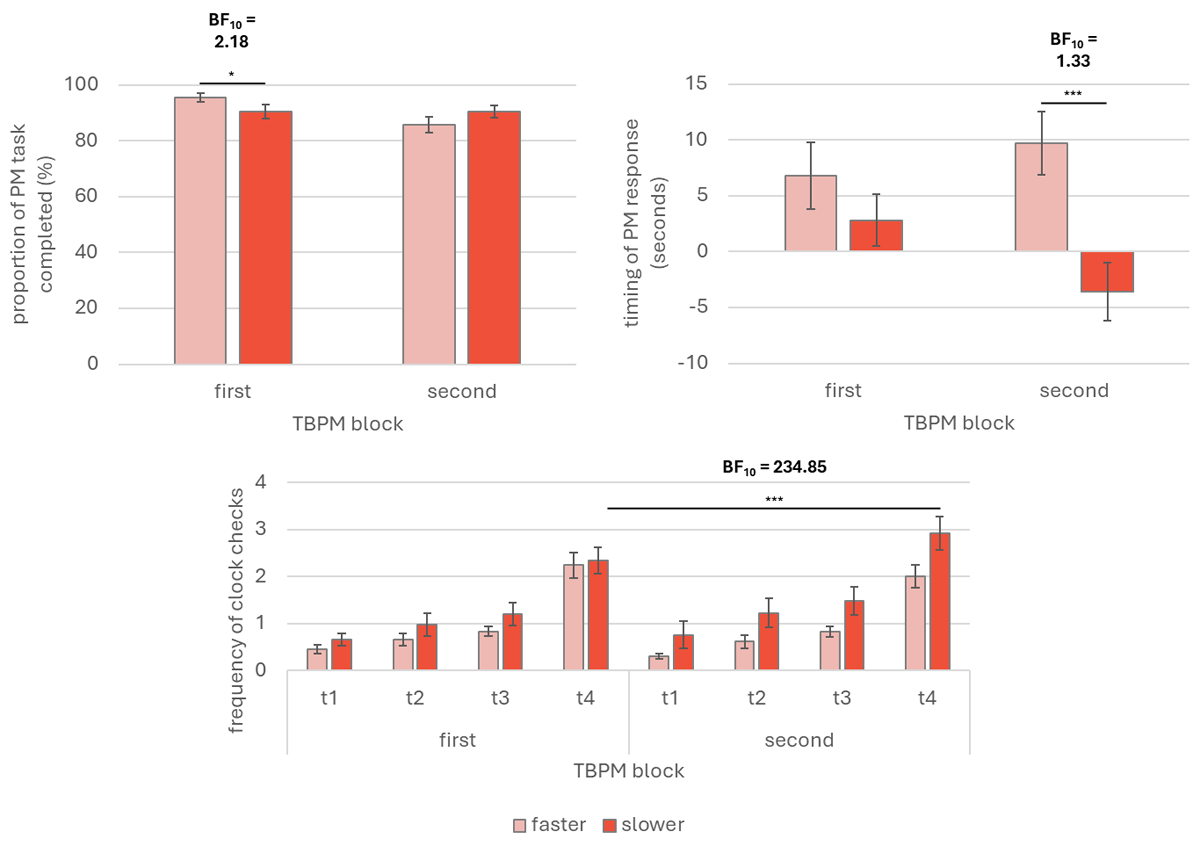
Figure 1
Prospective memory performance and time monitoring (Experiment 1).
Note. Graphical representations of time-based prospective memory performance and time monitoring from Experiment 1. The upper left panel depicts the prospective memory performance as proportion of completed tasks, regardless of the response’s timing. The right upper panel depicts the timing error of the prospective memory responses, as deviation from the target time (in seconds; maximum accuracy = 0; positive values indicate later prospective memory responses; negative values indicate earlier prospective memory responses). The lower panels depict time monitoring as mean frequency of clock checks over time per time-based prospective memory blocks. PM: prospective memory; TBPM: time-based prospective memory; First TBPM block: prospective memory task without clock-speed manipulation; Second TBPM block: prospective memory task with clock-speed manipulation; t1 = minute 1; t2 = minute 2; t3 = minute 3; t4 = minute 4. Error bars indicate standard error of the means. * p < 0.05 ** p < 0.01.
Table 3
Descriptive statistics (Experiment 2).
| EXPERIMENTAL CONDITION | PROPORTION OF TBPM TASK COMPLETION | TIMING ERROR OF PM RESPONSES (SECONDS) | MONITORING OVER TIME | ||||||||||
|---|---|---|---|---|---|---|---|---|---|---|---|---|---|
| FIRST TBPM BLOCK | SECOND TBPM BLOCK | FIRST TBPM BLOCK | SECOND TBPM BLOCK | FIRST TBPM BLOCK | SECOND TBPM BLOCK | ||||||||
| t1 | t2 | t3 | t4 | t1 | t2 | t3 | t4 | ||||||
| M | faster | 95.83 | 96.53 | 1.38 | 4.99 | 1.08 | 1.38 | 1.78 | 4.07 | 0.94 | 1.45 | 1.84 | 3.55 |
| slower | 98.72 | 98.72 | 2.50 | 1.60 | 1.67 | 2.22 | 2.12 | 5.13 | 1.58 | 1.99 | 2.79 | 6.35 | |
| control | 96.15 | 98.08 | 2.22 | 2.60 | 1.46 | 1.54 | 1.92 | 4.71 | 1.38 | 1.80 | 2.39 | 5.14 | |
| SD | faster | 14.02 | 8.77 | 5.45 | 11.62 | 0.80 | 0.96 | 1.04 | 2.19 | 0.83 | 0.90 | 1.12 | 1.50 |
| slower | 8.01 | 5.59 | 3.39 | 3.50 | 1.41 | 2.30 | 1.19 | 2.50 | 1.18 | 1.29 | 1.68 | 2.29 | |
| control | 13.50 | 6.75 | 1.90 | 1.83 | 1.23 | 1.35 | 1.35 | 2.32 | 1.57 | 2.01 | 1.98 | 2.14 | |
[i] Note. Mean and standard deviation for both the prospective memory task performance and time monitoring at Experiment 2 as a function of clock-speed condition (faster vs. slower) and task’s block (First vs. Second). Time-based prospective memory performance is reported as rate of prospective memory tasks completed (in percentage) and as timing error (i.e., as mean response deviation of the prospective response from the target time, in seconds; maximum accuracy = 0; positive values indicate later prospective memory responses; negative values indicate earlier prospective memory responses). Time monitoring is represented as mean clock check frequency in both time-based prospective memory blocks over time (minute 1 vs. minute 2 v. minute 3 vs. minute 4). TBPM: time-based prospective memory; t1: minute 1; t2: minute 2; t3: minute 3; t4: minute 4.
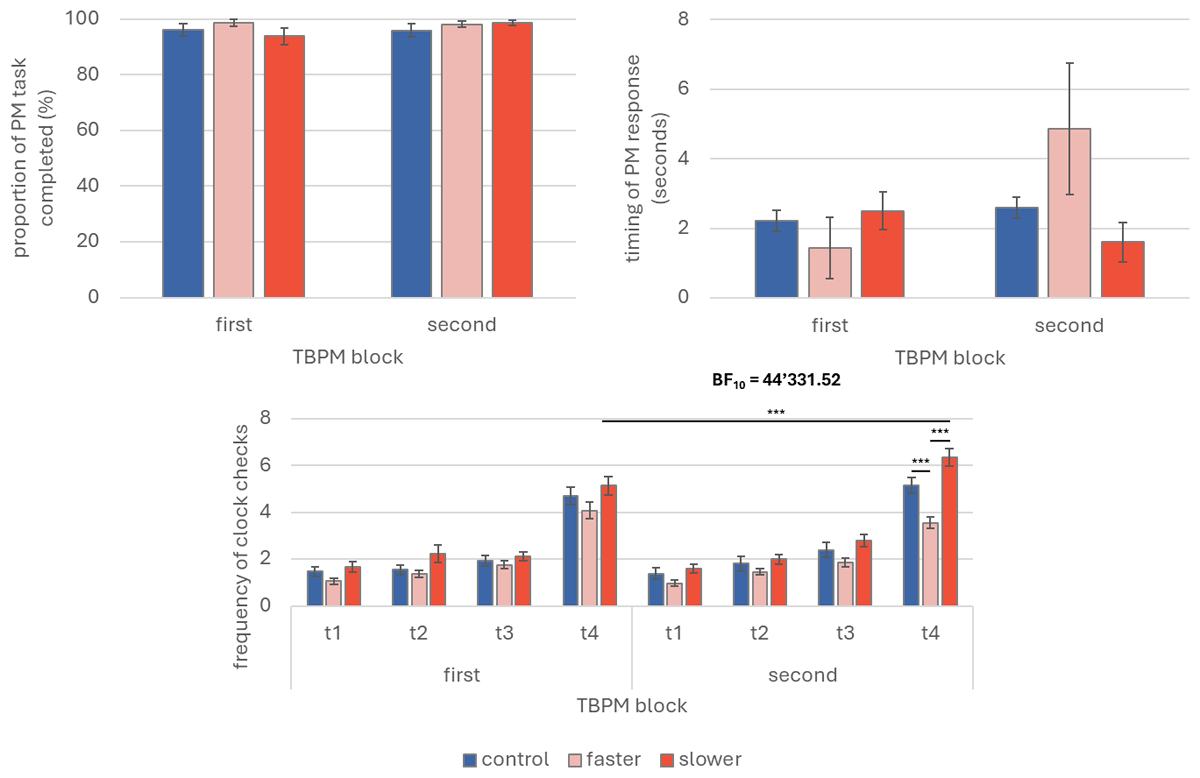
Figure 2
Prospective memory performance and time monitoring (Experiment 2).
Note. Graphical representations of time-based prospective memory performance and time monitoring from Experiment 2. The upper left panel depicts the prospective memory performance as proportion of completed tasks, regardless of the response’s timing. The right upper panel depicts the timing error of the prospective memory responses, as deviation from the target time (in seconds; maximum accuracy = 0; positive values indicate later prospective memory responses; negative values indicate earlier prospective memory responses). The lower panels depict time monitoring as mean frequency of clock checks over time per time-based prospective memory blocks. PM: prospective memory; TBPM: time-based prospective memory; First TBPM block: prospective memory task without clock-speed manipulation; Second TBPM block: prospective memory task with clock-speed manipulation; t1 = minute 1; t2 = minute 2; t3 = minute 3; t4 = minute 4. * p < 0.05 ** p < 0.01.