

Figure 1
Trial structure of the instructed visual-search task used in Experiment 1. Participants’ task was to move their eyes to the diamond target as quickly and directly as possible to earn points (and money). The colour of the distractor (blue or orange; counterbalanced) signalled whether 500 or 10 points were available, but reward was omitted if participants looked at the distractor. The search display was preceded by an instruction screen either informing the participant of the upcoming distractor colour (‘informative trials’) or with a generic instruction that the trial was about to start (‘general trials’).

Figure 2
Performance in Experiment 1 A. Proportion of omission trials is shown as a function of instruction type (informative or general) and distractor type (high-reward or low-reward distractor). Omission trials are those where participants’ gaze was registered on the distractor leading to omission of reward. B. The value-modulated attentional capture effect (difference in proportion of omissions on high-reward relative to low-reward trials) is shown separately for trials with informative instructions as to the upcoming distractor colour (‘Info’ trials) and trials with a generic message that the trial was going to begin (‘Gen’ trials). C. Proportion of omission trials across blocks. Error bars represent within-subject SEM (Cousineau, 2005; Morey, 2008). ** = p < 0.01.
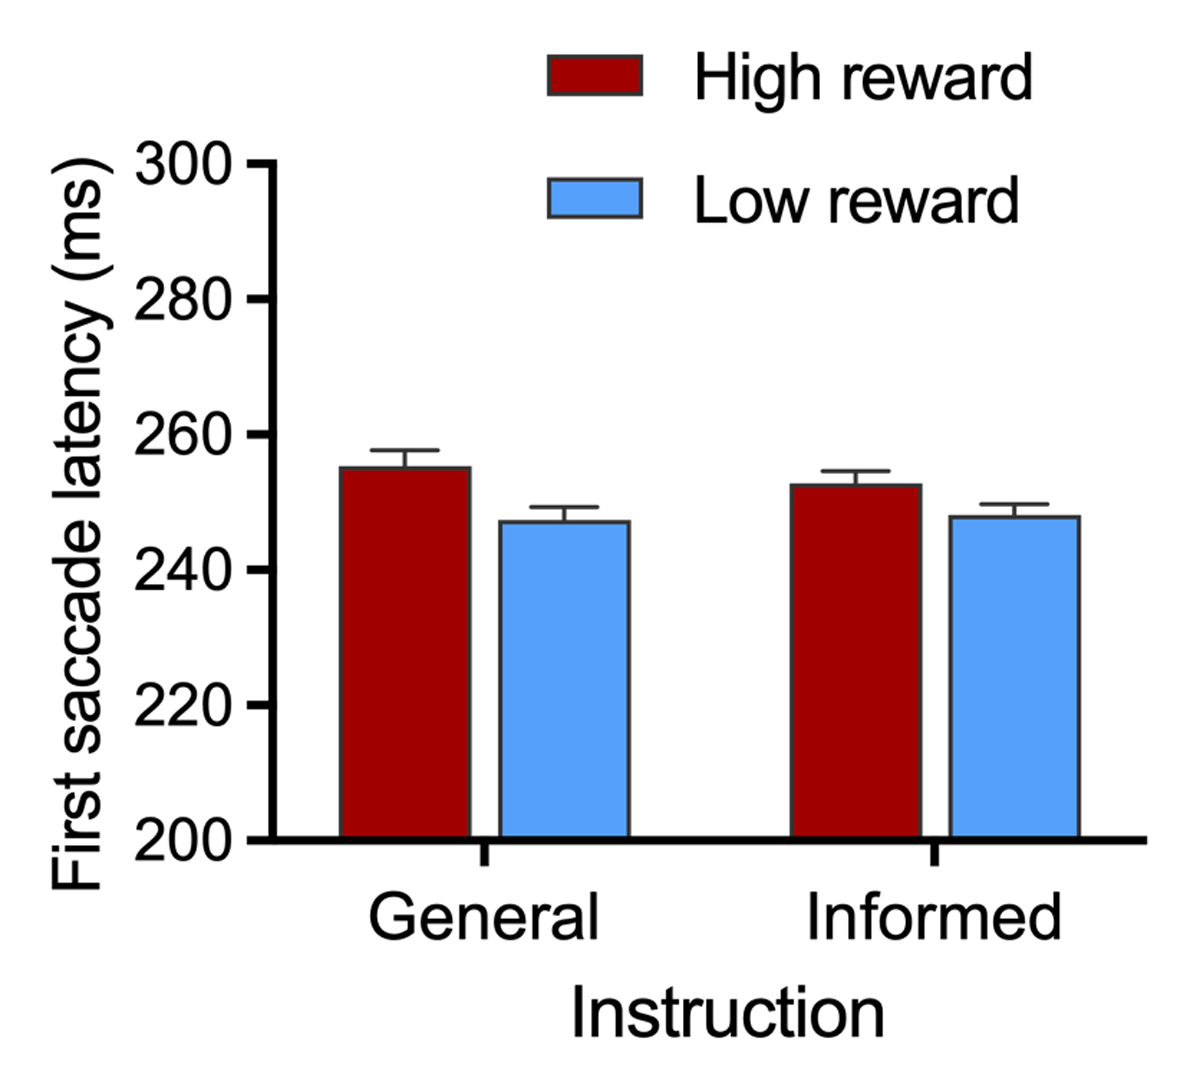
Figure 3
First Saccade latencies to target in Experiment 1. Trials where participants correctly identified the target without gaze being first registered on the distractor are shown as a function of instruction type (informative or general) and distractor type (high-reward or low-reward distractor). Error bars represent within-subject SEM (Cousineau, 2005) with Morey (2008) correction.
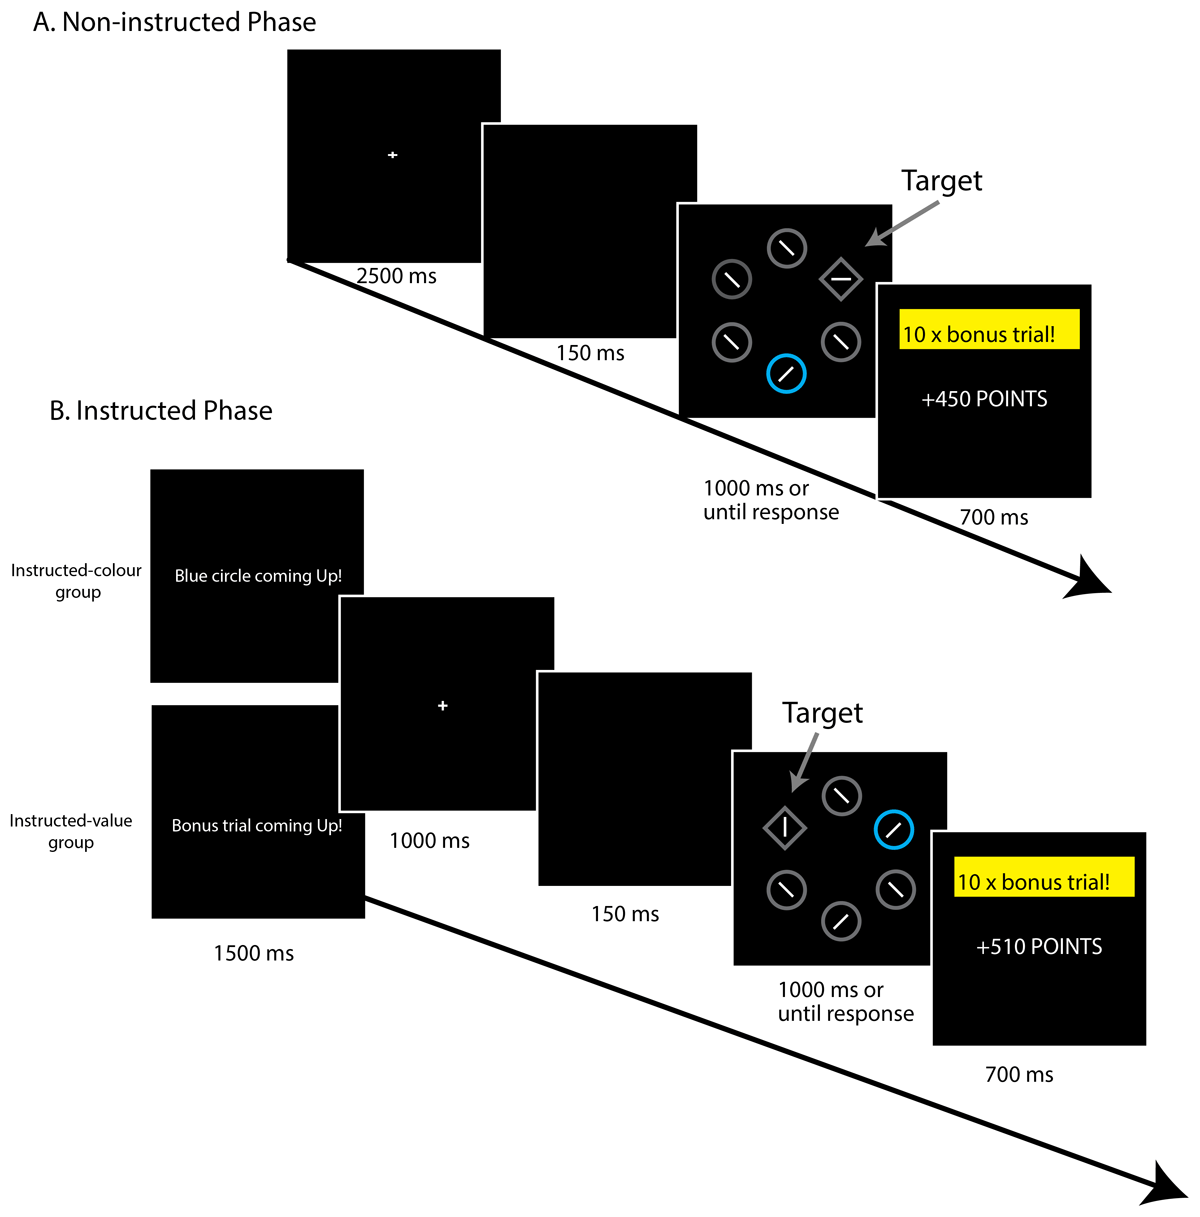
Figure 4
Trial structure during the RT version of the VMAC task used in Experiment 2. Participants’ task was to respond to the orientation of the line within the diamond. Faster responses earned more points with the colour of the distractor (blue or orange, counterbalanced) signalling whether points would be multiplied by 10 (bonus trials) or not (no-bonus trials). Participants first completed eight blocks of non-instructed trials (A) before completing five blocks of instructed trials (B) On instructed trials, the trial began with an instruction screen with a generic instruction that the trial was about to start ‘general trials’ or with an instruction informing the participant about the upcoming distractor ‘informative trials’. Participants in the instructed-colour group were informed about the upcoming distractor on informative trials whereas those in the instructed-value group were informed about whether the upcoming trial was a high-reward (bonus) trial or not.

Figure 5
Performance during the non-instructed phase of Experiment 2 as a function of distractor type (high reward vs low reward). Data shown separately for the instructed-colour and instructed-value groups. Left Panel. RT on correct trials. Right Panel. Error rates. Error bars represent SEM.

Figure 6
Performance during the instructed phase of Experiment 2 as a function of instruction type (informative or generic) and distractor type (high-reward distractor and low-reward distractor), shown separately for participants in the informed-colour group (left panel) and the informed-value group (right panel). A. RT for correct responses. B. Error rates. Error bars represent SEM.

Figure 7
Performance during the non-instructed phase of Experiment 3 on both high reward, low reward and baseline trials (all shapes rendered in grey). Left Panel. RT for correct responses. Right Panel. Error rates. Error bars represent within-subject SEM (Cousineau, 2005) with Morey (2008) correction.
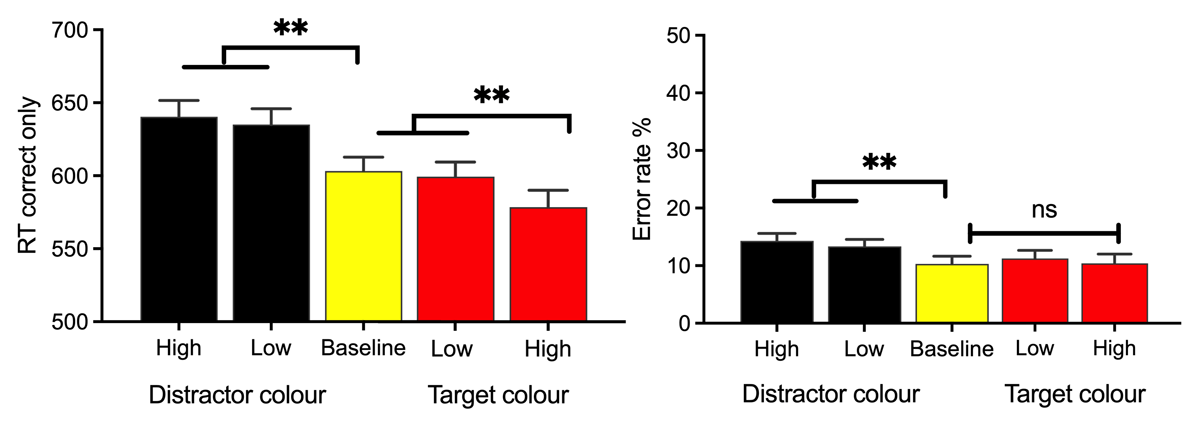
Figure 8
Performance during the instructed phase of Experiment 3. Trials where the distractor appeared in the cued colour (high reward or low reward) are depicted in black. Trials where the target unexpectedly appeared in the cued colour (High reward or Low reward) are depicted in red. Performance on baseline trials where all shapes were rendered in grey (yellow bar) was included in both analyses. Left Panel. RT for correct responses. Right Panel. Error rates. Error bars represent within-subject SEM (Cousineau, 2005) with Morey (2008) correction. ** p < .001.