
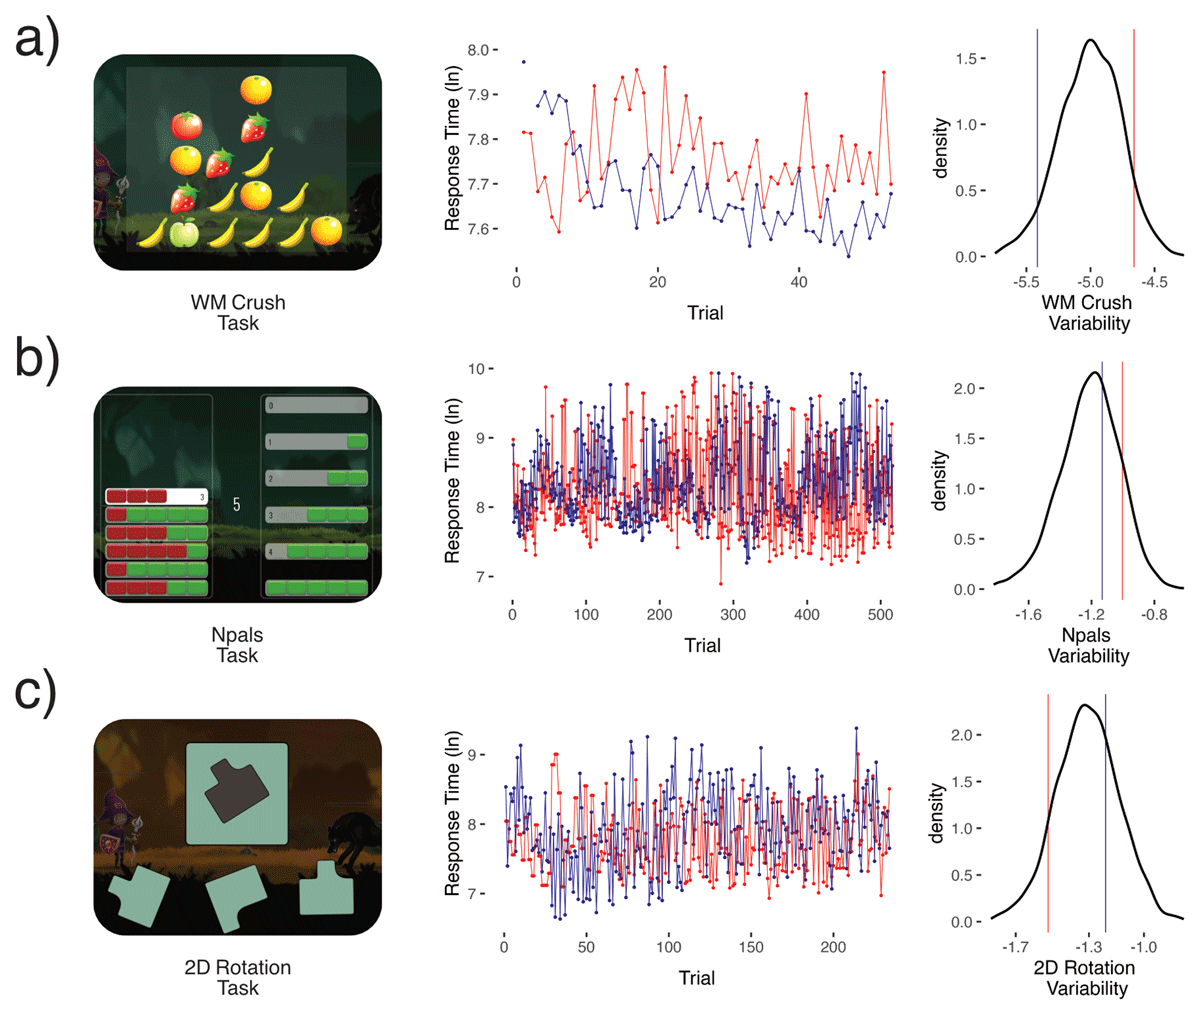
Figure 1
Shows three of the eleven cognitive tasks used a) visuospatial working memory crush, b) Number pals, and c) a 2D Mental Rotation task. For illustration purposes we randomly sampled one subject from the bottom 10% of the WM Crush variability distribution (in blue), and one subject from the top 10% (in red). The same subjects were then plotted for b) number pals and c) 2D Mental Rotation. We then plotted their logged response times by trial number, limiting the x-axis to the sample mean trial number of that task. Next, density plots show the distribution of our measures of cognitive variability factor scores extracted from dynamic SEM and the relative position of the two subjects (blue & red). Cognitive variability is modeled using a log-linear model, to preclude negative values. Note, however, that the logarithm of the variance can be negative as seen in the x-axis of the density plot.
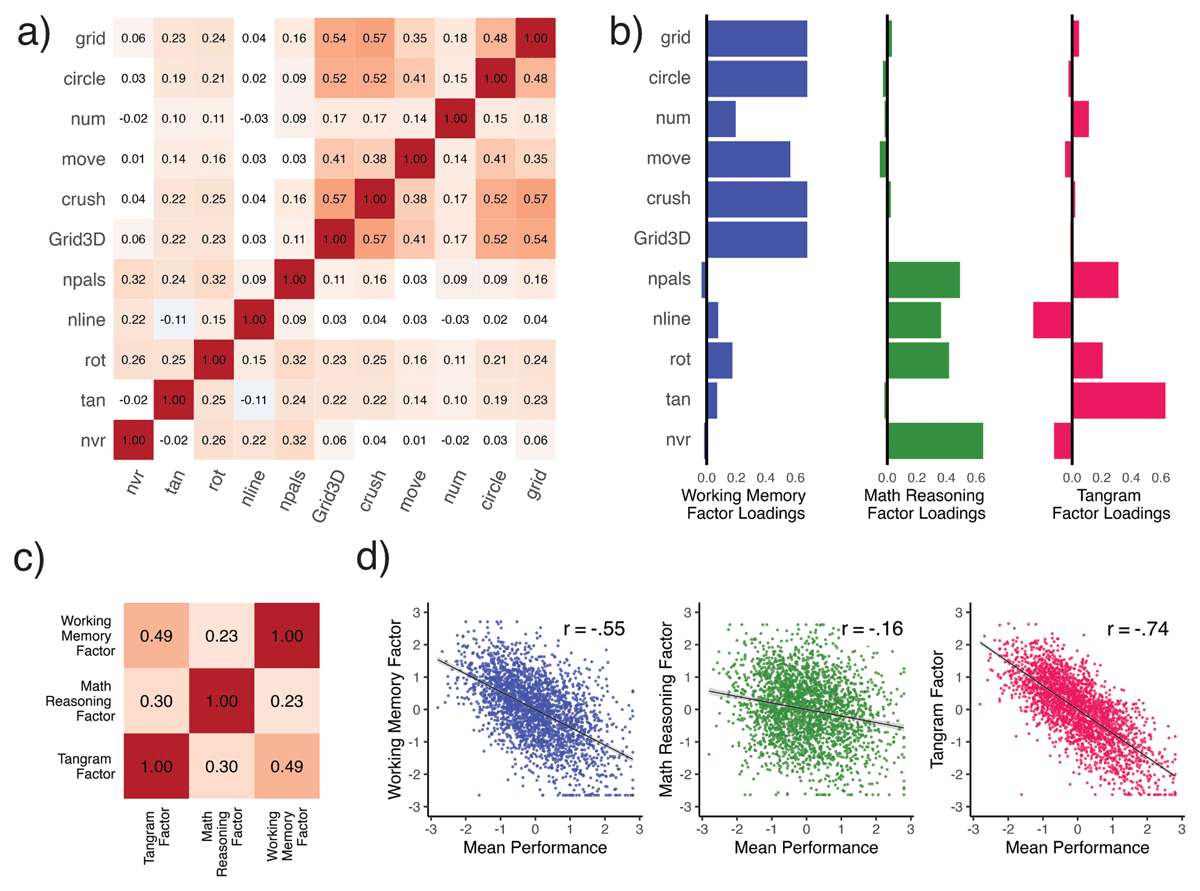
Figure 2
Illustrates interindividual variability measures (n = 2,608) in response time from Dynamic SEM across 11 cognitive tasks. Panel a) shows a Pearson r correlation plot with only significant (Holm’s multiple comparison correction) associations colored, while panel b) shows the loadings (SI Table 4) for the first three factors in an exploratory factor analysis. The first factor (‘Working Memory’) captured 22% of the variance, the second (‘Mathematical Reasoning’) accounted for 9%, while the last (‘Tangram’) accounted for 6% of the variance. Panel c) shows the correlations between these three factors while d) illustrates the relationship of each variability factor with a single factor of mean level (i.e., Mean Performance).
Table 1
Task Overview – number of trials and response time (RT) descriptives.
| TASK | TOTAL TRIALS | MEDIAN TRIALS PER CHILD | RT MEDIAN | RT IQR | RT MIN | RT MAX |
|---|---|---|---|---|---|---|
| WM_3dgrid (3DGrid) | 203738 | 78.12 | 7502.75 | 1502.50 | 4088.0 | 12344.00 |
| WM_circle (circle) | 155878 | 59.77 | 7604.50 | 1406.62 | 4125.0 | 13004.00 |
| WM_crush (crush) | 243511 | 93.37 | 7356.75 | 1547.50 | 4100.0 | 10830.00 |
| WM_grid (grid) | 430708 | 165.15 | 7868.00 | 1319.00 | 3798.0 | 15205.00 |
| WM_moving (move) | 85640 | 33.34 | 7508.00 | 1471.50 | 4149.0 | 12348.50 |
| WM_numbers (num) | 98300 | 37.94 | 8017.00 | 1405.00 | 5754.0 | 23362.50 |
| Number pals (npals) | 2398463 | 919.66 | 3659.50 | 640.25 | 1846.0 | 8139.00 |
| Numberline (nline) | 1833909 | 703.19 | 6102.50 | 2201.38 | 2617.0 | 15905.00 |
| Non-verbal reasoning (nvr) | 548101 | 210.16 | 6780.75 | 1655.25 | 4088.0 | 12344.00 |
| Rotation (rot) | 1032751 | 395.99 | 3420.75 | 1118.38 | 4125.0 | 13004.00 |
| Tangram (tan) | 173128 | 66.38 | 7502.75 | 1502.50 | 4100.0 | 10830.00 |