
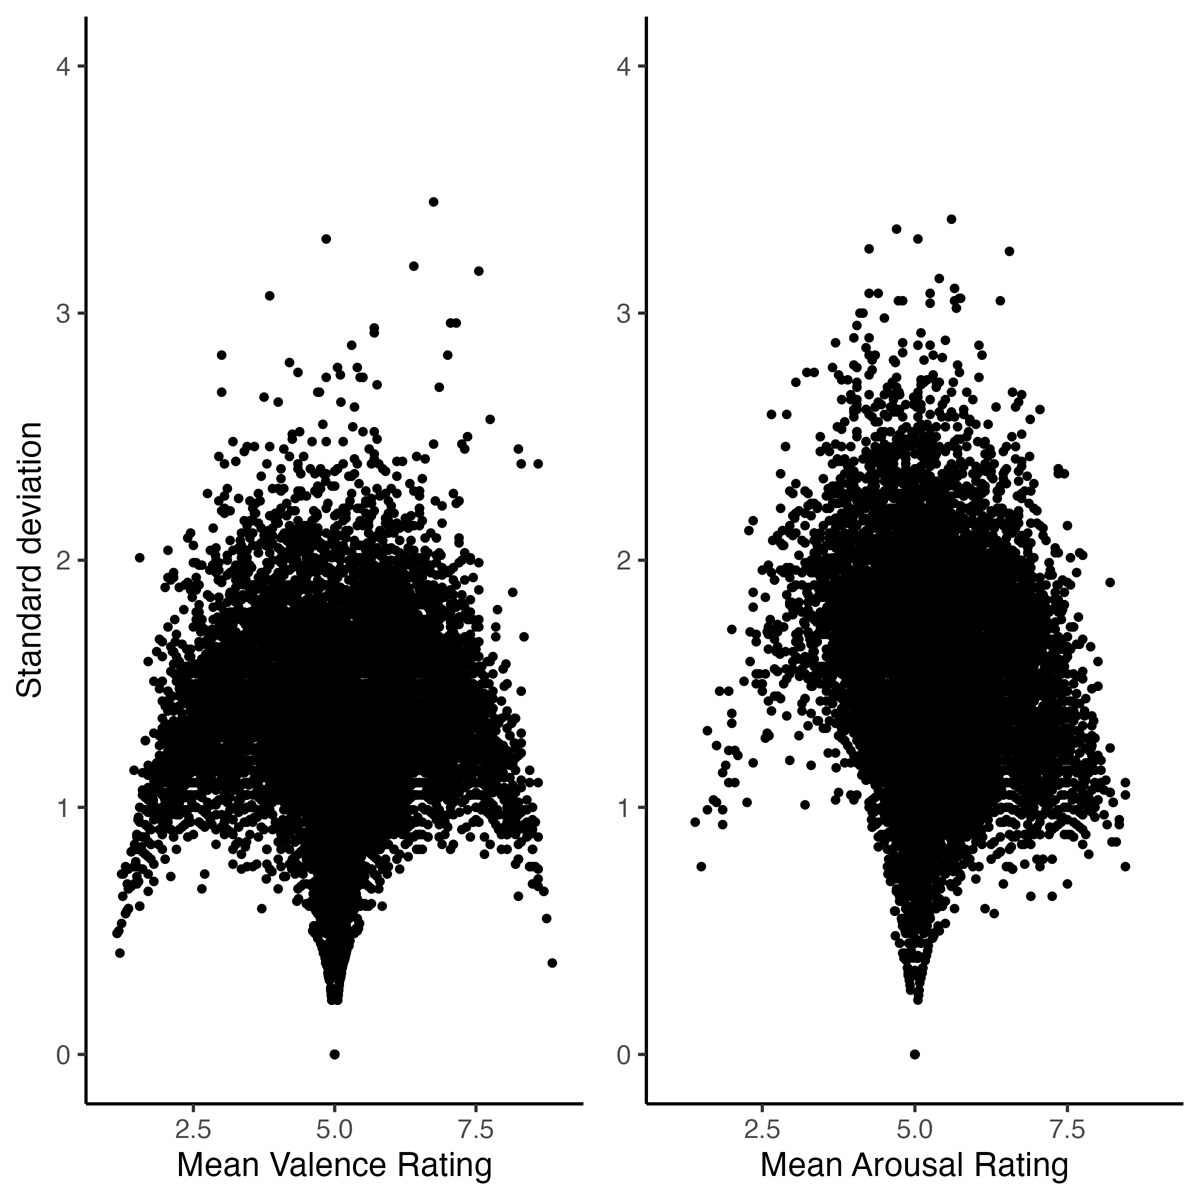
Figure 1
Valence and arousal ratings agreement in the Stadthagen-Gonzalez et al. norms (N = 14,028).
Table 1
Best fit model for predicting valence with form variables according to 10-fold cross validation repeated 200 times (n = 3669).
| MODEL | ESTIMATE | STD. ERROR | t |
|---|---|---|---|
| (Intercept) | 4.369 | 0.178 | 24.489*** |
| Length | –0.226 | 0.059 | –3.847*** |
| Number phonemes | 0.169 | 0.060 | 2.801** |
| Number labiodental | –0.139 | 0.084 | –1.664 |
| Number alveolar | 0.065 | 0.029 | 2.283* |
| Number fricative | –0.064 | 0.032 | –1.984* |
| Number affricate | 0.243 | 0.128 | 1.907 |
| Number lateral | 0.089 | 0.041 | 2.179* |
| Number mid | 0.067 | 0.025 | 2.726** |
| Number unrounded | 0.071 | 0.028 | 2.521* |
| Initial Phoneme | 0.006 | 0.002 | 2.555* |
| Final Phoneme | 0.026 | 0.008 | 3.325*** |
| First Phoneme bilabial | 0.122 | 0.050 | 2.448* |
| First Phoneme labiovelar | –2.076 | 464.000 | –0.004 |
| First Phoneme velar | 0.145 | 0.053 | 2.730** |
| First Phoneme nasal | –0.204 | 0.081 | –2.515* |
| Final Phoneme alveolar | –0.503 | 0.116 | –4.335*** |
| Final Phoneme fricative | –0.292 | 0.156 | –1.865 |
| Final Phoneme lateral | 0.359 | 0.092 | 3.881*** |
| Final Phoneme unrounded | 0.528 | 0.143 | 3.705*** |
| Final Stress Position | 0.497 | 0.106 | 4.704*** |
[i] * p < .05; ** p < .01; *** p < .001.
Table 2
Best fit model for predicting emotionality with form variables according to 10-fold cross validation repeated 200 times (n = 3669).
| MODEL | ESTIMATE | STD. ERROR | t |
|---|---|---|---|
| (Intercept) | 0.820 | 0.054 | 15.260*** |
| Length | 0.098 | 0.033 | 2.959** |
| Number syllables | –0.138 | 0.045 | –3.060** |
| Number bilabial | –0.109 | 0.039 | –2.786** |
| Number dental | –0.139 | 0.041 | –3.425*** |
| Number alveolar | –0.149 | 0.036 | –4.191*** |
| Number palatal | –0.212 | 0.059 | –3.580*** |
| Number labiovelar | –0.303 | 0.077 | –3.960*** |
| Number velar | –0.200 | 0.041 | –4.843*** |
| Number nasal | 0.065 | 0.020 | 3.178** |
| Number fricative | 0.067 | 0.025 | 2.743** |
| Number approximant | 0.114 | 0.028 | 4.135*** |
| Number voiceless | 0.071 | 0.025 | 2.877** |
| Number unrounded | 0.026 | 0.018 | 1.441 |
| First Phoneme alveolar | –0.074 | 0.036 | –2.036* |
| First Phoneme labiovelar | 1.746 | 10.667 | 0.164 |
| First Phoneme voiceless | –0.114 | 0.031 | –3.658*** |
| Final Phoneme dental | 0.264 | 0.103 | 2.572* |
| Final Phoneme alveolar | 0.791 | 0.220 | 3.596*** |
| Final Phoneme nasal | –0.809 | 0.306 | –2.642** |
| Final Phoneme fricative | –0.336 | 0.149 | –2.253* |
| Final Phoneme lateral | –0.953 | 0.224 | –4.250*** |
| Final Phoneme trill | –0.600 | 0.222 | –2.700** |
[i] * p < .05; ** p < .01; *** p < .001.
Table 3
Best fit model for predicting arousal with form variables according to 10-fold cross validation repeated 200 times (n = 3669).
| MODEL | ESTIMATE | STD. ERROR | t |
|---|---|---|---|
| (Intercept) | 5.281 | 0.112 | 47.019*** |
| Length | 0.070 | 0.012 | 6.051*** |
| Number labiodental | 0.130 | 0.059 | 2.197* |
| Number alveolar | –0.042 | 0.022 | –1.931 |
| Number velar | –0.057 | 0.024 | –2.312* |
| Number fricative | 0.057 | 0.024 | 2.410* |
| Number affricate | –0.205 | 0.106 | –1.940 |
| Number lateral | –0.150 | 0.031 | –4.774*** |
| Number mid | –0.041 | 0.019 | –2.198* |
| Number unrounded | –0.043 | 0.020 | –2.115* |
| First Phoneme dental | 0.102 | 0.049 | 2.070* |
| First Phoneme affricate | 0.519 | 0.216 | 2.399* |
| First Phoneme voiceless | –0.076 | 0.034 | –2.235* |
| First Phoneme unrounded | 0.183 | 0.041 | 4.414*** |
| Final Phoneme alveolar | 0.165 | 0.089 | 1.850 |
| Final Phoneme lateral | –0.334 | 0.062 | –5.353*** |
| Final Phoneme open | –0.318 | 0.108 | –2.929** |
| Final Phoneme mid | –0.262 | 0.109 | –2.392* |
| Final Stress Position | –0.198 | 0.100 | –1.987* |
[i] * p < .05; ** p < .01; *** p < .001.
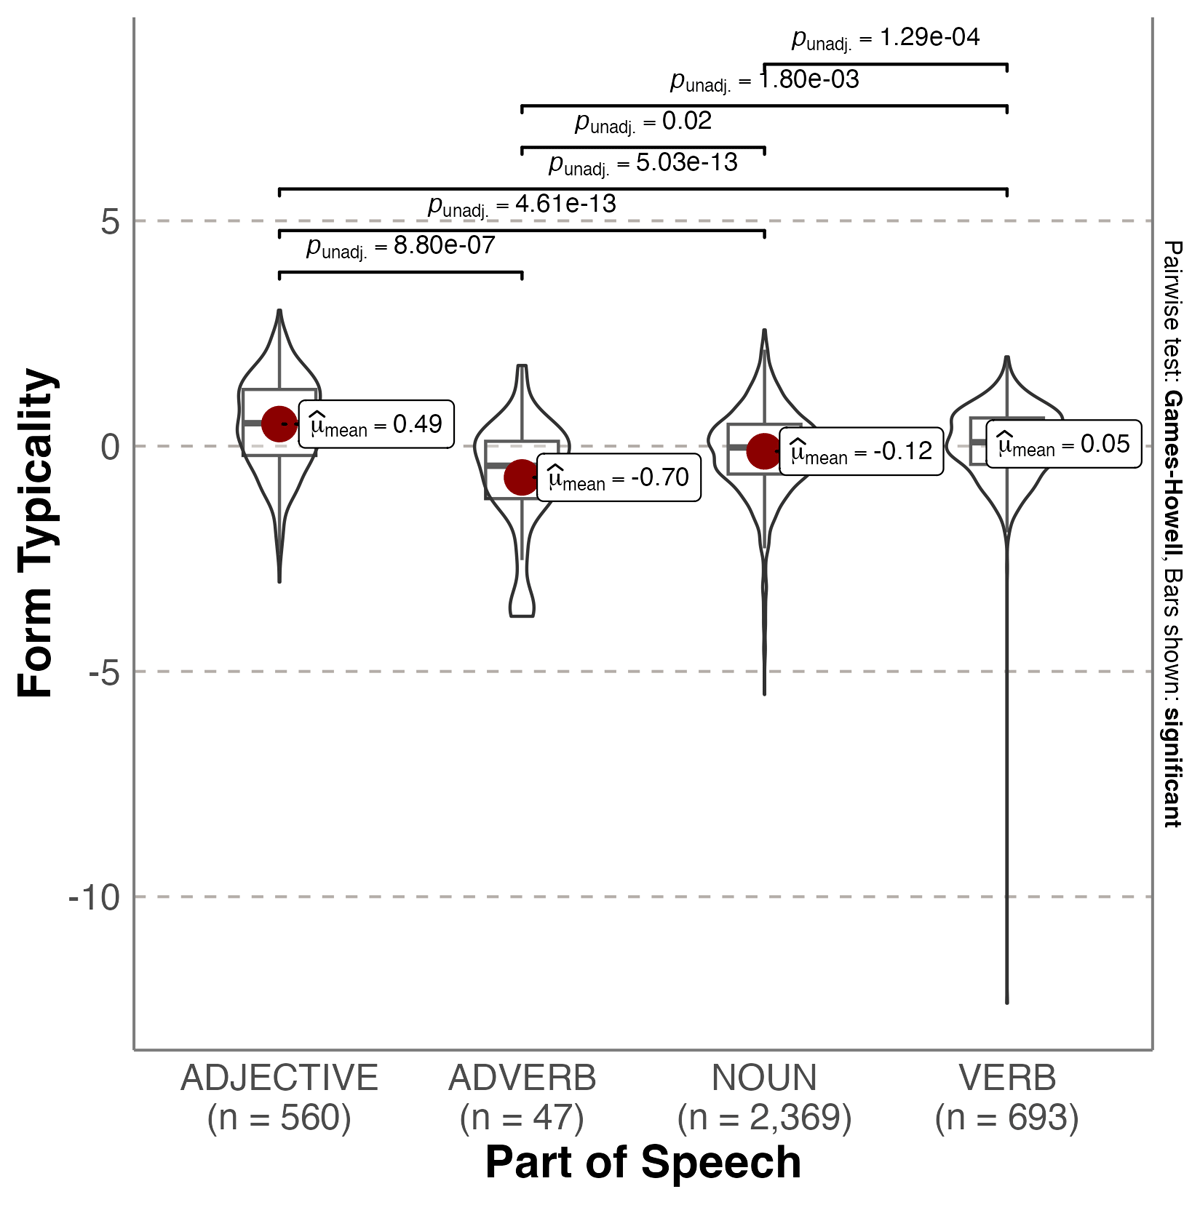
Figure 2
Violin plot showing probability densities of valence form typicality values as a function of Part of Speech. The red dot indicates the mean.
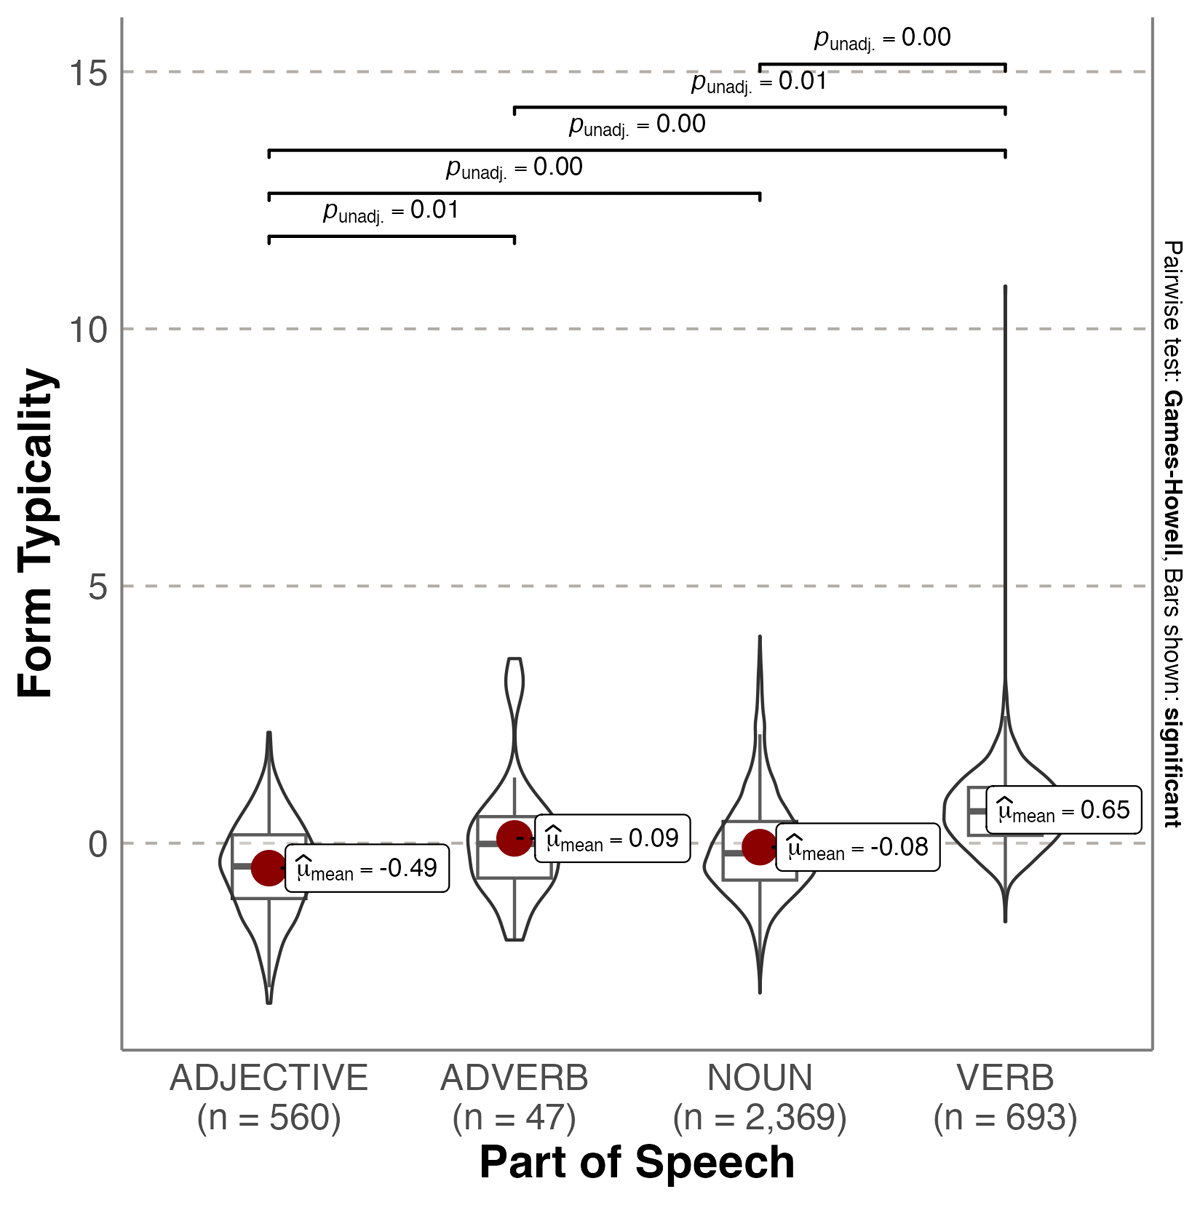
Figure 3
Violin plot showing probability densities of emotionality form typicality values as a function of Part of Speech. The red dot indicates the mean.
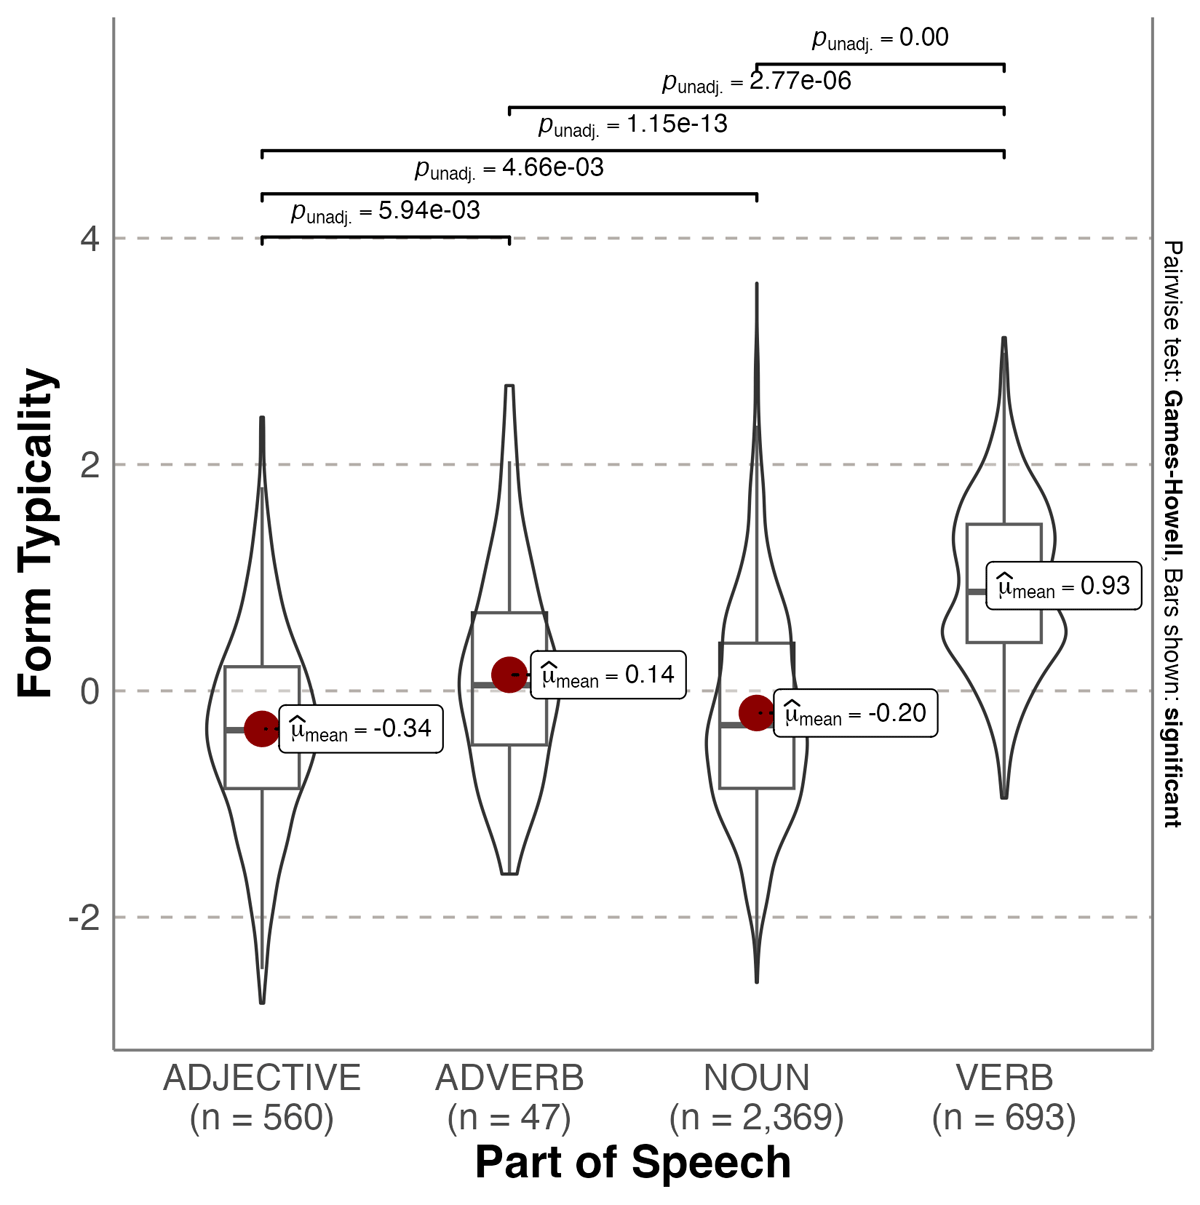
Figure 4
Violin plot showing probability densities of arousal form typicality values as a function of Part of Speech. The red dot indicates the mean.
Table 4
Words with the 10 most and least form typical values for each of the three affective ratings.
| VALENCE | EMOTIONALITY | AROUSAL | |||||||||
|---|---|---|---|---|---|---|---|---|---|---|---|
| MOST TYPICAL | LEAST TYPICAL | MOST TYPICAL | LEAST TYPICAL | MOST TYPICAL | LEAST TYPICAL | ||||||
| WORD | VALUE | WORD | VALUE | WORD | VALUE | WORD | VALUE | WORD | VALUE | WORD | VALUE |
| general | 3.02 | huir | –12.36 | huir | 10.83 | contractual | –3.11 | apendicitis | 3.60 | local | –2.76 |
| colateral | 2.78 | faringitis | –5.51 | hepatitis | 4.02 | cruel | –3.06 | especificar | 3.12 | colateral | –2.61 |
| craneal | 2.59 | hepatitis | –4.81 | oficialidad | 3.79 | colateral | –3.04 | hepatitis | 3.11 | laurel | –2.58 |
| panel | 2.58 | tifus | –4.68 | enfermedad | 3.69 | corporal | –2.94 | intensificar | 2.99 | colonial | –2.54 |
| penal | 2.58 | escurreplatos | –4.56 | tifus | 3.65 | coronel | –2.91 | infanticidio | 2.97 | lateral | –2.46 |
| peral | 2.58 | conjuntivitis | –4.53 | apendicitis | 3.61 | troncal | –2.80 | escurreplatos | 2.95 | literal | –2.46 |
| coronel | 2.56 | lavavajillas | –4.52 | entonces | 3.59 | comarcal | –2.71 | administrador | 2.91 | canal | –2.44 |
| poligonal | 2.54 | abrebotellas | –4.43 | abrebotellas | 3.51 | rural | –2.65 | infundir | 2.87 | poligonal | –2.42 |
| elemental | 2.53 | apendicitis | –4.39 | mantis | 3.48 | craneal | –2.62 | dermatitis | 2.87 | craneal | –2.38 |
| unilateral | 2.52 | meningitis | –4.37 | amigdalitis | 3.36 | sexual | –2.58 | faringitis | 2.85 | panel | –2.37 |
Table 5
Descriptive statistics for the variables in Study 2 (n = 1862).
| VARIABLE | MEAN | SD |
|---|---|---|
| Length | 7.1 | 1.90 |
| OLD | 1.9 | 0.60 |
| Mean bigram frequency | 5732 | 3607.00 |
| Phonological Neighbours | 9.3 | 11.00 |
| Subtitle Zipf frequency | 3.7 | 0.77 |
| Age of Acquisition | 7.3 | 2.00 |
| Prevalence | 2.3 | 0.28 |
| Concreteness | 4.6 | 1.10 |
| Familiarity | 5.1 | 1.00 |
| Valence | 5 | 1.30 |
| Emotionality | 0.96 | 0.86 |
| Arousal | 5.4 | 1.00 |
| Form Typicality (Valence) | –0.021 | 0.98 |
| Form Typicality (Emotionality) | –0.00 | 1.00 |
| Form Typicality (Arousal) | –0.08 | 0.99 |
[i] OLD: Orthographic Levenshtein Distance.
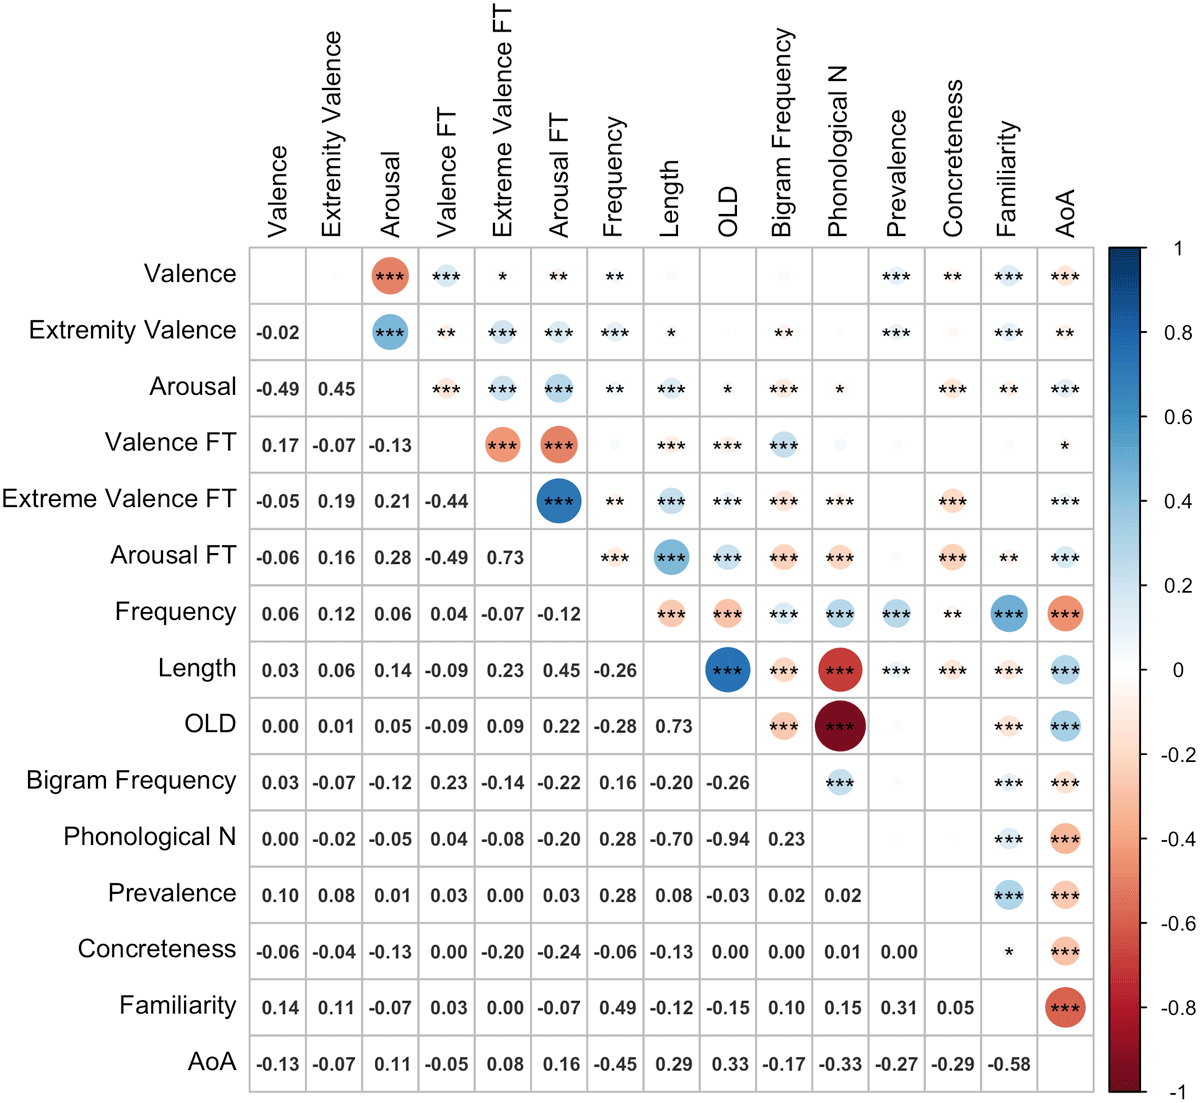
Figure 5
Correlations among variables (n = 1862). FT: Form Typicality; AoA: Age of Acquisition; OLD: orthographic Levenshtein distance; Phonological N: Number of Phonological Neighbours.
Table 6
Regression coefficients from analysis of valence (n = 1862).
| MODEL COMPARISON | ESTIMATE | STD. ERROR | t | ADJUSTED R2 | ΔR2 |
|---|---|---|---|---|---|
| Step 1 (control predictors) | 0.0285*** | ||||
| Intercept† | 6.375 | 0.513 | 12.434*** | ||
| Length | 0.055 | 0.027 | 2.048* | ||
| OLD | –0.105 | 0.096 | –1.097 | ||
| Phonological Neighbours | 0.001 | 0.003 | 0.179 | ||
| Mean bigram frequency | 0.000 | 0.000 | 0.673 | ||
| Zipf frequency | –0.156 | 0.051 | –3.075** | ||
| Prevalence | 0.058 | 0.108 | 0.540 | ||
| Concreteness | –0.163 | 0.034 | –4.838*** | ||
| Familiarity | 0.076 | 0.035 | 2.157* | ||
| Age of Acquisition | –0.103 | 0.023 | –4.415*** | ||
| Lexical Category: | |||||
| Adjective | –0.270 | 0.120 | –2.258* | ||
| Adverb | –0.209 | 0.239 | –0.877 | ||
| Verb | –0.292 | 0.096 | –3.029** | ||
| Step 2 | 0.469*** | 0.184*** | |||
| Emotionality | –0.179 | 0.039 | –4.646*** | ||
| Arousal | –0.792 | 0.028 | –28.742*** | ||
| Step 3 | 0.482*** | 0.013*** | |||
| TypValence | 0.211 | 0.030 | 6.946*** | ||
| TypEmotionality | 0.035 | 0.032 | 1.100 | ||
| TypArousal | 0.111 | 0.041 | 2.690** |
[i] †Represents reference level. TypValence: form typicality for valence; TypEmotionality: form typicality for Emotionality; TypArousal: form typicality for arousal. * p < .05; ** p < .01; *** p < .001.
Table 7
Regression coefficients from analysis of emotionality (n = 1862).
| MODEL COMPARISON | ESTIMATE | STD. ERROR | t | ADJUSTED R2 | ΔR2 |
|---|---|---|---|---|---|
| Step 1 (control predictors) | 0.054*** | ||||
| Intercept† | –0.300 | 0.347 | –0.866 | ||
| Length | –0.004 | 0.017 | –0.219 | ||
| OLD | 0.060 | 0.063 | 0.946 | ||
| Phonological Neighbours | –0.005 | 0.002 | –2.459* | ||
| Mean bigram frequency | 0.000 | 0.000 | –3.291** | ||
| Zipf frequency | 0.201 | 0.033 | 6.029*** | ||
| Prevalence | 0.077 | 0.072 | 1.074 | ||
| Concreteness | 0.043 | 0.023 | 1.862 | ||
| Familiarity | 0.009 | 0.023 | 0.376 | ||
| Age of Acquisition | 0.011 | 0.015 | 0.744 | ||
| Lexical Category: | |||||
| Adjective | 0.260 | 0.075 | 3.484*** | ||
| Adverb | –0.363 | 0.165 | –2.198* | ||
| Verb | 0.332 | 0.061 | 5.443*** | ||
| Step 2 | 0.374*** | 0.320*** | |||
| Valence | –0.093 | 0.022 | –4.230*** | ||
| Arousal | 0.413 | 0.035 | 11.959*** | ||
| Step 3 | 0.386*** | 0.012*** | |||
| TypValence | 0.011 | 0.021 | 0.522 | ||
| TypEmotionality | 0.141 | 0.024 | 5.837*** | ||
| TypArousal | –0.070 | 0.029 | –2.429* |
[i] †Represents reference level. TypValence: form typicality for valence; TypEmotionality: form typicality for Emotionality; TypArousal: form typicality for arousal. * p < .05; ** p < .01; *** p < .001.
Table 8
Regression coefficients from analysis of arousal (n = 1862).
| MODEL COMPARISON | ESTIMATE | STD. ERROR | t | ADJUSTED R2 | ΔR2 |
|---|---|---|---|---|---|
| Step 1 (control predictors) | 0.078*** | ||||
| Intercept† | 3.651 | 0.376 | 9.713*** | ||
| Length | 0.025 | 0.020 | 1.243 | ||
| OLD | 0.058 | 0.067 | 0.872 | ||
| Phonological Neighbours | –0.002 | 0.002 | –0.614 | ||
| Mean bigram frequency | 0.000 | 0.000 | –3.602*** | ||
| Zipf frequency | 0.286 | 0.039 | 7.415*** | ||
| Prevalence | –0.034 | 0.083 | 0.406 | ||
| Concreteness | 0.049 | 0.026 | 1.894 | ||
| Familiarity | 0.051 | 0.027 | –1.893 | ||
| Age of Acquisition | 0.075 | 0.018 | 4.227*** | ||
| Lexical Category: | |||||
| Adjective | 0.333 | 0.087 | 3.821*** | ||
| Adverb | –0.099 | 0.211 | –0.467 | ||
| Verb | 0.540 | 0.067 | 8.098*** | ||
| Step 2 | 0.570*** | 0.492*** | |||
| Valence | –0.388 | 0.023 | –16.509*** | ||
| Emotionality | 0.388 | 0.034 | 11.546*** | ||
| Step 3 | 0.575*** | 0.005*** | |||
| TypValence | 0.056 | 0.020 | 2.761** | ||
| TypEmotionality | –0.025 | 0.023 | –1.071 | ||
| TypArousal | 0.141 | 0.028 | 5.075*** |
[i] †Represents reference level. TypValence: form typicality for valence; TypEmotionality: form typicality for Emotionality; TypArousal: form typicality for arousal. * p < .05; ** p < .01; *** p < .001.
Table 9
Regression coefficients from item-level analyses of LDT RTs (n = 1862).
| MODEL COMPARISON | ESTIMATE | STD. ERROR | t | ADJUSTED R2 | ΔR2 |
|---|---|---|---|---|---|
| Step 1 (Control variables) | 0.521*** | ||||
| Step 2a (Valence variables) | 0.522*** | 0.001* | |||
| Valence | –2.523 | 1.084 | –2.327* | ||
| Emotionality | –2.338 | 1.486 | 1.573 | ||
| Arousal | 0.031 | 1.527 | 0.021 | ||
| Step 3a (Interactions) | 0.524*** | 0.002** | |||
| Valence × Arousal | 1.879 | 0.876 | 2.146* | ||
| Emotionality × Arousal | –3.073 | 1.170 | –2.627** | ||
| Step 4a (Form Typicality variables) | 0.525*** | 0.001 | |||
| TypValence | –0.051 | 1.563 | –0.032 | ||
| TypEmotionality | –3.050 | 1.592 | –1.916+ | ||
| TypArousal | 3.779 | 1.983 | 1.906+ | ||
| Step 5a (Interactions) | 0.525*** | 0.000 | |||
| TypValence × Arousal | 0.607 | 1.351 | 0.449 | ||
| TypEmotionality × Arousal | –1.264 | 1.376 | –0.919 | ||
| Step 2b (Form Typicality variables) | 0.521*** | 0.000 | |||
| TypValence | –0.706 | 1.554 | –0.454 | ||
| TypEmotionality | –3.240 | 1.559 | –2.078* | ||
| TypArousal | 3.627 | 1.988 | 1.824+ | ||
| Step 3b (Interactions) | 0.522*** | 0.001 | |||
| TypValence × Arousal | 0.555 | 1.354 | 0.410 | ||
| TypEmotionality × Arousal | –1.394 | 1.382 | –1.009 | ||
| Step 4b (Valence variables) | 0.523*** | 0.002 | |||
| Valence | –2.544 | 1.107 | –2.298* | ||
| Emotionality | –1.967 | 1.535 | 1.281 | ||
| Arousal | –0.309 | 1.531 | 0.202 | ||
| Step 5b (Interactions) | 0.525*** | –0.005** | |||
| Valence × Arousal | 1.926 | 0.876 | 2.199* | ||
| Emotionality × Arousal | –2.958 | 1.175 | –2.517* | ||
[i] TypValence = Form Typicality for Valence; TypEmotionality = Form Typicality for Emotionality; TypArousal = Form Typicality for Arousal. + p < .07; * p < .05; ** p < .01; *** p < .001.
Table 10
Regression coefficients from item-level analyses of LDT error rates (n = 1862).
| MODEL COMPARISON | ESTIMATE | STD. ERROR | t | ADJUSTED R2 | ΔR2 |
|---|---|---|---|---|---|
| Step 1 (Control variables) | 0.454*** | ||||
| Step 2a (Valence variables) | 0.454*** | 0.000 | |||
| Valence | –0.031 | 0.133 | –0.234 | ||
| Emotionality | 0.078 | 0.194 | 0.402 | ||
| Arousal | –0.328 | 0.197 | –1.663 | ||
| Step 3a (Interactions) | 0.454*** | 0.000 | |||
| Valence × Arousal | 0.175 | 0.121 | 1.451 | ||
| Emotionality × Arousal | –0.049 | 0.173 | 0.280 | ||
| Step 4a (Form Typicality variables) | 0.453*** | –0.001 | |||
| TypValence | 0.025 | 0.249 | 0.099 | ||
| TypEmotionality | –0.028 | 0.249 | –0.114 | ||
| TypArousal | –0.21 | 0.311 | –0.066 | ||
| Step 5a (Interactions) | 0.453*** | 0.000 | |||
| TypValence × Arousal | 0.329 | 0.192 | 1.713 | ||
| TypEmotionality × Arousal | 0.271 | 0.211 | 1.283 | ||
| Step 2b (Form Typicality variables) | 0.453*** | –0.001 | |||
| TypValence | 0.029 | 0.247 | 0.116 | ||
| TypEmotionality | –0.025 | 0.244 | –0.103 | ||
| TypArousal | –0.073 | 0.308 | –0.237 | ||
| Step 3b (Interactions) | 0.453*** | 0.000 | |||
| TypValence × Arousal | 0.320 | 0.191 | 1.673 | ||
| TypEmotionality × Arousal | 0.265 | 0.210 | 1.263 | ||
| Step 4b (Valence variables) | 0.453*** | 0.000 | |||
| Valence | –0.042 | 0.136 | –0.308 | ||
| Emotionality | 0.095 | 0.201 | 0.470 | ||
| Arousal | –0.340 | 0.200 | –1.697 | ||
| Step 5b (Interactions) | 0.453*** | 0.000 | |||
| Valence × Arousal | 0.174 | 0.121 | 1.442 | ||
| Emotionality × Arousal | –0.057 | 0.174 | –0.327 | ||
[i] TypValence = Form Typicality for Valence; TypEmotionality = Form Typicality for Emotionality; TypArousal = Form Typicality for Arousal. * p < .05; ** p < .01; *** p < .001.
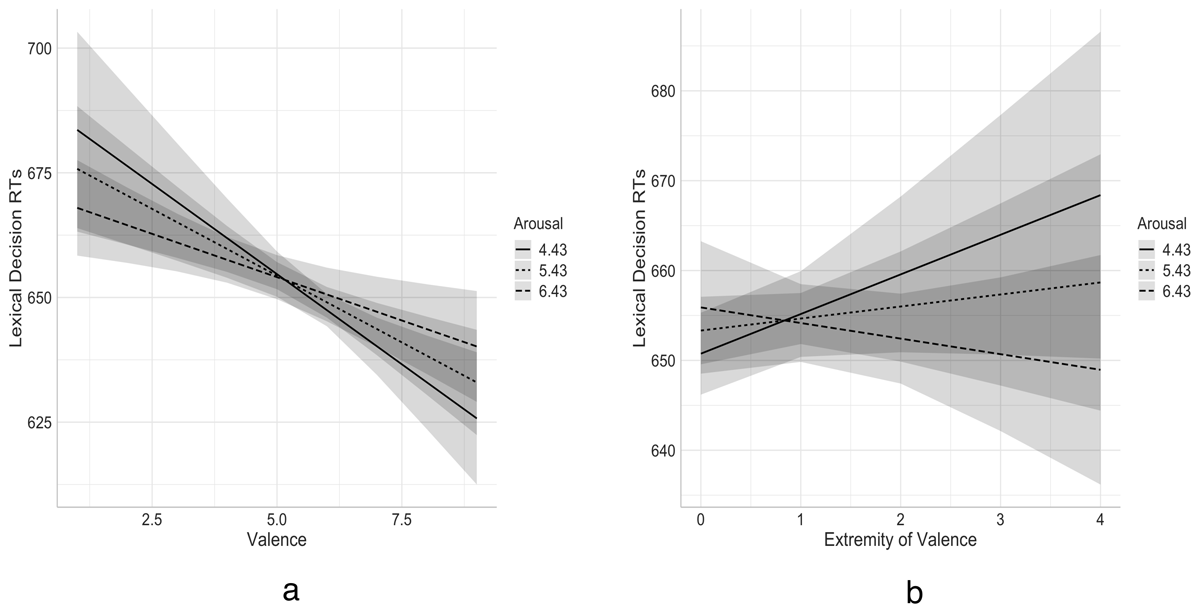
Figure 6
Added variable plot showing the relationships between lexical decision RTs and (a) valence and (b) Emotionality as a function of arousal after controlling for the lexico-semantic predictor variables. Shaded area shows 95% confidence intervals.
Table 11
Form features predictive of valence common and unique to English and Spanish.
| FORM FEATURE | ENGLISH | SPANISH |
|---|---|---|
| Both languages | ||
| Number fricative | – | – |
| Final phoneme | + | + |
| First Phoneme bilabial | + | + |
| First Phoneme velar | + | + |
| First Phoneme nasal | – | – |
| Final Stress Position | – | + |
| Spanish | ||
| Length | – | |
| Number phonemes | + | |
| Number labiodental | – | |
| Number alveolar | + | |
| Number affricate | + | |
| Number lateral | + | |
| Number mid | + | |
| Number unrounded | + | |
| Initial Phoneme | + | |
| First Phoneme labiovelar | + | |
| Final Phoneme alveolar | – | |
| Final Phoneme fricative | – | |
| Final Phoneme lateral | + | |
| Final Phoneme unrounded | + | |
| English | ||
| Number stop | – | |
| First Phoneme stop | – | |
| Final Phoneme labiodental | + | |
| Number syllables | + | |
| Initial Stress Position | – | |
| Medial Stress Position | – |
[i] Note: + valence; – negative valence.