
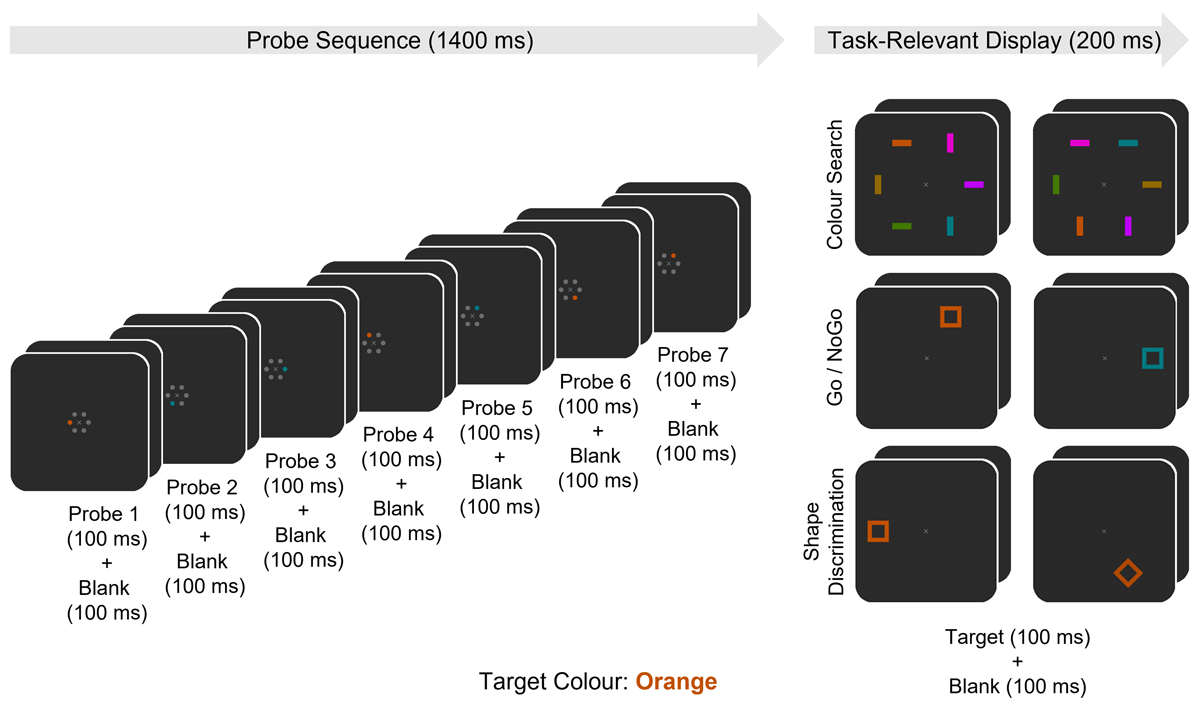
Figure 1
Time course of the per-trial stimulus-events occurring in each task (Colour Search, Go/NoGo, Shape Discrimination). A series of 12 consecutive trials occurred in each block of the experiment, with 24 blocks per task, and each block beginning with the pseudo-random assignment of a target colour (in this example, orange). Trials began with a sequence of seven probe-displays (100 ms), each followed by a blank screen (100 ms). Every probe display included either a target colour or non-target colour singleton probe, which was pseudo-randomly located amongst five grey placeholders. Following the probe sequence, a task-relevant display appeared (100 ms), followed by a blank screen (100 ms). In the Search task, the task-relevant display included one target colour bar amongst five other unique non-target colour bars, all of which were pseudo-randomly located and could be either horizontally or vertically oriented. Participants were instructed to indicate the orientation of the target colour bar. In the Go/NoGo task, the task-relevant display included a single unfilled square pseudo-randomly located at one of six potential locations. The square could appear in either the target colour or a different non-target colour. Participants were instructed to only respond to target colour items and to withhold responses when the item appeared in the other non-target colour. In the Shape Discrimination task, the task-relevant display included a single unfilled shape pseudo-randomly located at one of six potential locations, which always appeared in the target colour and could be oriented at either 0° (“a square”) or 90° (“a diamond”). Participants were instructed to indicate the shape of the item.
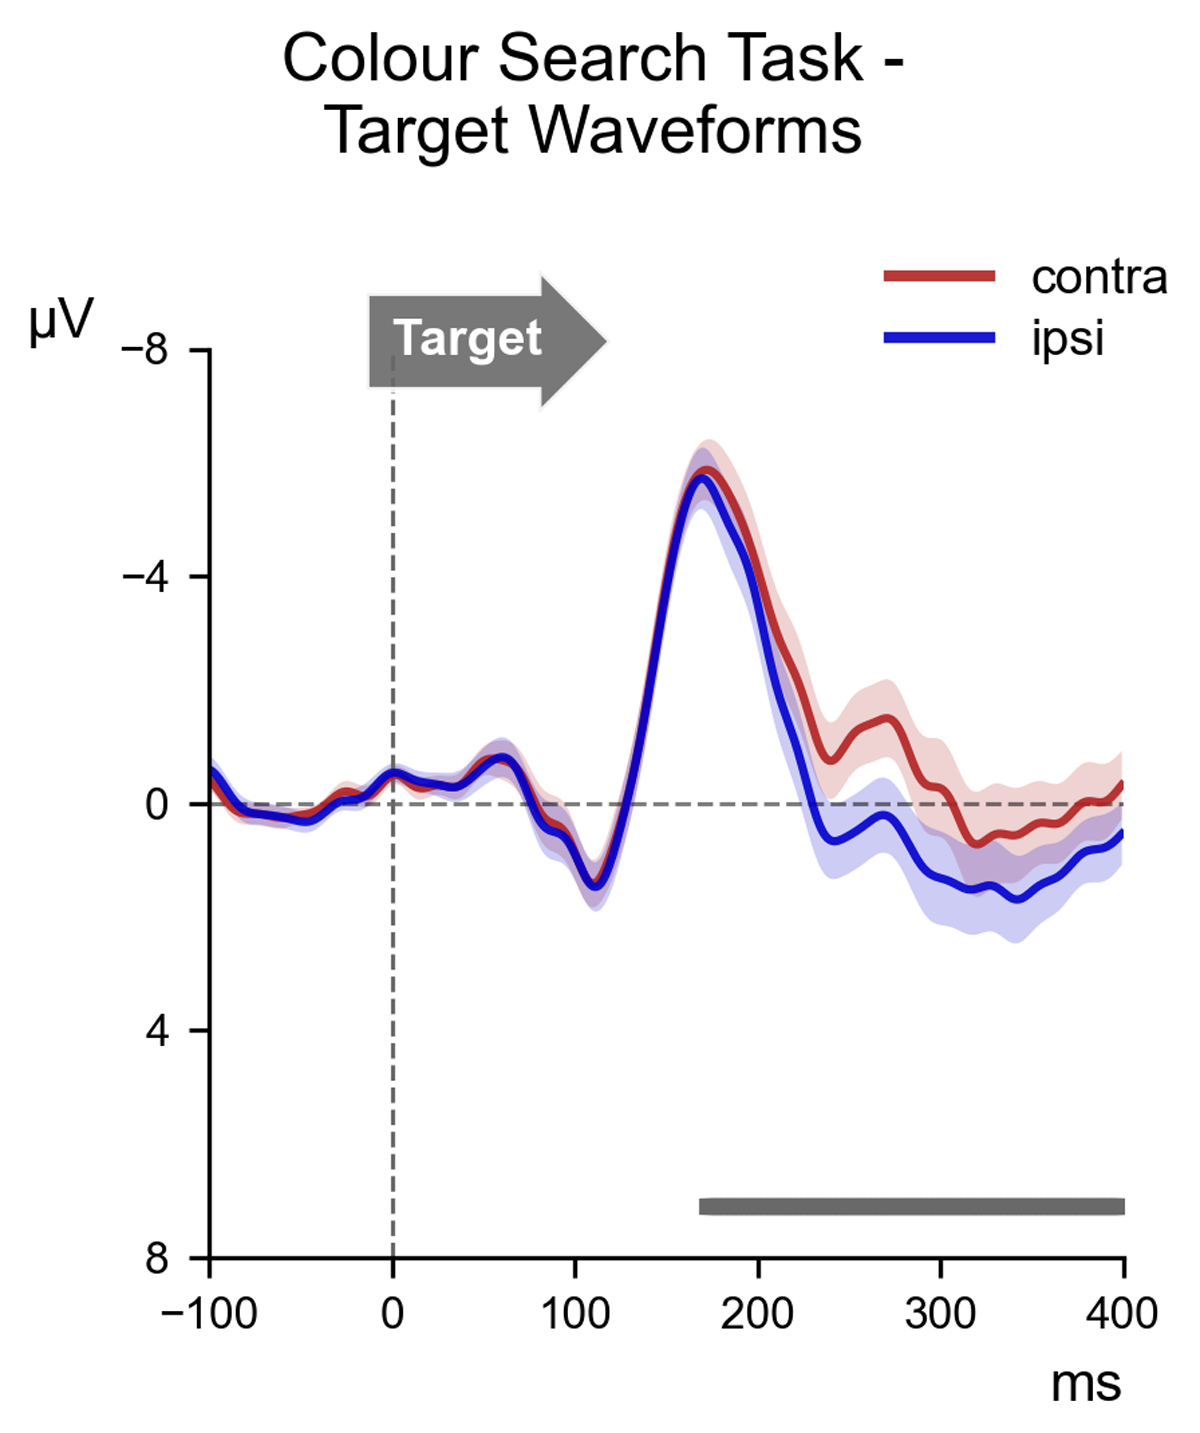
Figure 2
ERP waveforms elicited over scalp locations PO7/PO8, contralateral (red) and ipsilateral (blue) to the location of the target item in the task-relevant display of the Colour Search task. The waveforms are shown beginning 100 ms before the onset of the task-relevant display (serving as a baseline window) and proceeding for 400 ms thereafter. The contralateral waveform appears to become substantially more negative than the ipsilateral waveform. This observation was confirmed by permutation analysis, which indicated a large cluster (shown as a grey bar at the bottom of the frame) where the contralateral waveform was reliably more negative than the ipsilateral waveform, beginning approximately 170 ms after stimulus onset.
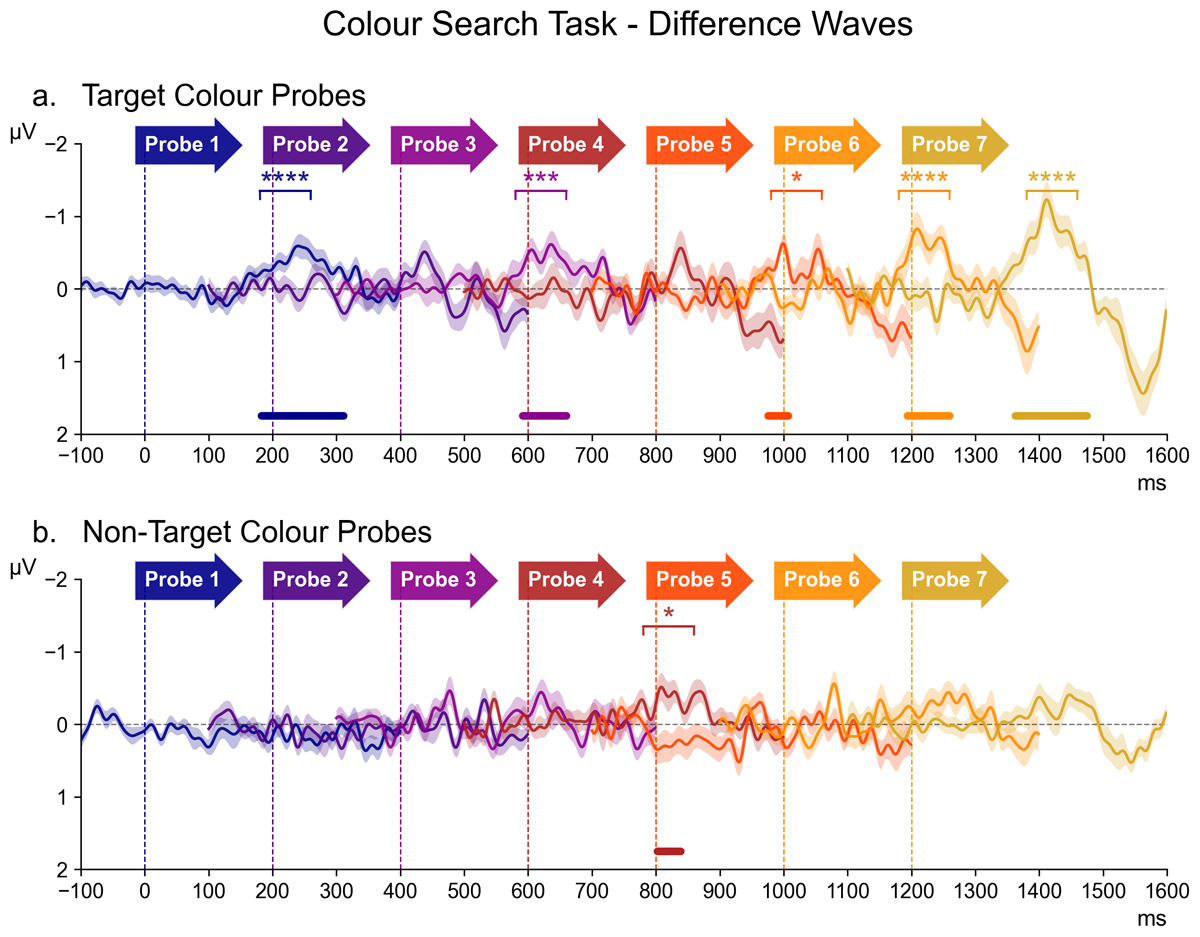
Figure 3
The series of difference waves (contralateral – ipsilateral waveforms) elicited in the Colour Search Task over scalp sites PO7/PO8, by target colour probes (panel a) and non-target colour probes (panel b). The onset latency of each probe is demarcated by a vertical dotted line in the colour of the probe label directly above. The waveform of each probe also appears in the corresponding colour, beginning 100 ms before the onset of the relative probe display (serving as a baseline window) and proceeding for 400 ms thereafter. Waveforms for which Bayesian analysis revealed contralateral negativity within the N2pc time window (180–260 ms after probe onset) are marked above with asterisks in the corresponding colour (* = BF10 > 3, ** = BF10 > 10, *** = BF10 > 30, **** = BF10 > 100). Similarly, portions of the waveforms wherein the permutation analysis detected significant clusters of contralateral negativity are marked below with horizontal bars in the corresponding colour.
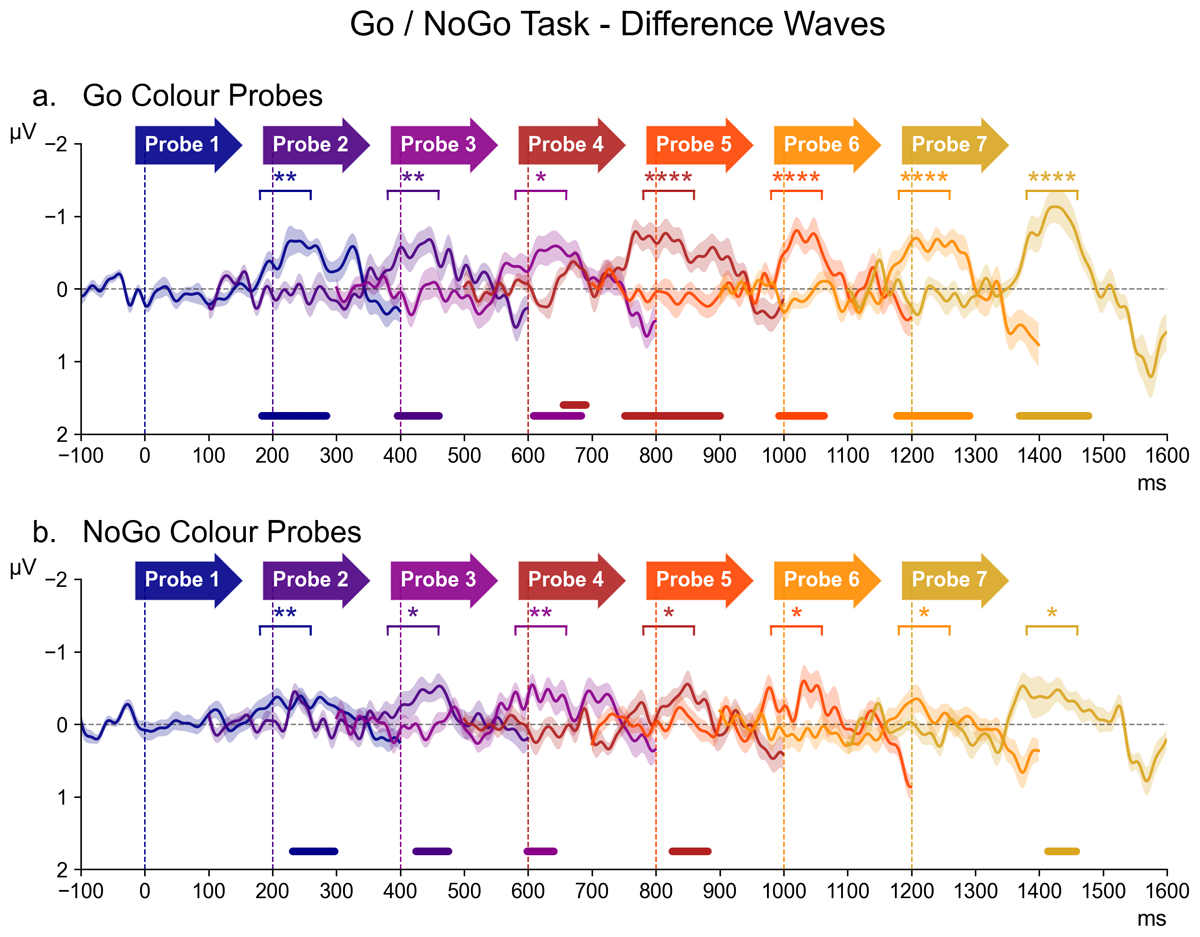
Figure 4
The series of difference waves (contralateral – ipsilateral waveforms) elicited in the Go/NoGo Task over scalp sites PO7/PO8, by target (Go) colour probes (panel a) and non-target (NoGo) colour probes (panel b). The structure and layout of Figure 4 is otherwise identical to that of Figure 3.
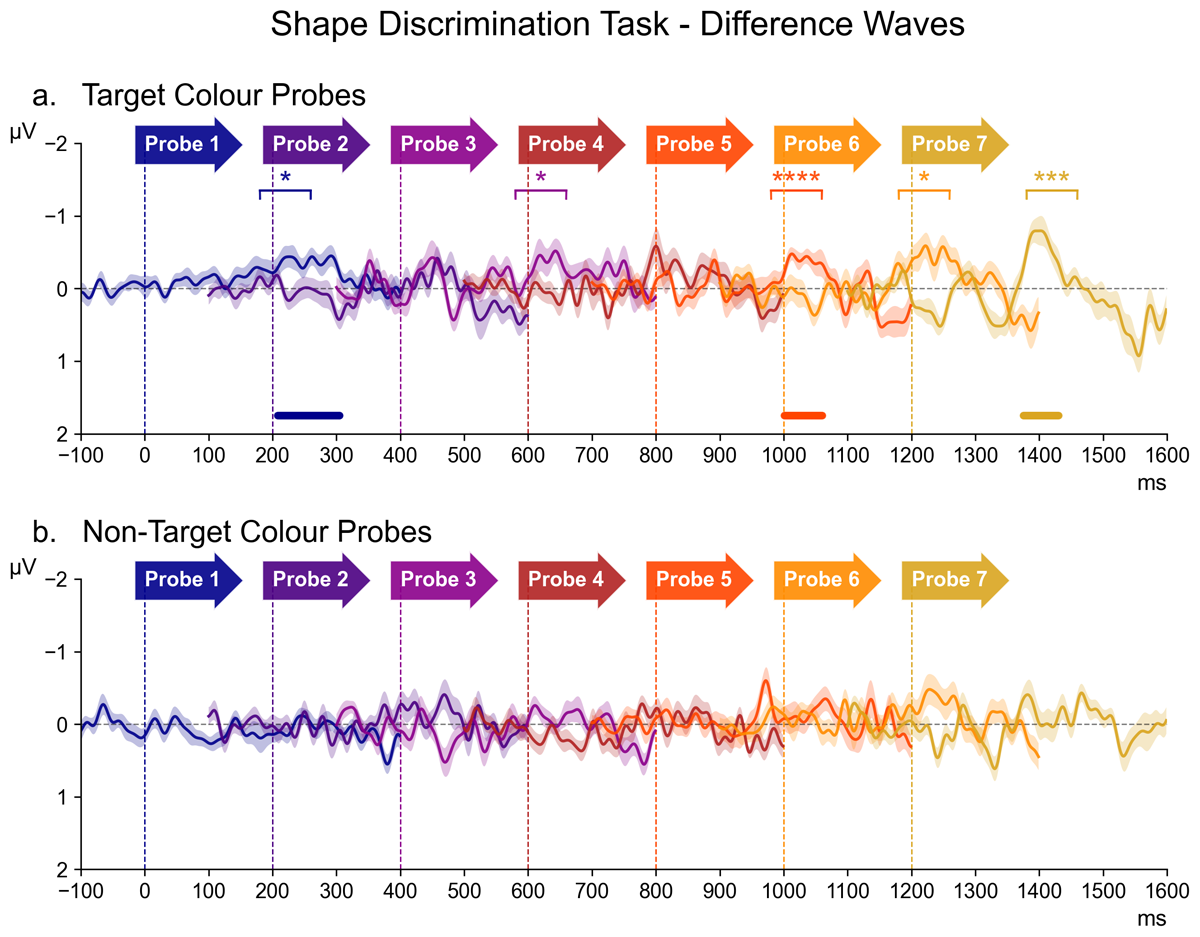
Figure 5
The series of difference waves (contralateral – ipsilateral waveforms) elicited in the Shape Discrimination Task over scalp sites PO7/PO8, by target colour probes (panel a) and non-target colour probes (panel b). The structure and layout of Figure 5 is otherwise identical to that of Figure 3.
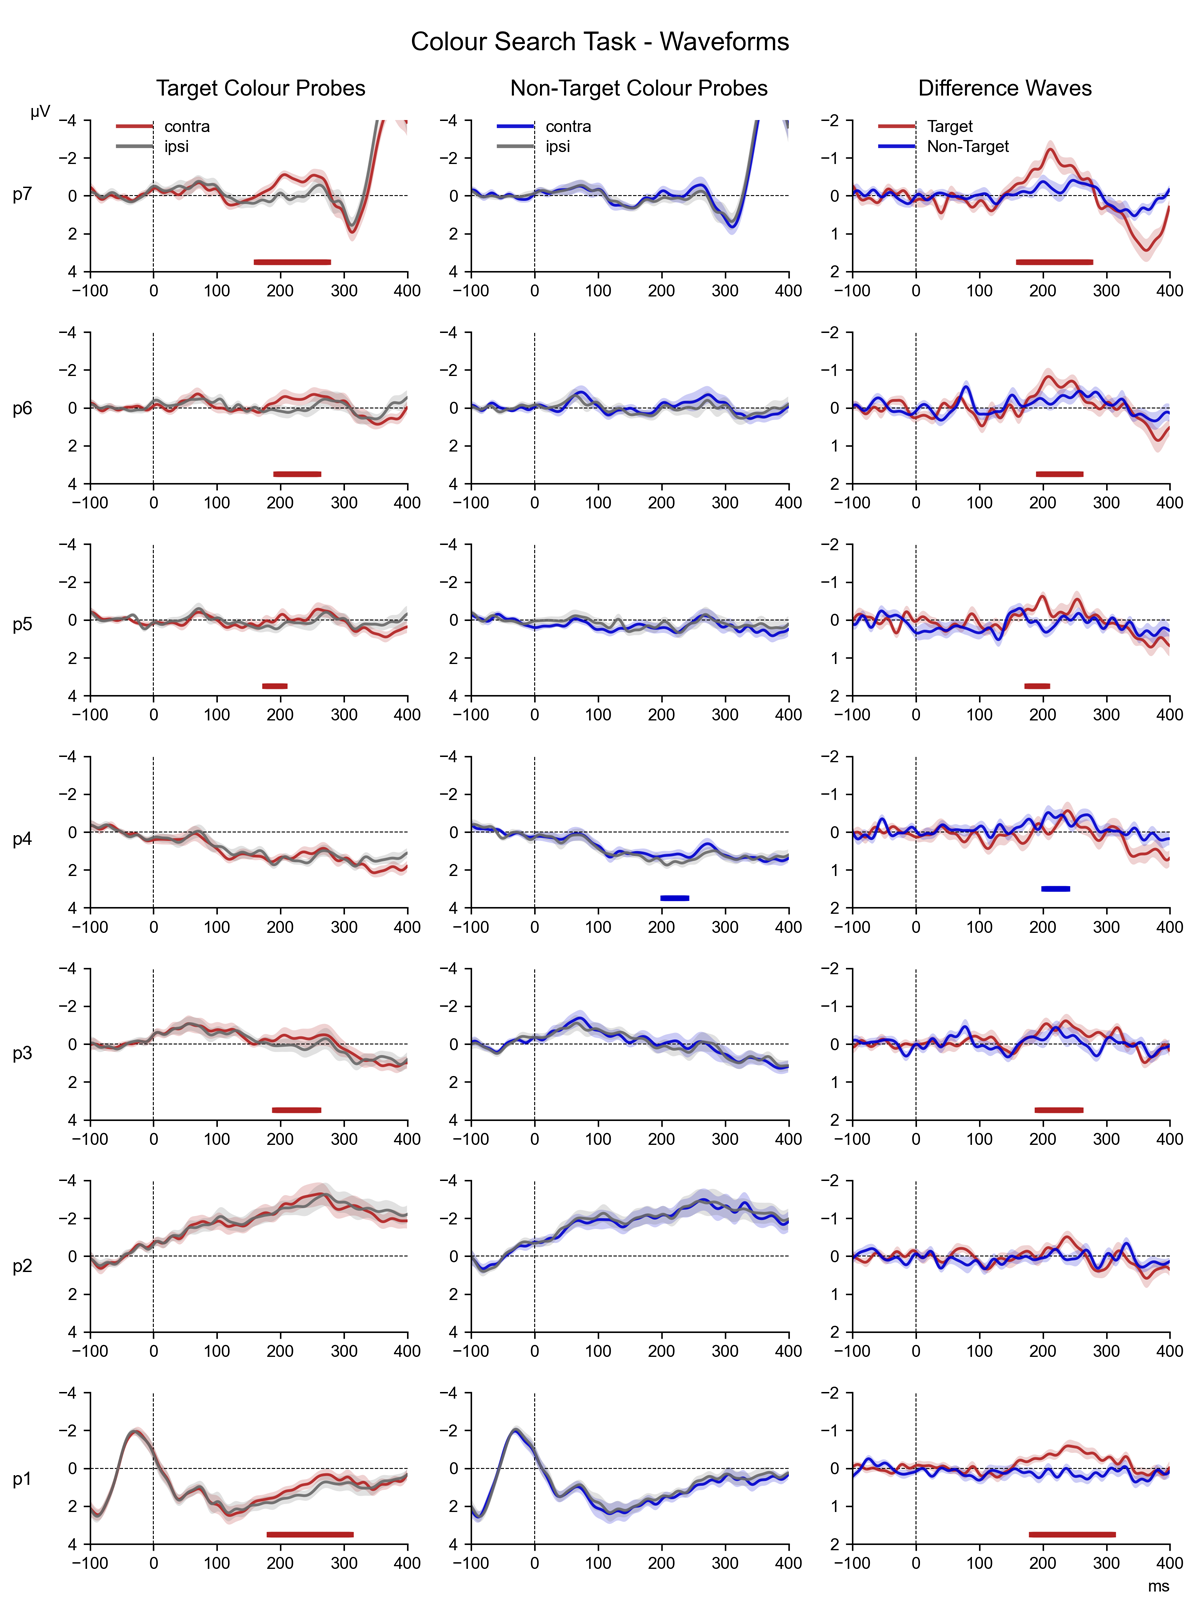
Figure 6
Target Colour Probes (left column) and Non-Target Colour probes (middle column): ERP waveforms elicited over scalp positions PO7/PO8, contralateral (target colour: red, non-target colour: blue) and ipsilateral (grey) to the location of each colour singleton probe. Significant clusters of contralateral negativity detected through permutation analysis appear as a horizontal line at the bottom of each figure (target colour: red, non-target colour: blue). Difference waves: The contralateral – ipsilateral difference waves calculated from the target colour (red) and non-target colour (blue) waveforms for each probe (clusters of contralateral negativity are coloured accordingly).
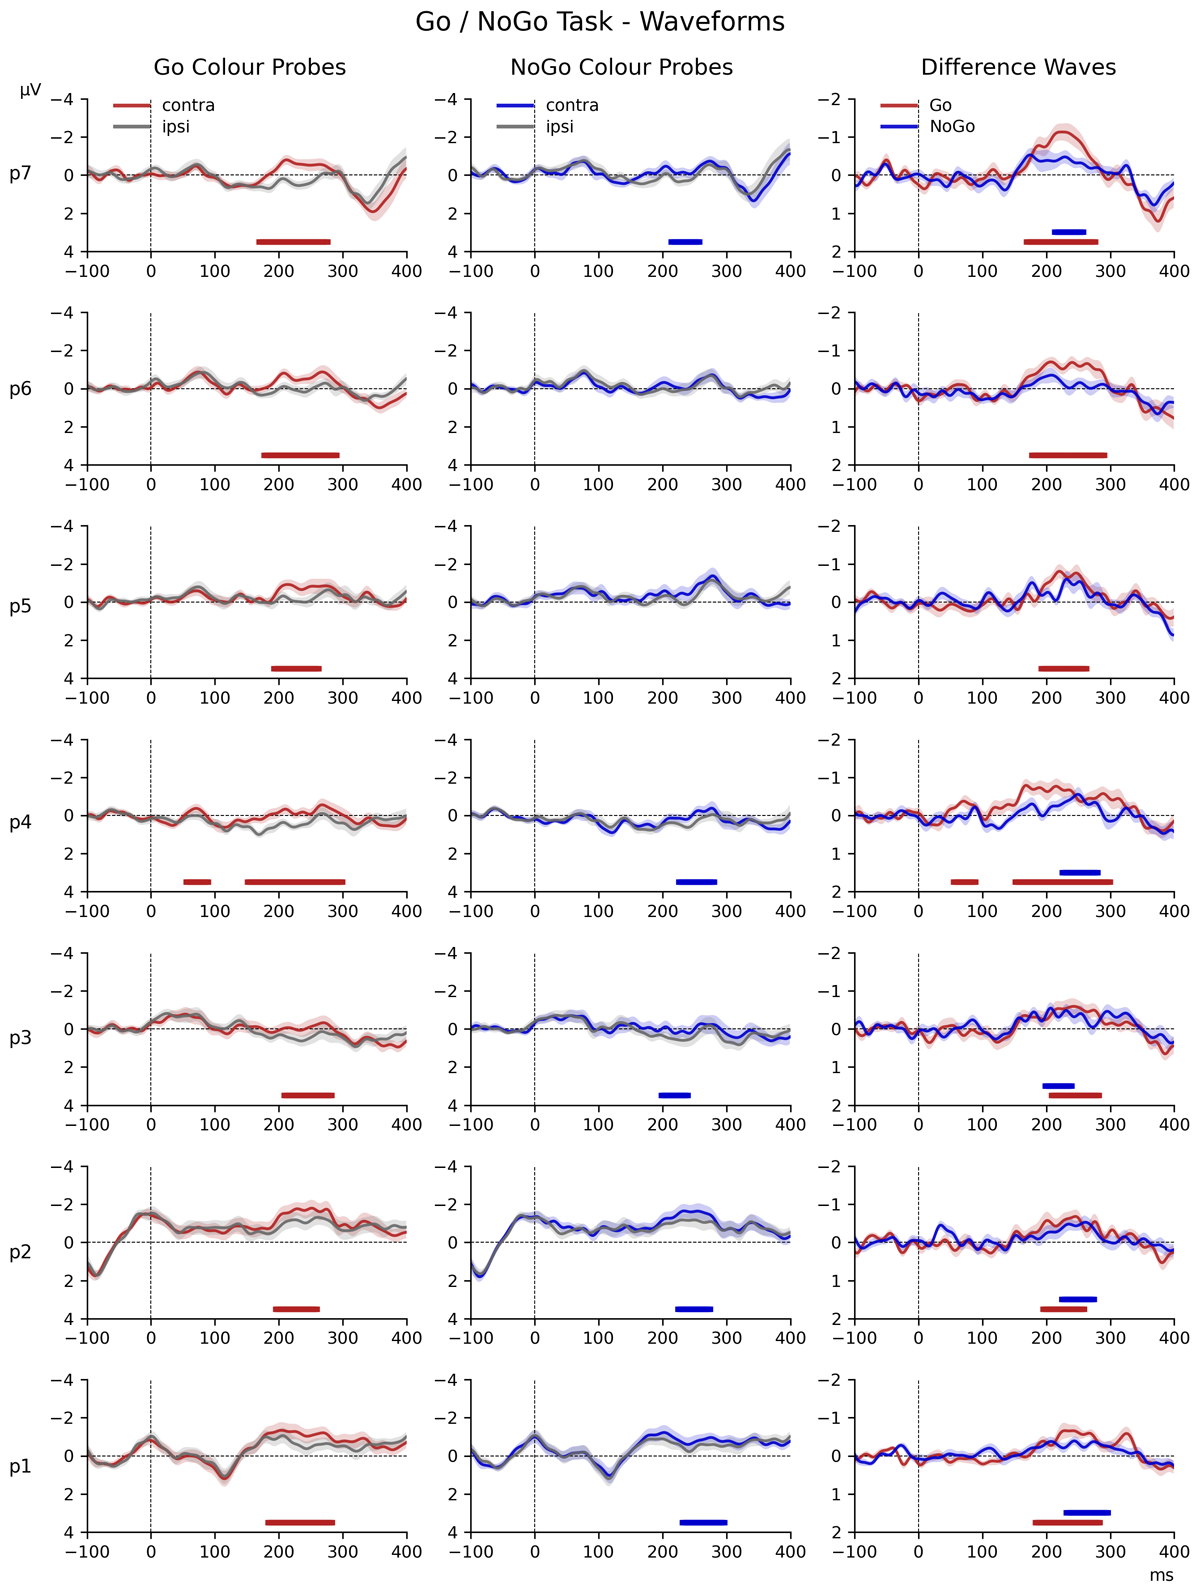
Figure 7
Go Colour Probes (left column) and NoGo Colour probes (middle column): ERP waveforms elicited over scalp positions PO7/PO8, contralateral (Go colour: red, NoGo colour: blue) and ipsilateral (grey) to the location of each colour singleton probe. Significant clusters of contralateral negativity detected through permutation analysis appear as a horizontal line at the bottom of each figure (Go colour: red, NoGo colour: blue). Difference waves: The contralateral – ipsilateral difference waves calculated from the Go colour (red) and NoGo colour (blue) waveforms for each probe (clusters of contralateral negativity are coloured accordingly).
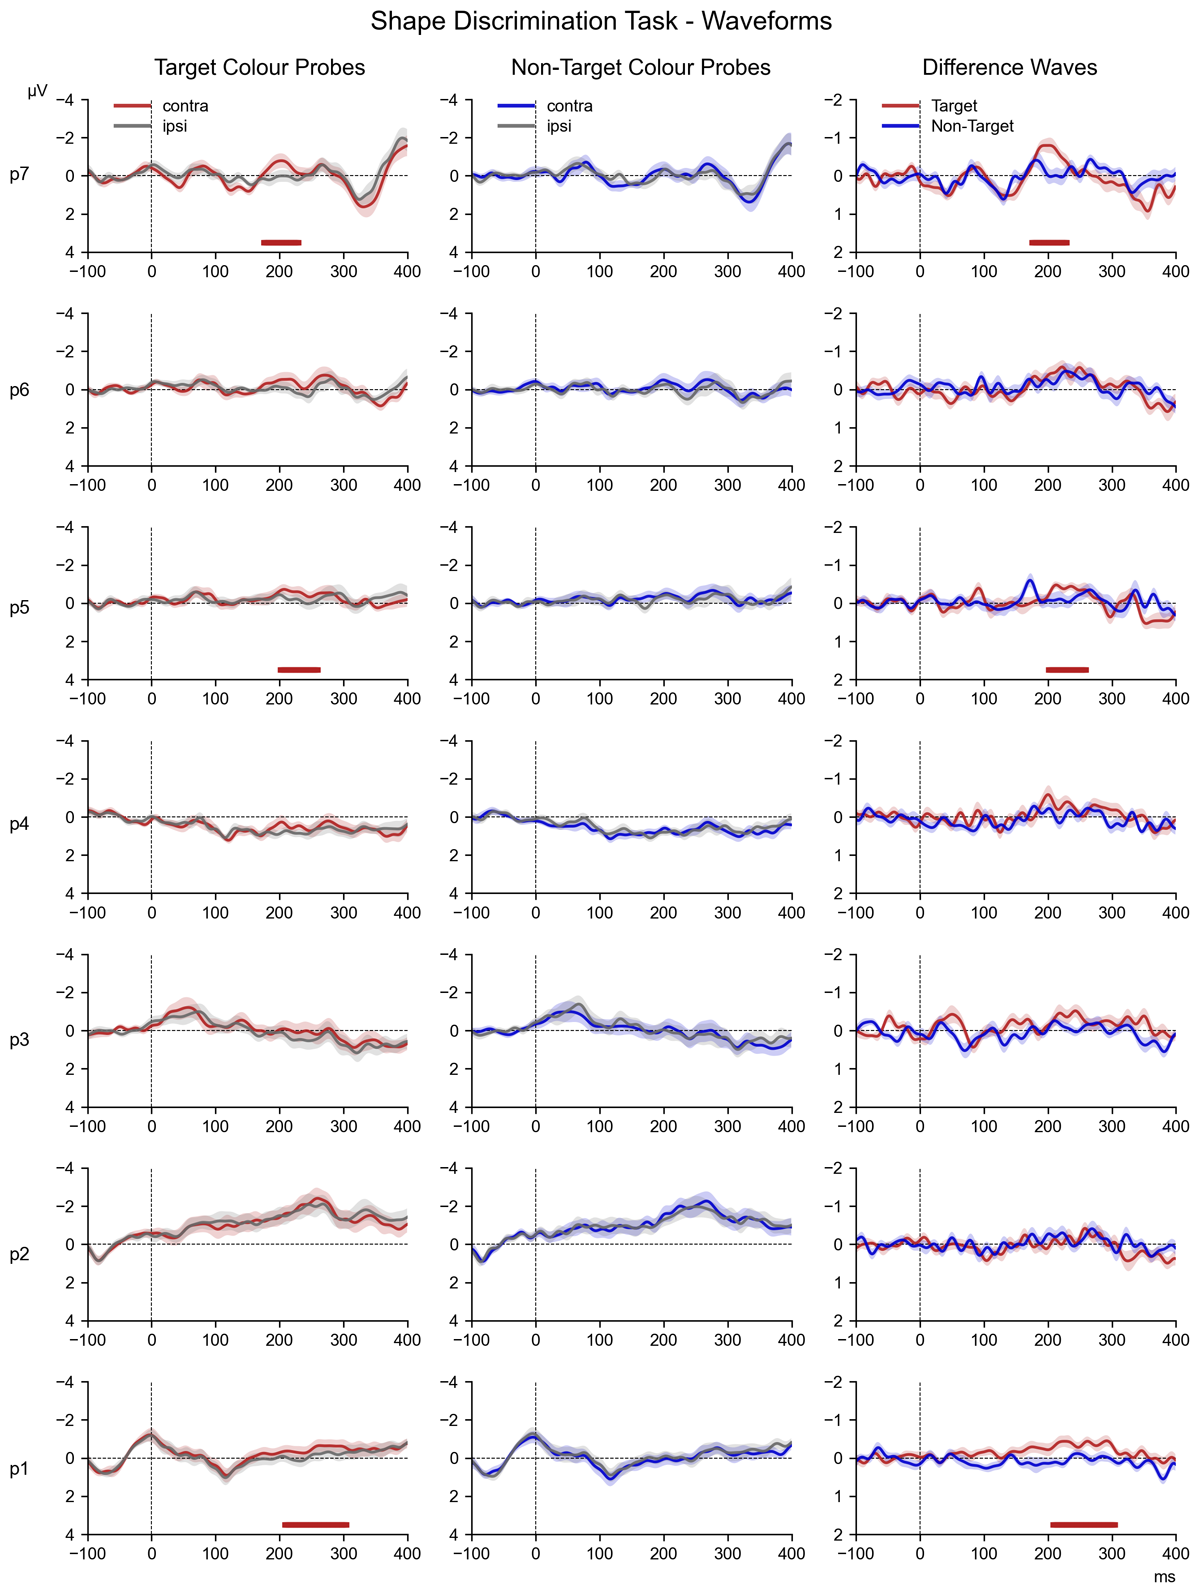
Figure 8
Target Colour Probes (left column) and Non-Target Colour probes (middle column): ERP waveforms elicited over scalp positions PO7/PO8, contralateral (target colour: red, non-target colour: blue) and ipsilateral (grey) to the location of each colour singleton probe. Significant clusters of contralateral negativity detected through permutation analysis appear as a horizontal line at the bottom of each figure (target colour: red, non-target colour: blue). Difference waves: The contralateral – ipsilateral difference waves calculated from the target colour (red) and non-target colour (blue) waveforms for each probe (clusters of contralateral negativity are coloured accordingly).