
Table 1
Means (and SDs) per condition and language group in Experiment 1.
| BILINGUALS | MONOLINGUALS | |
|---|---|---|
| First presentation | ||
| Homographs | 731 (201) | 752 (147) |
| Controls homographs | 596 (147) | 594 (107) |
| Synonyms | 693 (173) | 685 (101) |
| Controls synonyms | 591 (122) | 603 (110) |
| Second presentation | ||
| Homographs | 760 (164) | 741 (134) |
| Controls homographs | 516 (110) | 537 (86) |
| Synonyms | 671 (173) | 670 (153) |
| Controls synonyms | 517 (103) | 526 (91) |
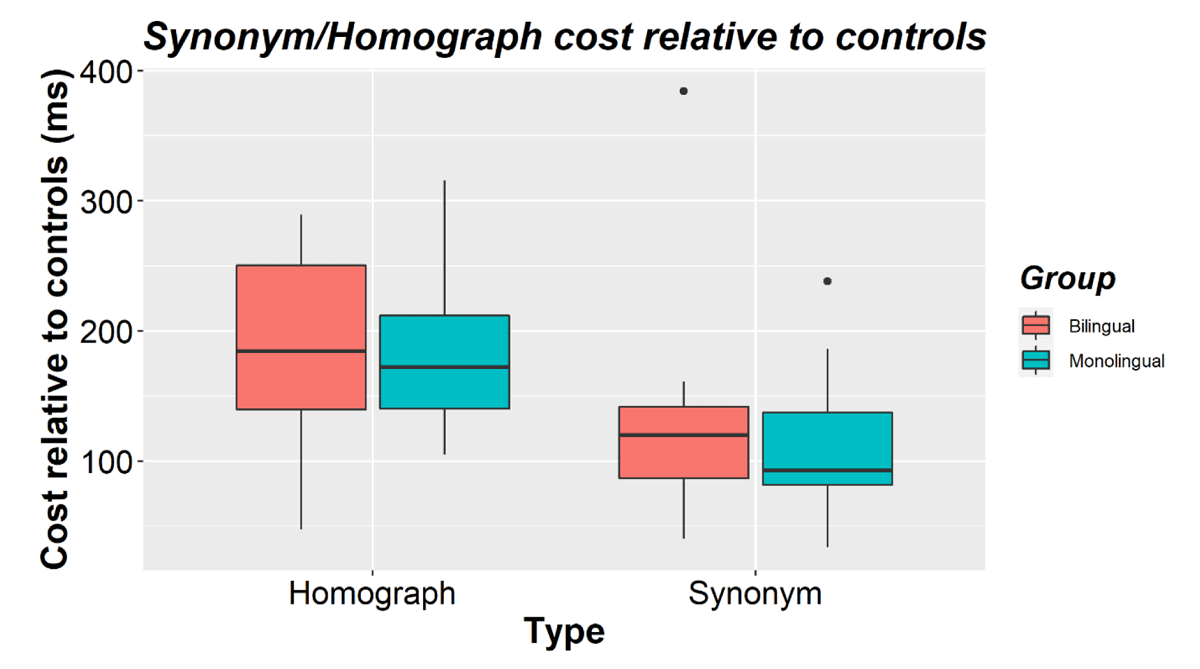
Figure 1
Homograph and synonym RT costs (relative to their corresponding control items) for bilinguals and monolinguals in Experiment 1. The horizontal line shows the median while black dots show outliers.
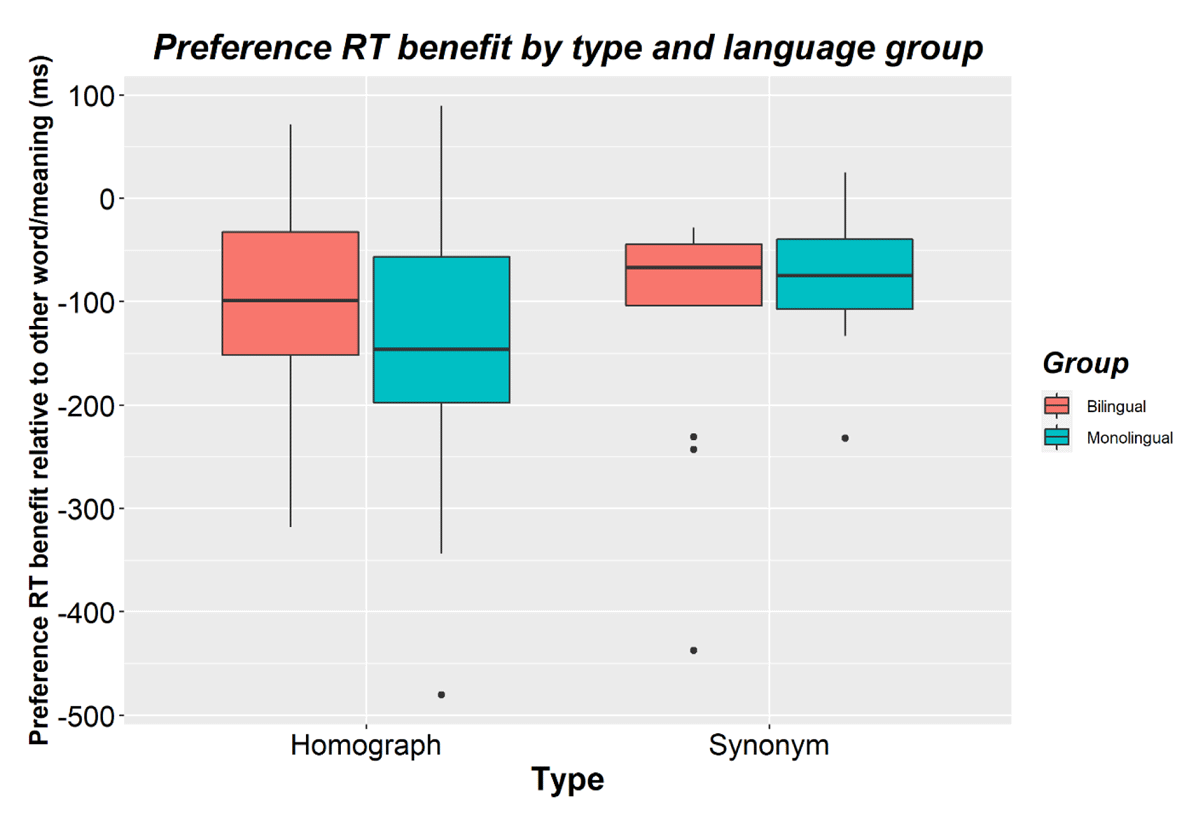
Figure 2
Preference benefits (i.e., faster RTs for preferred words/meanings relative to the other word/meaning) for bilinguals and monolinguals and for homographs and synonyms in Experiment 1. Negative scores reflect a benefit in processing time when seeing the preferred word or meaning. The horizontal line shows the median while black dots show outliers.
Table 2
Means (and SDs) per condition and language group in Experiment 2.
| BILINGUALS | MONOLINGUALS | |
|---|---|---|
| First presentation | ||
| Homographs | 855 (197) | 894 (219) |
| Controls homographs | 656 (153) | 705 (191) |
| Synonyms | 804 (192) | 828 (224) |
| Controls synonyms | 666 (178) | 690 (218) |
| Second presentation | ||
| Homographs | 827 (174) | 855 (200) |
| Controls homographs | 593 (132) | 641 (213) |
| Synonyms | 741 (169) | 756 (208) |
| Controls synonyms | 611 (125) | 664 (234) |
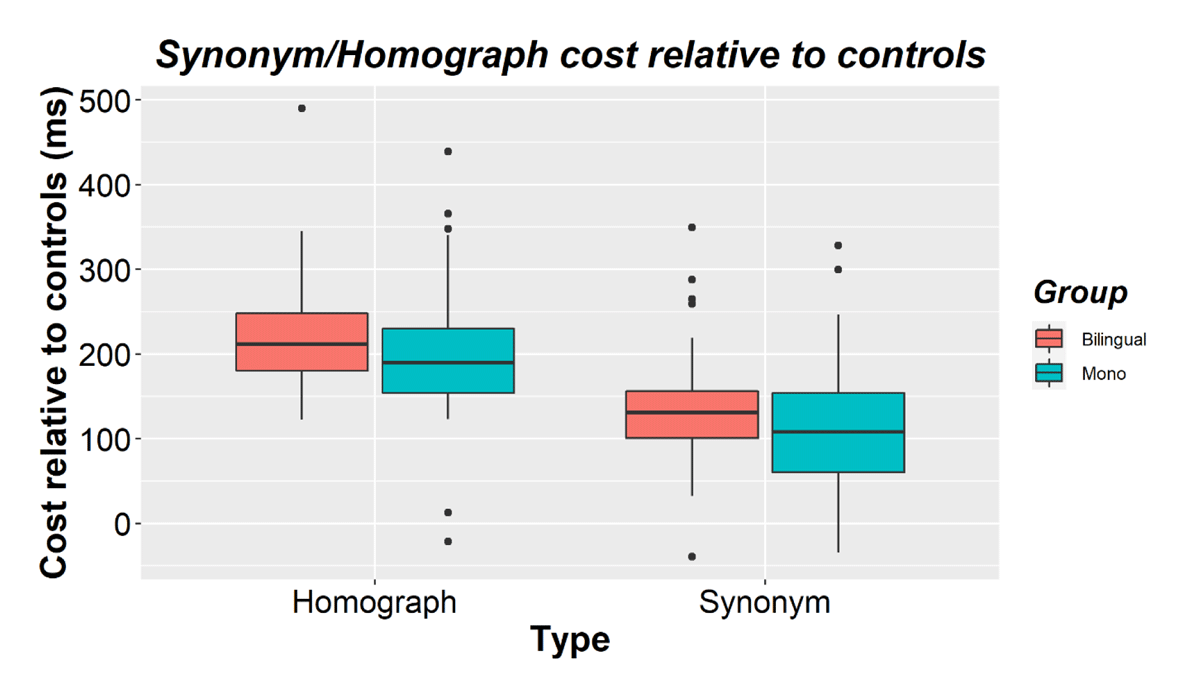
Figure 3
Homograph and synonym costs (relative to their corresponding control items) for bilinguals and monolinguals in Experiment 2. The horizontal line shows the median while black dots show outliers.
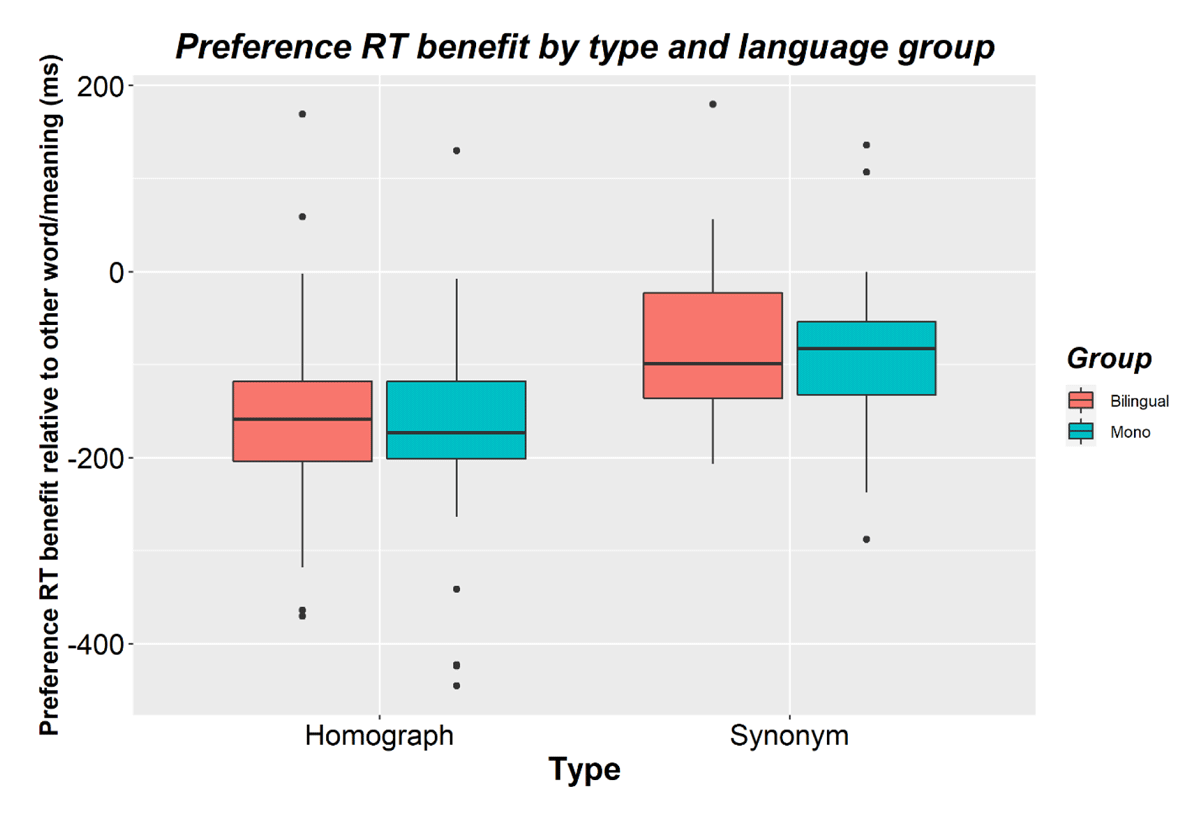
Figure 4
Preference benefits (i.e., faster RTs for preferred words/meanings relative to the other word/meaning) for bilinguals and monolinguals and for homographs and synonyms in Experiment 2. Negative scores reflect a benefit in processing time when seeing your preferred word or meaning. The horizontal line shows the median while black dots show outliers.