
Figure 1
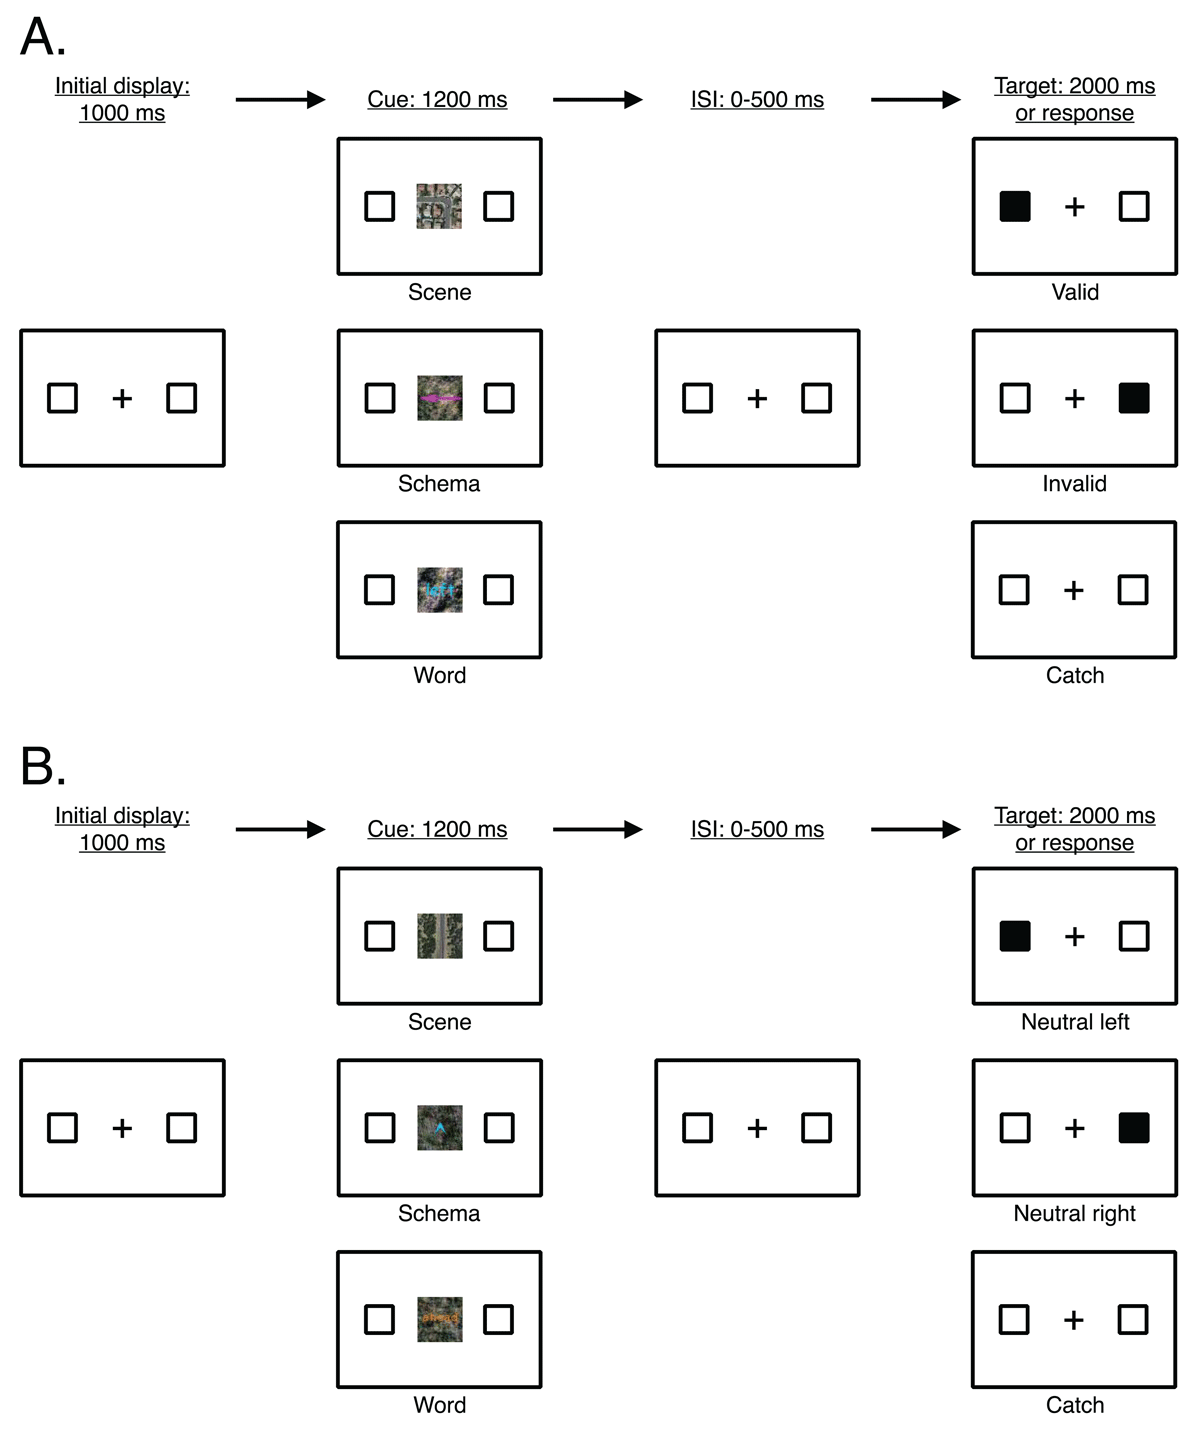
General trial structure (sequence and timing) of all trial types in Experiments 1–4. (A) Main trial types (valid, invalid, catch) defined by the direction of the cue (here, indicating left) and the location of the target. (B) Neutral trial types (neutral left, neutral right, neutral catch) defined by ahead cues.
Note: Stimuli not drawn to scale. The target appeared for 100 ms and participants had a maximum of 2000 ms to respond. ISI = interstimulus interval.
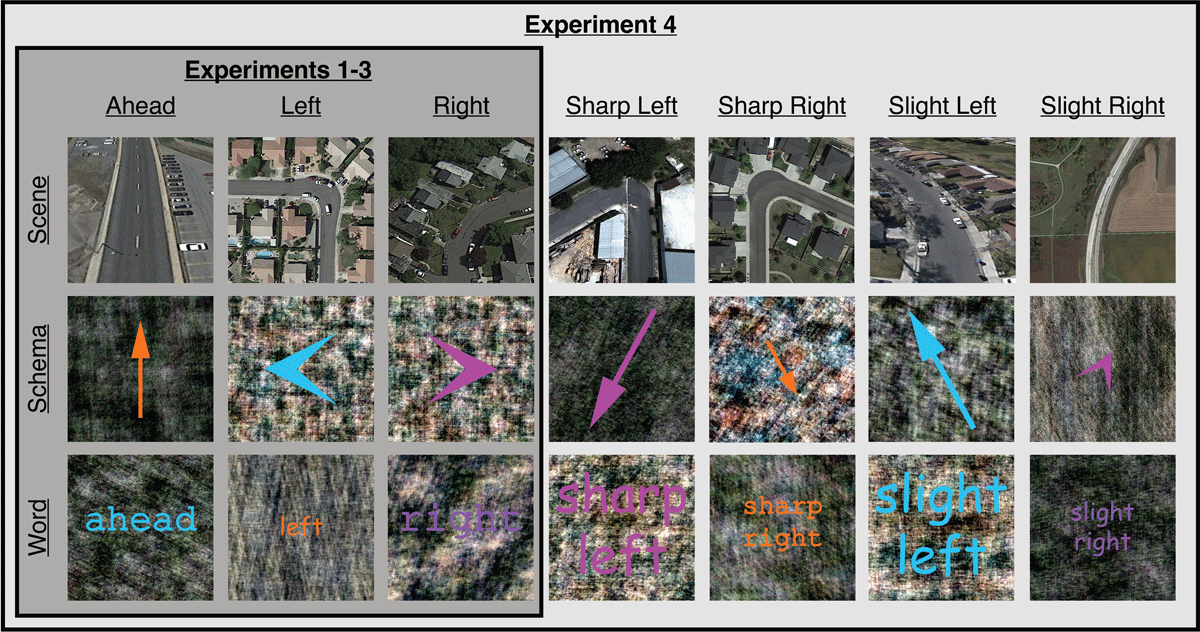
Figure 2
Examples of cues used in Experiments 1–4. In Experiments 1–3, cues depicted three orthogonal spatial directions (ahead, left, right) in three formats (scene, schema, word). In Experiment 4, non-orthogonal spatial directions (sharp left, sharp right, slight left, slight right) were included in addition to the three orthogonal spatial directions used in Experiments 1–3.
Table 1
Error rates as a function of cue format and trial type in Experiment 1.
| CUE FORMAT | M (SEM) ERROR RATE FOR VALID TRIALS | M (SEM) ERROR RATE FOR INVALID TRIALS |
|---|---|---|
| Scene | 2.07 (1.03) | 1.83 (1.23) |
| Schema | 1.46 (1.08) | 2.67 (1.29) |
| Word | 1.54 (1.00) | 2.67 (1.36) |
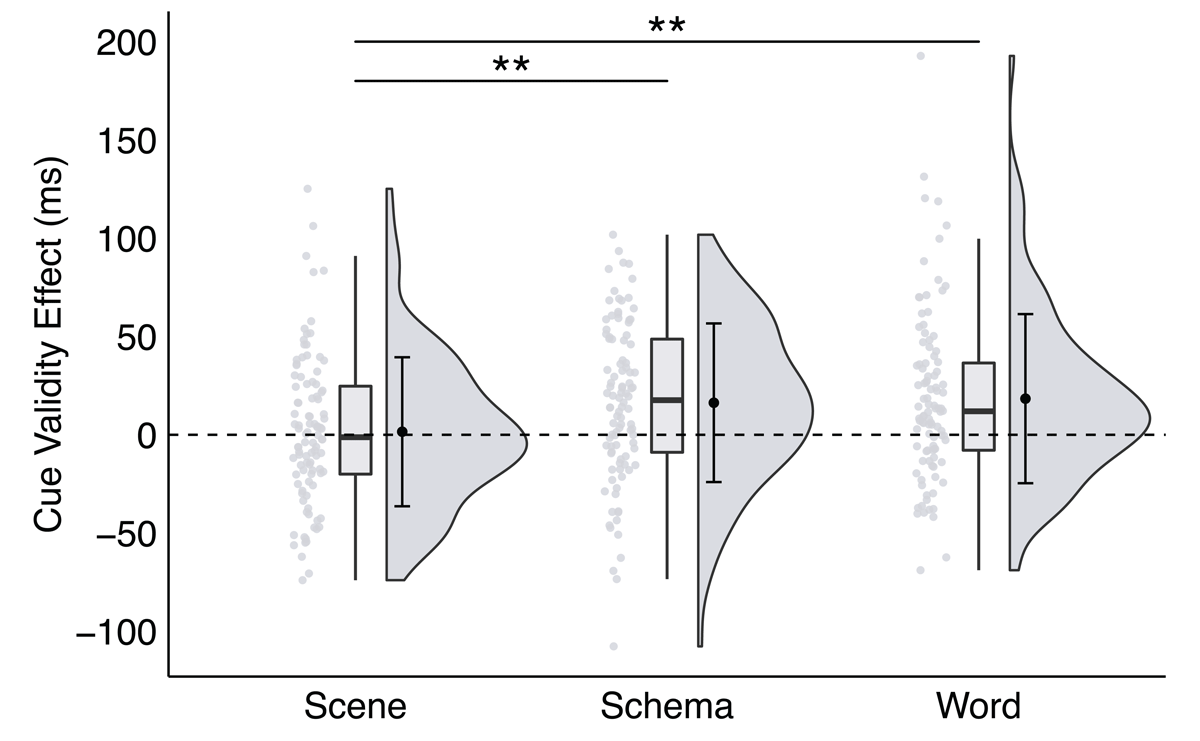
Figure 3
A significant interaction between trial type and cue format in Experiment 1, plotted as the cue validity effect as a function of cue format.
Note: Raincloud plots were generated for each cue format (see Allen et al., 2021). Scatter plots represent individual participant cue validity effects, box plots display sample median and interquartile range, and split-half violins illustrate probability distributions of sample variances. Group mean and ±1 standard deviation of each effect is plotted inside the corresponding split-half violin.
Note: * p < .035, ** p < .01, *** p < .001; critical α = .035.
Table 2
Error rates as a function of cue format and trial type in Experiment 2.
| CUE FORMAT | M (SEM) ERROR RATE FOR VALID TRIALS | M (SEM) ERROR RATE FOR INVALID TRIALS |
|---|---|---|
| Scene | 3.40 (0.42) | 2.31 (0.67) |
| Schema | 2.97 (0.35) | 3.47 (0.75) |
| Word | 2.94 (0.36) | 2.64 (0.61) |
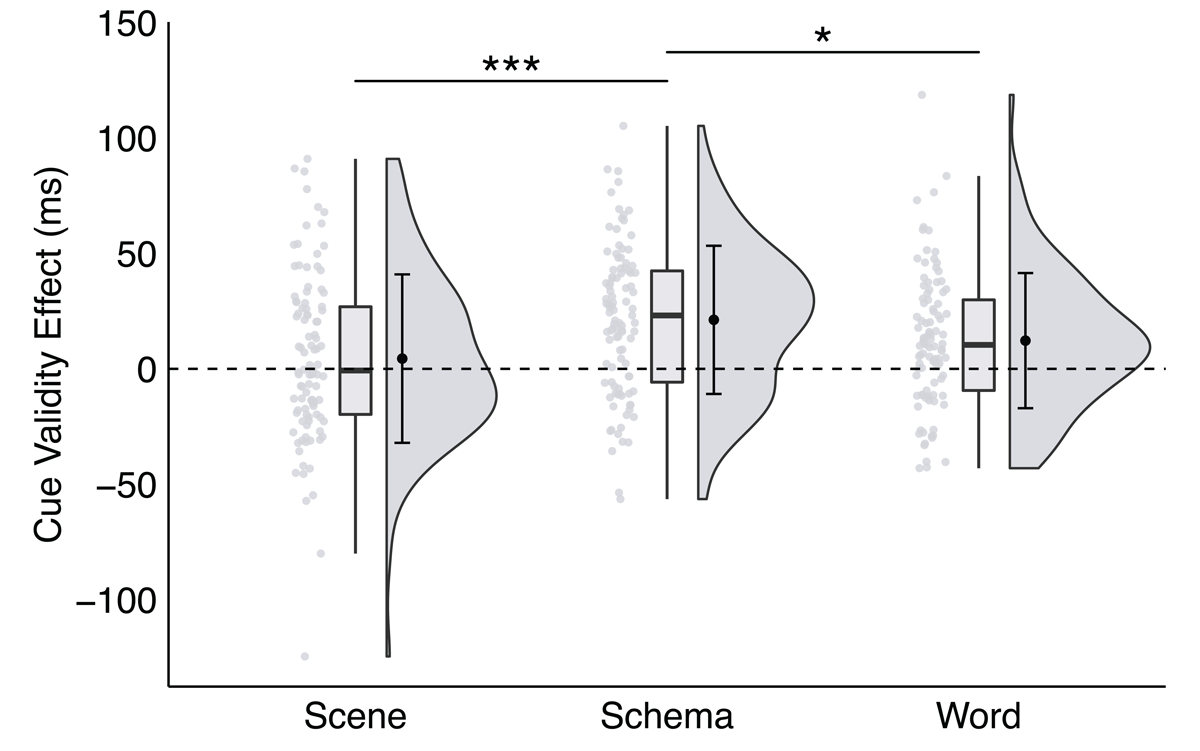
Figure 4
A significant interaction between trial type and cue format in Experiment 2, plotted as the cue validity effect as a function of cue format.
Note: * p < .035, ** p < .01, *** p < .001; critical α = .035.
Table 3
Error rates as a function of cue format, cue duration, and trial type in Experiment 3.
| CUE FORMAT | CUE DURATION | M (SEM) ERROR RATE FOR VALID TRIALS | M (SEM) ERROR RATE FOR INVALID TRIALS |
|---|---|---|---|
| Scene | 600 ms | 4.42 (0.52) | 3.14 (0.80) |
| 1200 ms | 4.39 (0.55) | 4.46 (0.84) | |
| 2400 ms | 4.92 (0.50) | 5.28 (0.88) | |
| Schema | 600 ms | 5.23 (0.52) | 4.62 (0.78) |
| 1200 ms | 4.42 (0.58) | 6.27 (0.96) | |
| 2400 ms | 4.70 (0.52) | 4.13 (0.86) | |
| Word | 600 ms | 4.53 (0.53) | 3.63 (0.76) |
| 1200 ms | 4.35 (0.62) | 5.78 (1.03) | |
| 2400 ms | 4.56 (0.52) | 5.28 (0.88) |
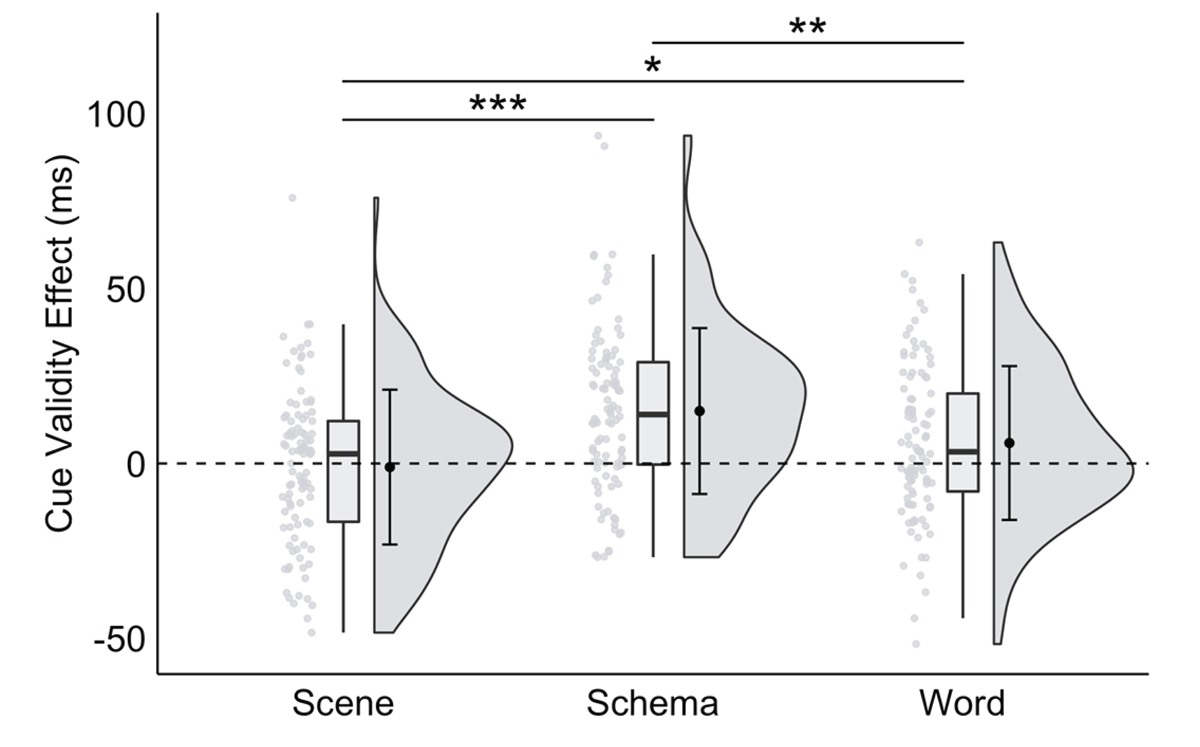
Figure 5
A significant interaction between trial type and cue format in Experiment 3, plotted as the cue validity effect as a function of cue format.
Note: * p < .035, ** p < .01, *** p < .001; critical α = .035.
Table 4
Error rates as a function of cue format, cue angle, and trial type in Experiment 4.
| CUE FORMAT | DIRECTION ANGLE | M (SEM) ERROR RATE FOR VALID TRIALS | M (SEM) ERROR RATE FOR INVALID TRIALS |
|---|---|---|---|
| Scene | Orthogonal | 3.78 (0.38) | 2.64 (0.65) |
| Sharp | 4.03 (0.42) | 3.47 (0.75) | |
| Slight | 3.04 (0.35) | 2.31 (0.62) | |
| Schema | Orthogonal | 2.55 (0.32) | 3.96 (0.91) |
| Sharp | 3.22 (0.38) | 2.64 (0.61) | |
| Slight | 2.90 (0.39) | 2.97 (0.72) | |
| Word | Orthogonal | 2.65 (0.36) | 3.14 (0.69) |
| Sharp | 2.72 (0.37) | 3.30 (0.74) | |
| Slight | 2.09 (0.29) | 2.81 (0.71) |
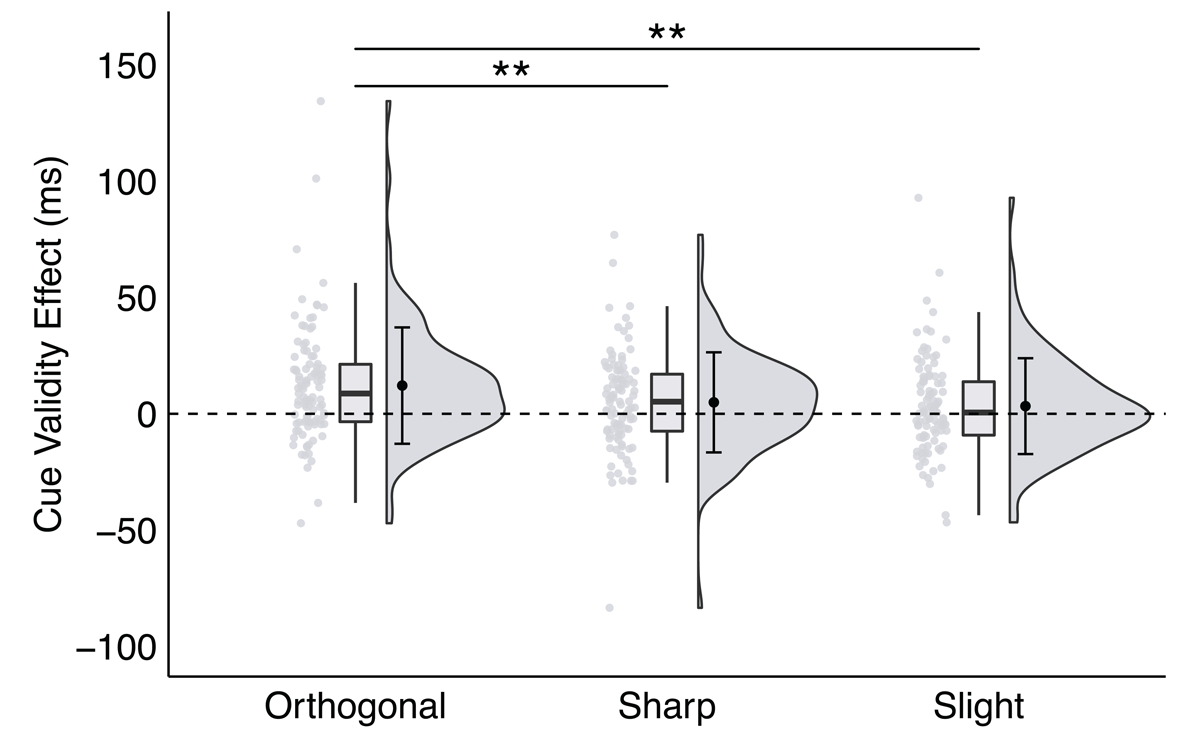
Figure 6
A significant interaction between trial type and direction angle in Experiment 4, plotted as the cue validity effect as a function of direction angle.
Note: * p < .035, ** p < .01, *** p < .001; critical α = .035.