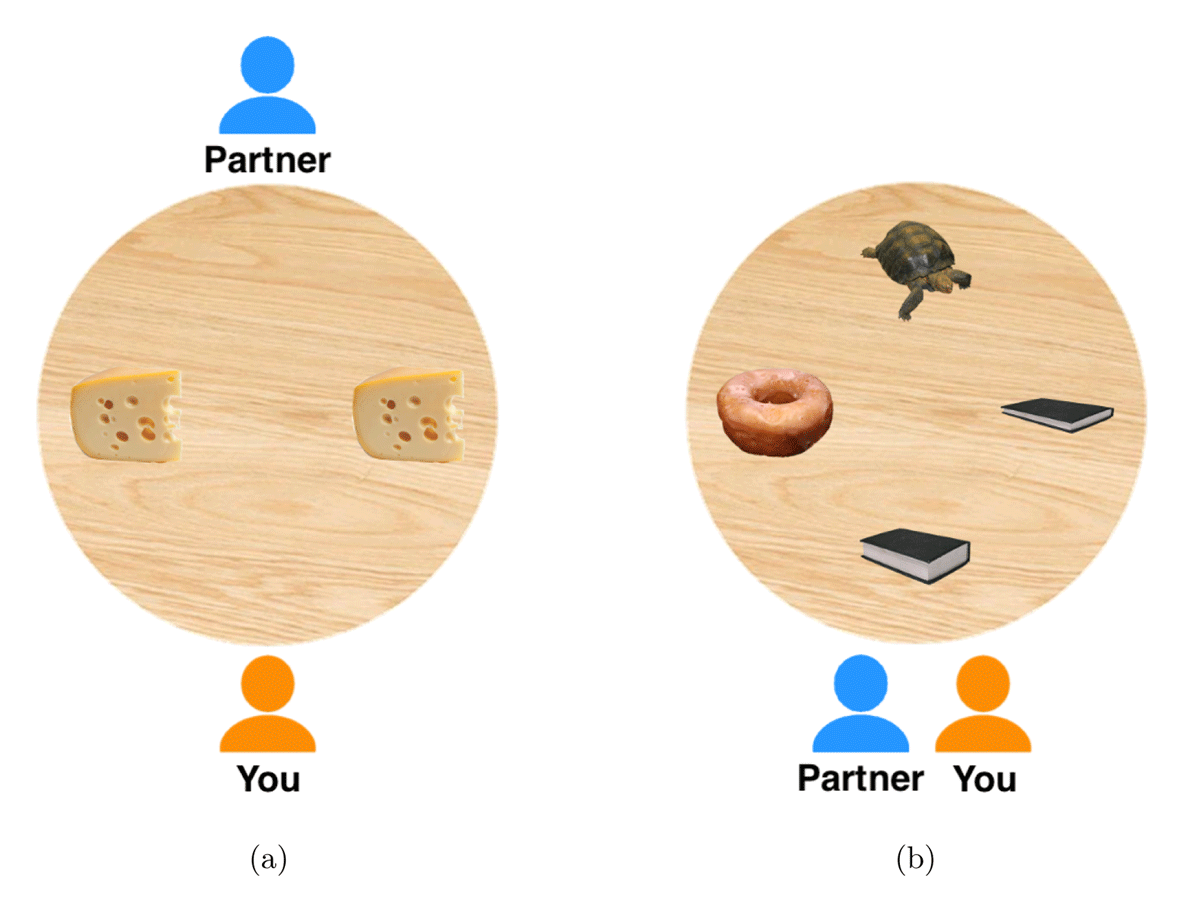
Figure 1
Example of (a) a critical trial in the different perspective condition with right/left ambiguity, and (b) a filler trial with size contrast (thin/thick book).
Table 1
Breakdown of display types in the experiment.
| TRIAL TYPE | DISPLAY TYPE | NO. OF OBJECTS | NO. OF TRIALS |
|---|---|---|---|
| critical | same perspective (left/right) | 2 | 4 |
| different perspective (left/right) | 2 | 4 | |
| same perspective (front/back) | 2 | 4 | |
| different perspective (front/back) | 2 | 4 | |
| filler | colour contrast | 2/3/4 | 12 |
| size contrast | 2/3/4 | 12 | |
| no contrast | 2/3/4 | 12 |
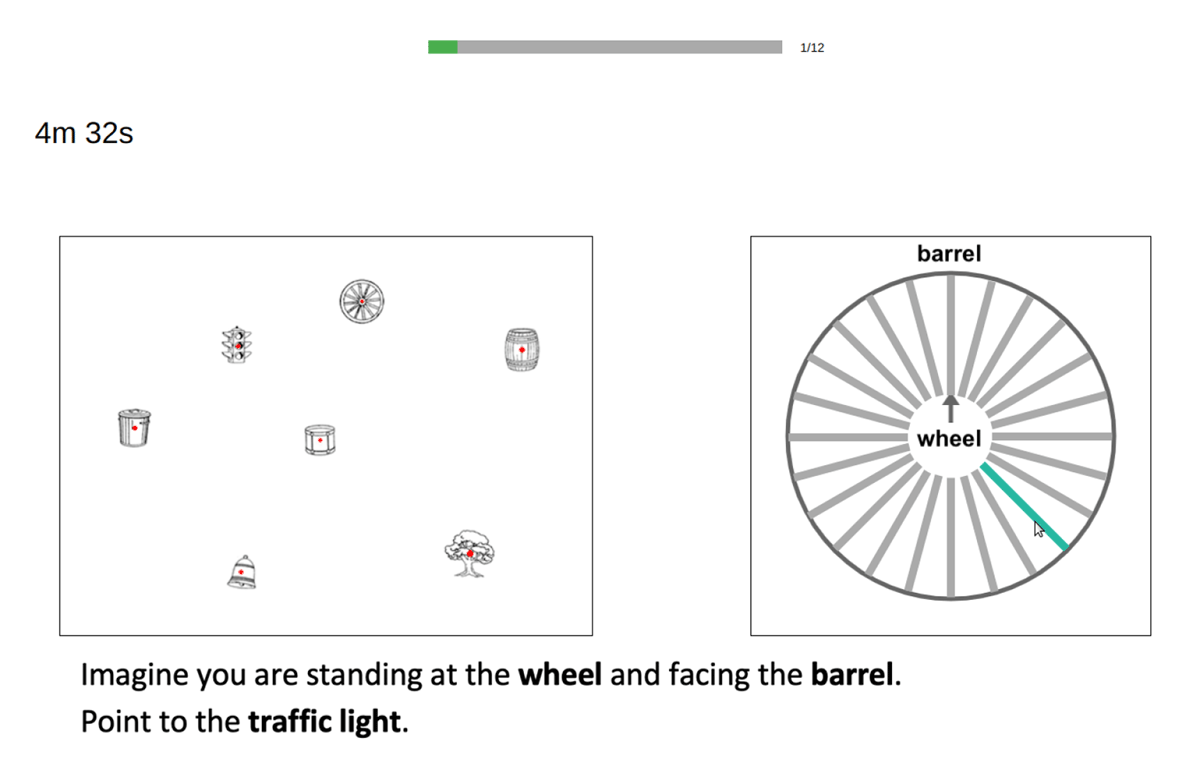
Figure 2
Example of the display participants saw in the OPT. Participants indicated their response by clicking on one of the 24 lines within the response circle, which would be highlighted when their mouse hovered over it.
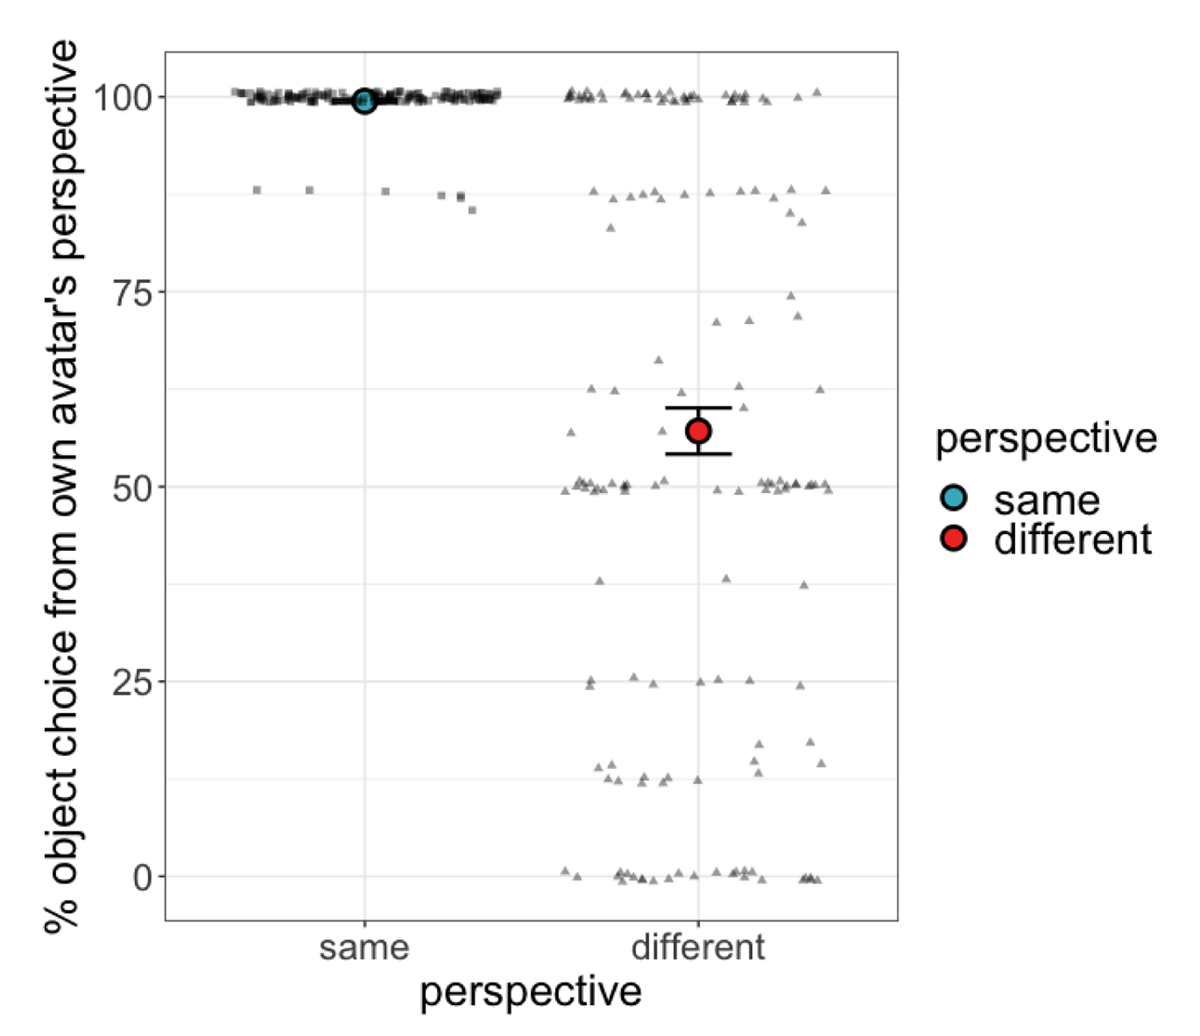
Figure 3
Percentage of trials on which participants chose the object from their own avatar’s perspective (on same perspective trials this was a shared perspective with the partner’s avatar; on different perspective trials this was across the table from the partner’s avatar and therefore reflects egocentric perspective taking by the participant). Error bars represent ±1 SE of by-participant means. Dots represent individual participants.
Table 2
Classification indices and fit statistics for LPA models.
| MODEL | GROUP DESCRIPTION | RATE (%) | % OF SAMPLE | AIC | BIC | ENTROPY | LOGLIK | C-CIV |
|---|---|---|---|---|---|---|---|---|
| Model 1 | 141.45 | 147.58 | 1.0 | –68.72 | 0.180 | |||
| — Group 1 | NA | 0.0 – 100.0 | 100.0 | |||||
| Model 2 | 111.43 | 123.70 | 0.73 | –51.71 | 0.219 | |||
| — Group 1 | Mixed (more othercentric) | 0.0 – <50.0 | 47.8 | |||||
| — Group 2 | Mixed (more egocentric) | 50.0 – 100.0 | 52.2 | |||||
| Model 3 | –3.88 | 14.53 | 0.98 | 7.94 | 5.05 | |||
| — Group 1 | Othercentric | 0.0 – <37.5 | 29.6 | |||||
| — Group 2 | Mixed | 37.5 – <75 | 30.2 | |||||
| — Group 3 | Egocentric | 75 – 100.0 | 40.3 | |||||
| Model 4 | –17.34 | 7.21 | 0.94 | 16.67 | –3.20 | |||
| — Group 1 | Othercentric | 0.0 – <12.5 | 15.7 | |||||
| — Group 2 | Mixed (more othercentric) | 12.5 – <37.5 | 13.8 | |||||
| — Group 3 | Mixed | 37.5 – <75.0 | 30.2 | |||||
| — Group 4 | Egocentric | 75.0 – 100.0 | 40.3 | |||||
| Model 5 | –38.20 | –7.51 | 0.97 | 29.10 | –1.24 | |||
| — Group 1 | Othercentric | 0 – <12.5 | 15.7 | |||||
| — Group 2 | Mixed (more othercentric) | 12.5 – <37.5 | 13.8 | |||||
| — Group 3 | Mixed | 24.5 – <62.5 | 30.6 | |||||
| — Group 4 | Mixed (more egocentric) | 62.5 – <83.3 | 6.3 | |||||
| — Group 5 | Egocentric | 83.3 – 100.0 | 39.6 |
[i] Notes: Rate = range of rate of egocentricism for group; AIC = Akaike Information Criterion; BIC = Bayesian Information Criterion; logLik = log likelihood of model; C-RIV = Composite Relative Importance Vector.
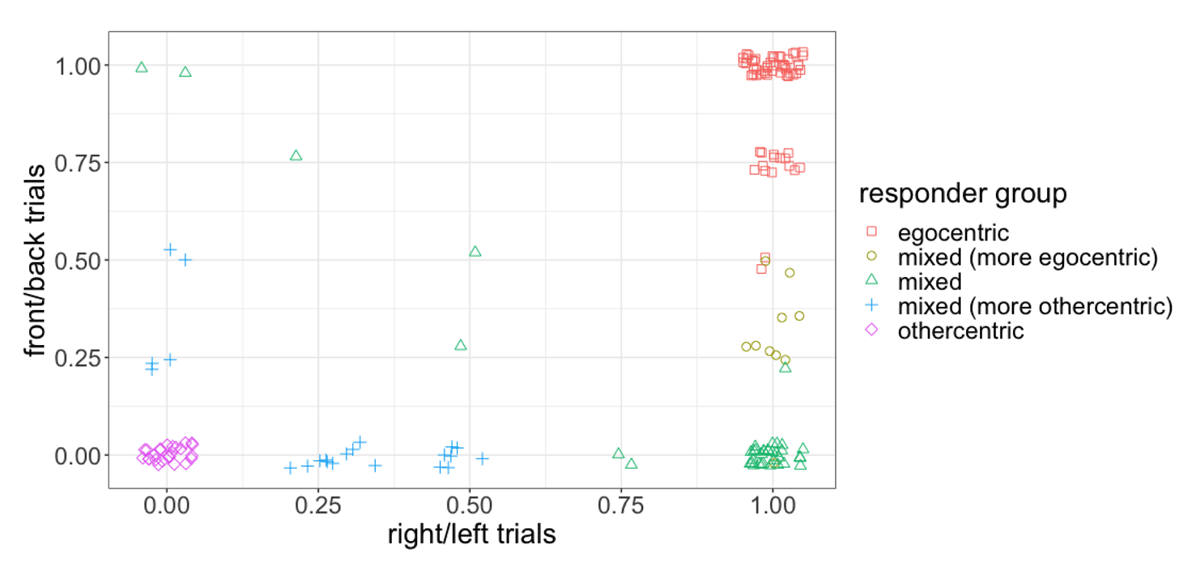
Figure 4
Mean rate of egocentricism on front/back and right/left trials. Each point represents a single participant.
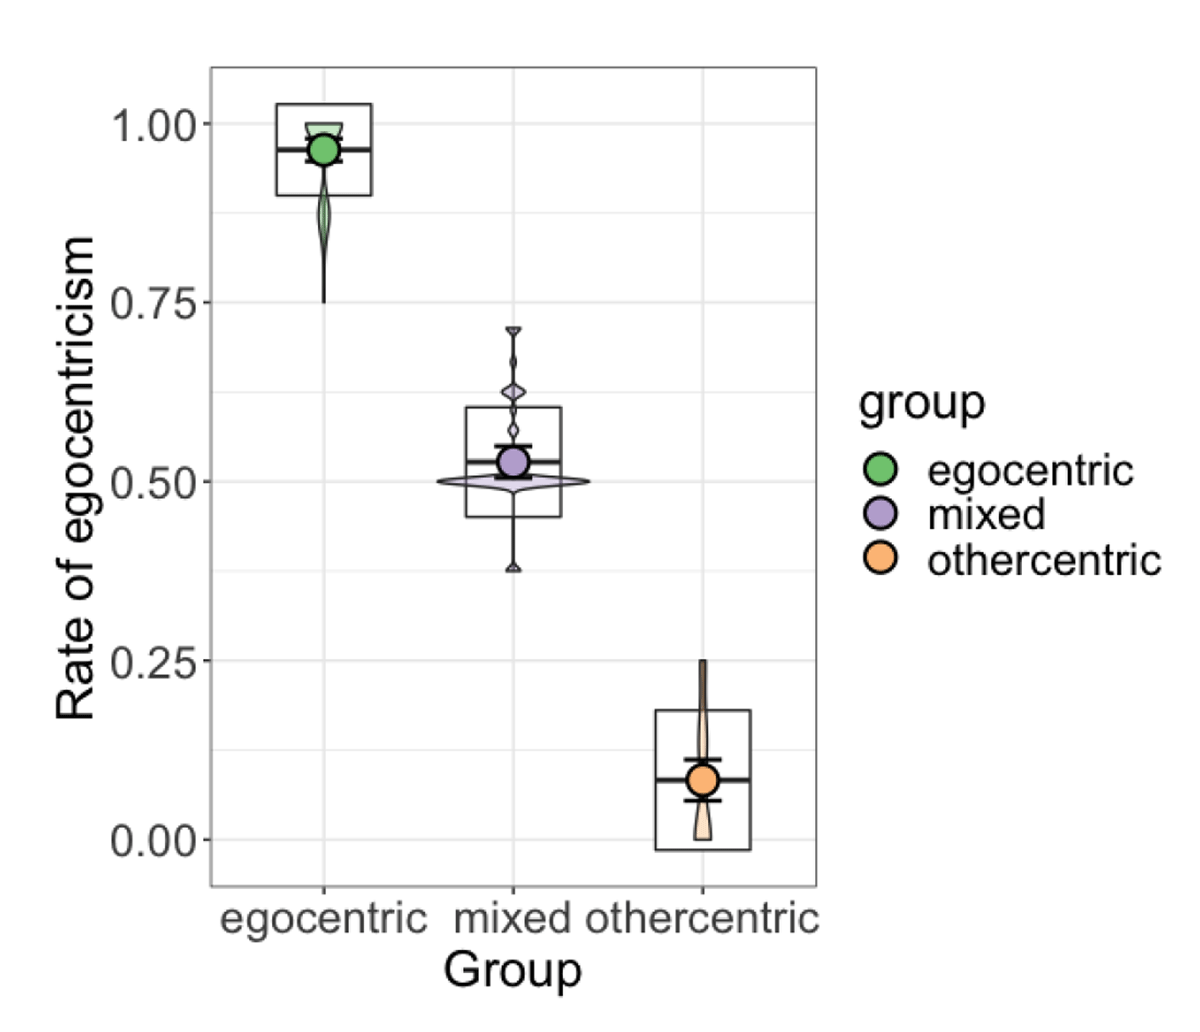
Figure 5
Mean rate of egocentricism for each group in the final three-group model. Boxplots represent ±1 standard deviation. Violin plots show data density.
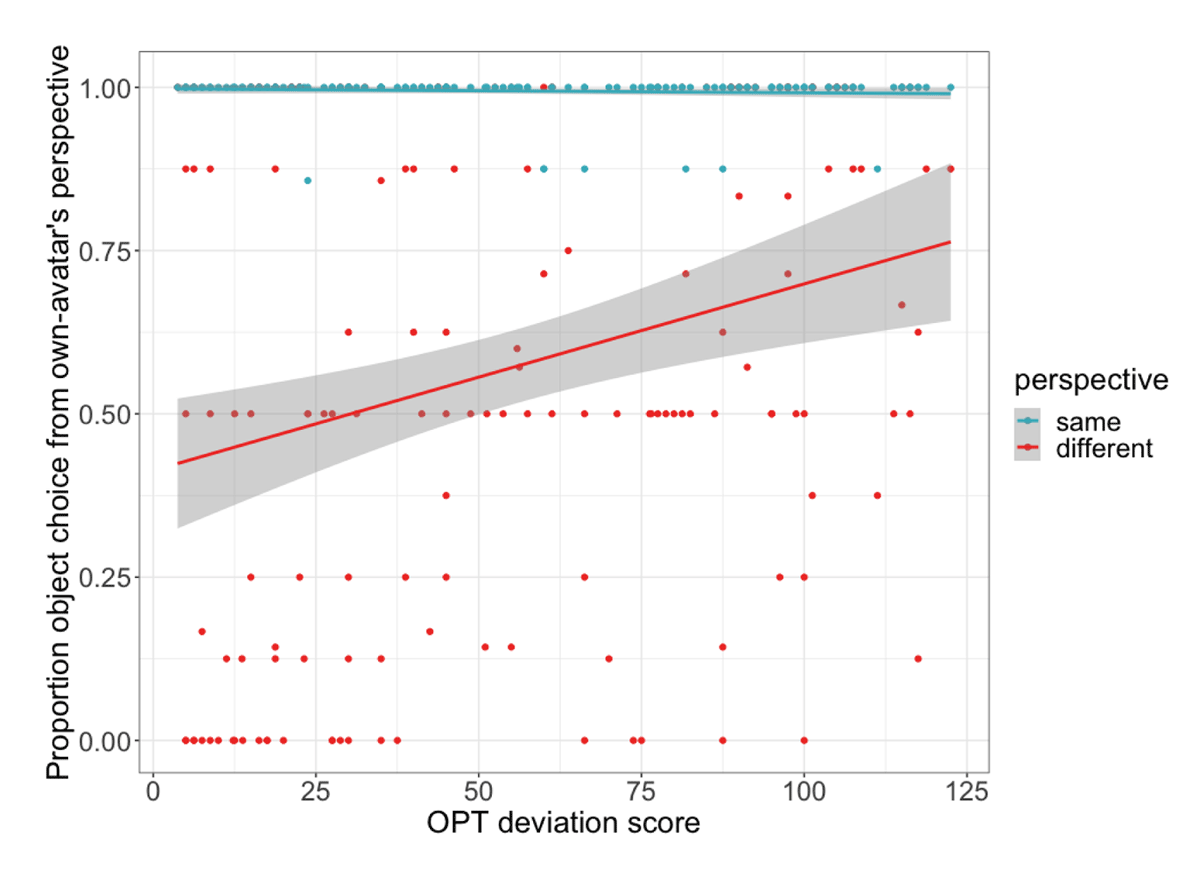
Figure 6
Relationship between participants’ OPT deviation score and the proportion of trials on which they selected the object from their own avatar’s perspective. On same perspective trials this was a shared perspective with the partner’s avatar; on different perspective trials this was across the table from the partner’s avatar and therefore reflects egocentric perspective taking. Higher OPT scores indicate poorer spatial orientation ability. Grey ribbons show 95% confidence intervals. Dots represent individual participants’ mean by perspective condition.
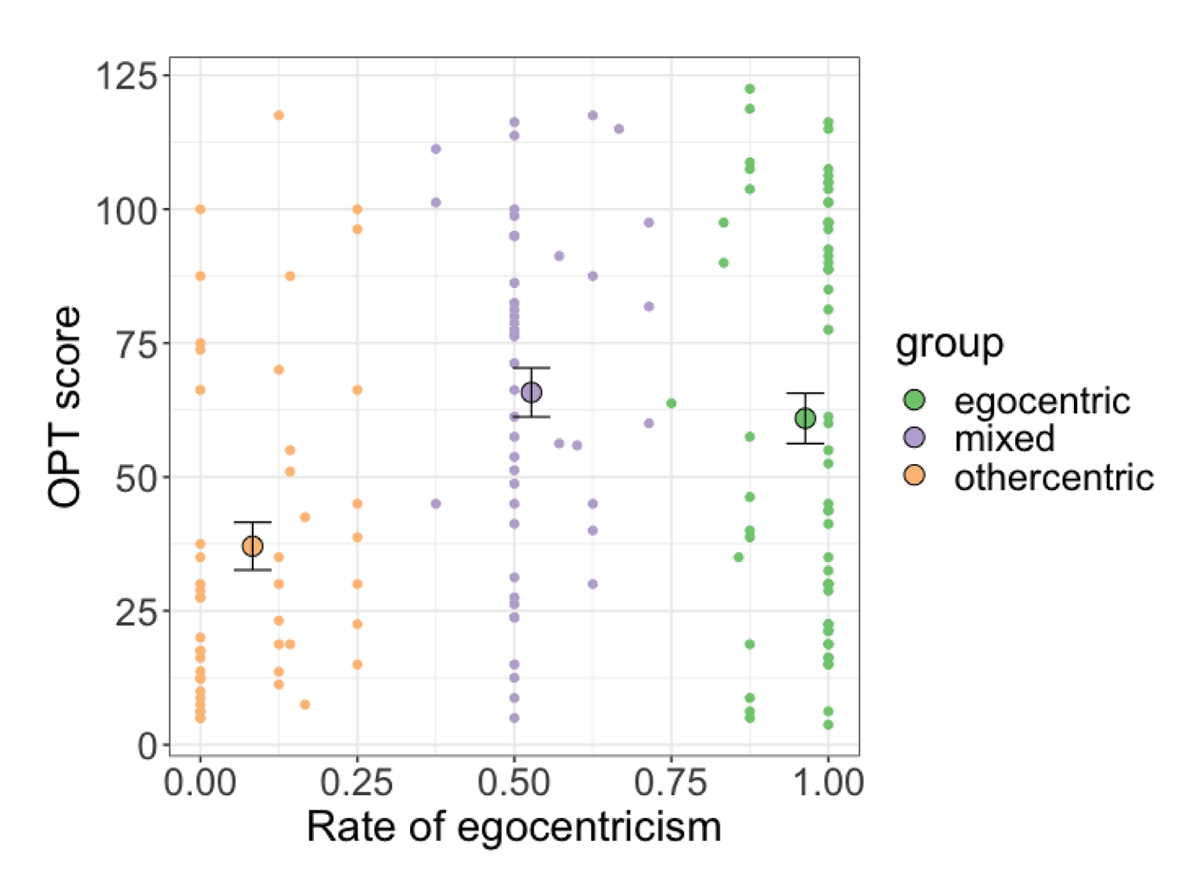
Figure 7
Mean rate of egocentricism and OPT deviation score for the three latent groups. Error bars represent ±1 standard error of group OPT score means. Dots represent individual participant points.
Table 3
Full model output including perspective, all three individual difference measures, and age and gender on the outcome variable of whether participants selected the object from their own avatar’s perspective. On different perspective trials this reflects whether participants took their own or their partner’s spatial perspective. Individual difference measures and age were scaled and centred by converting to z-scores. Perspective and gender were sum-coded (perspective: same –0.5, different +0.5; gender: female –0.5, male +0.5).
| β | Z | SE | P | 95% CI | |
|---|---|---|---|---|---|
| (Intercept) | 3.01 | 0.24 | 12.30 | <.001 | [2.53, 3.49] |
| perspective | –4.59 | 0.48 | –9.49 | <.001 | [–5.54, –3.64] |
| AQss+c | –0.10 | 0.23 | –0.40 | .69 | [–0.55, 0.37] |
| OPT score | –0.20 | 0.24 | –0.84 | .40 | [–0.27, 0.67] |
| Stroop difference | –0.02 | 0.22 | –0.08 | .94 | [–0.45, 0.42] |
| perspective:AQss+c | –0.23 | 0.46 | –0.49 | .62 | [–1.13, 0.67] |
| perspective:OPT score | 1.21 | 0.47 | 2.58 | .01 | [0.29, 2.13] |
| perspective:Stroop difference | 0.45 | 0.43 | 1.06 | .29 | [–0.39, 1.30] |
| perspective:age | 0.39 | 0.39 | 1.00 | .31 | [–0.38, 1.16] |
| perspective:gender | –0.08 | 0.84 | –0.09 | 0.93 | [–1.56, 1.72] |
Table 4
Exploratory analyses with individual AQ subscales and the full AQ: Perspective by AQ (subscale) interaction results for each model. Note that these were run as separate linear mixed effects regression models in which we replaced our AQss+c measure with each subscale measure in turn.
| MODEL WITH | β | Z | SE | P | 95% CI |
|---|---|---|---|---|---|
| AQ (communication) | 0.21 | 0.47 | 0.45 | .65 | [–0.72, 1.14] |
| AQ (detail) | –0.15 | 0.44 | –0.33 | .74 | [–1.01, 0.71] |
| AQ (imagination) | –0.52 | 0.50 | –1.04 | .30 | [–1.51, 0.46] |
| AQ (social) | –0.39 | 0.35 | –1.12 | .26 | [–1.08, 0.29] |
| AQ (switching) | –0.93 | 0.51 | –1.84 | .07 | [–1.94, 0.06] |
| AQ (full) | –0.19 | 0.24 | –0.77 | .44 | [–0.65, 0.29] |
Table 5
Mean, standard deviation, minimum, and maximum scores for individual differences measures used in the study.
| MEAN | SD | MIN | MAX | |
|---|---|---|---|---|
| AQss+c | 45.8 | 11.3 | 20 | 71 |
| OPT | 55.4 | 35.7 | 3.8 | 122.5 |
| Stroop | 182.5 | 75.1 | 36.4 | 400.6 |
[i] Notes: AQ = Autism Quotient (combined score derived from social+communication subscales); OPT = Object Perspective Task; Stroop = Stroop difference score (mean incongruent – congruent RT).
Table 6
Correlation between individual difference measures used in the study.
| AQSS+C | OPT | STROOP | |
|---|---|---|---|
| AQss+c | 1.00 | – | – |
| OPT | –0.22 | 1.00 | – |
| Stroop | 0.15 | 0.02 | 1.00 |
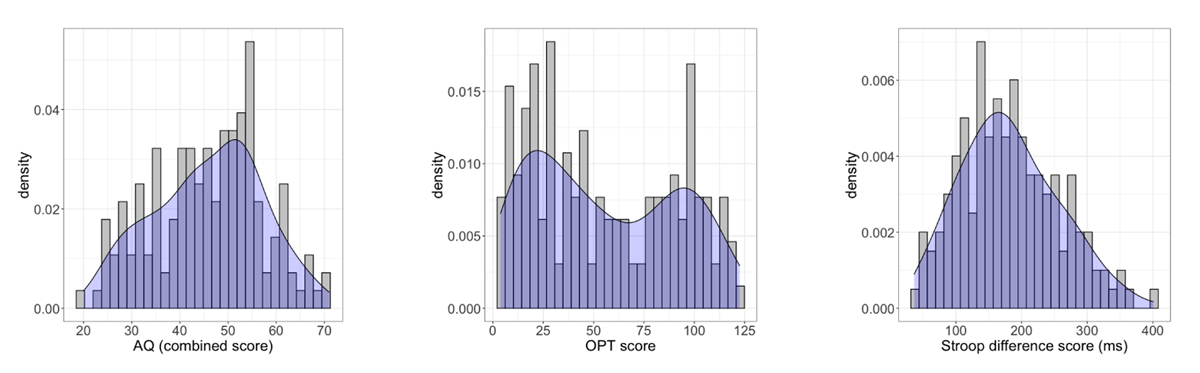
Figure 8
Distribution and density plots for participants’ AQ (combined), OPT, and Stroop difference scores.
Table 7
Mean, standard deviation, minimum, and maximum scores for individual AQ subscales and the full AQ.
| SUBSCALE | MEAN | SD | MIN | MAX |
|---|---|---|---|---|
| Communication | 20.7 | 5.2 | 10 | 33 |
| Detail | 23.7 | 5.3 | 12 | 39 |
| Imagination | 20.6 | 4.7 | 11 | 34 |
| Social | 25.2 | 7.0 | 10 | 39 |
| Switching | 26.5 | 5.0 | 15 | 38 |
| Full AQ | 116.9 | 19.2 | 72 | 177 |
Table 8
Correlations between AQ subscale scores.
| COMMUNICATION | DETAIL | IMAGINATION | SOCIAL | SWITCHING | |
|---|---|---|---|---|---|
| Communication | 1.00 | – | – | – | – |
| Detail | 0.13 | 1.00 | – | – | – |
| Imagination | 0.49 | 0.15 | 1.00 | – | – |
| Social | 0.70 | 0.00 | 0.55 | 1.00 | – |
| Switching | 0.56 | 0.04 | 0.35 | 0.61 | 1.00 |