
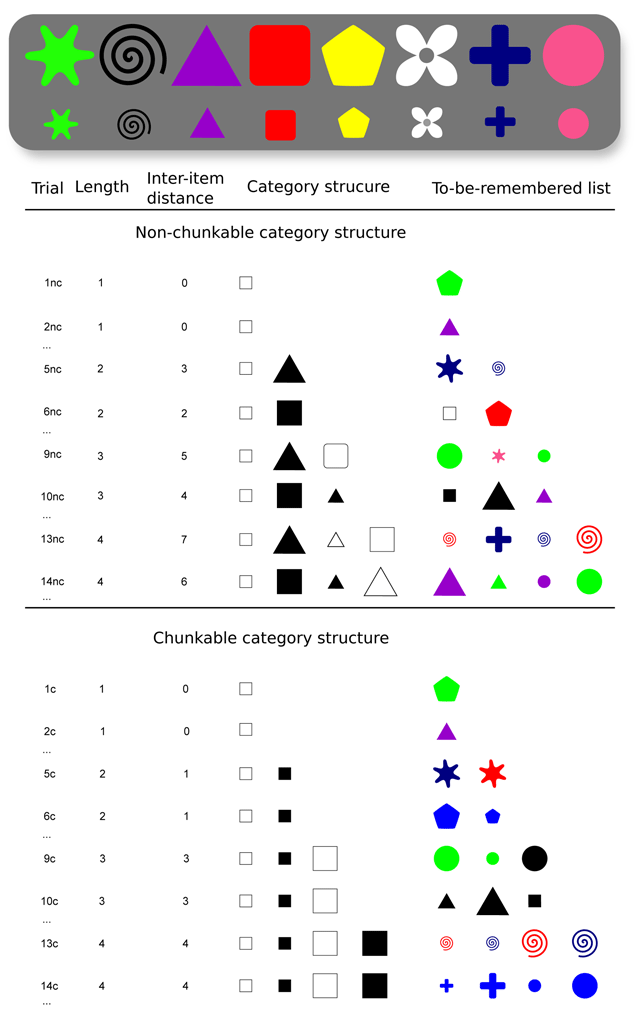
Figure 1
(Top) A sample of stimuli based on eight shapes, eight colors and two types of sizes. (Bottom) Table showing a sample of trials. Trials are indexed using ‘nc’ and ‘c’ to easily refer to the respective non-chunkable and chunkable condition in the text. The first half of the table shows the sequences of the non-chunkable condition. The second half of the table shows the sequences of the chunkable condition. For each sequence length, we chose to represent only two trials. Dimension values were chosen randomly for each trial. For instance, the given category structure  (i.e., square, small first, white-black within sizes) could be converted into either
  (i.e., white, small first, triangle-square within sizes), or
  (i.e., large, black first, square-triangle within colors), etc. The preceding example only involve the dimension values square, triangle white and black, but again, the dimension values were actually randomly picked among the 8 shapes and the 8 colors shown in the top panel, and using two sizes randomly.
Table 1
Mean span (and standard errors), by procedure (simple vs. complex span tasks) and category set complexity (chunkable vs. non-chunkable), and mean chunking scores.
| Non-Chunkable | Chunkable | Chunking score (global) | Chunking score (individual) | |
|---|---|---|---|---|
| Simple Span | 2.49(.06) | 4.05(.11) | 1.63 | 1.70(.05) |
| Complex Span | 1.45(.06) | 2.2(.09) | 1.52 | 1.76(.12) |
[i] Note. The global chunking scores are simply based on the two average values of the same line in the table (e.g., 4.05/2.49 = 1.63). The individual chunking scores were figured out on a ratio separately for each participant (standard errors are in parentheses).
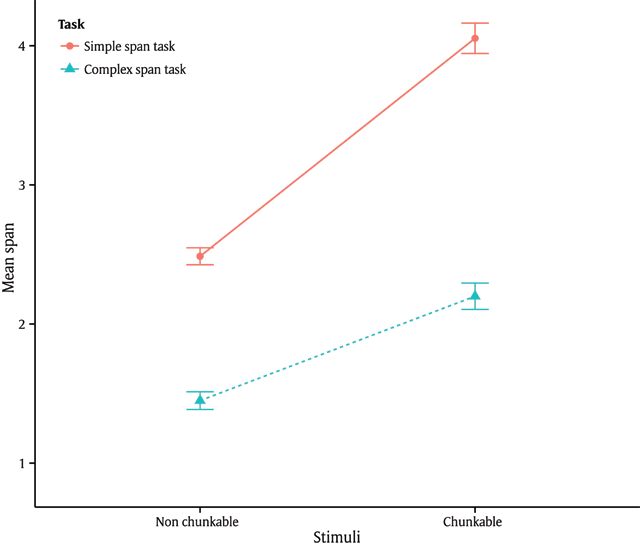
Figure 2
Mean span by procedure (simple vs. complex span tasks) and category set complexity (chunkable vs. non-chunkable). Error bars represent +/– one standard error.