
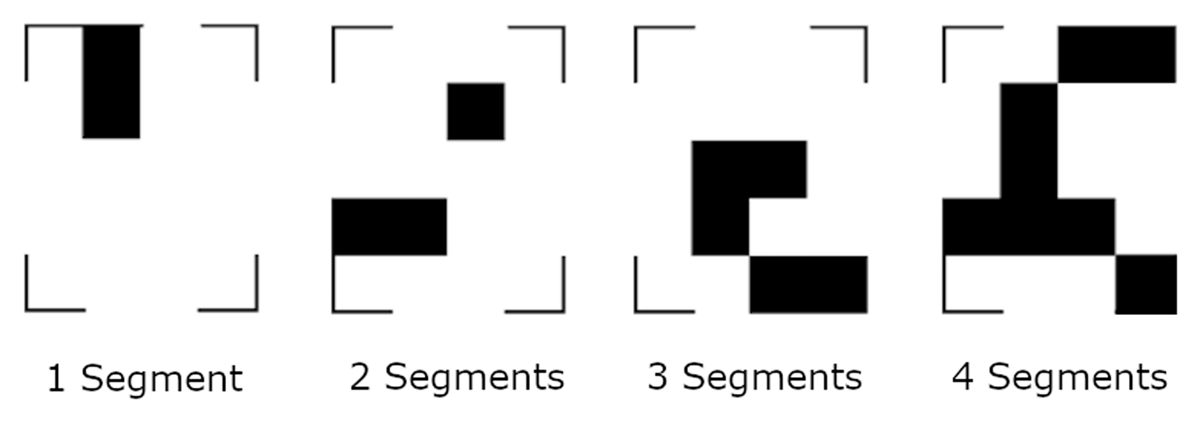
Figure 1
Examples for the stimuli of four different complexities. The segments were allowed to touch.
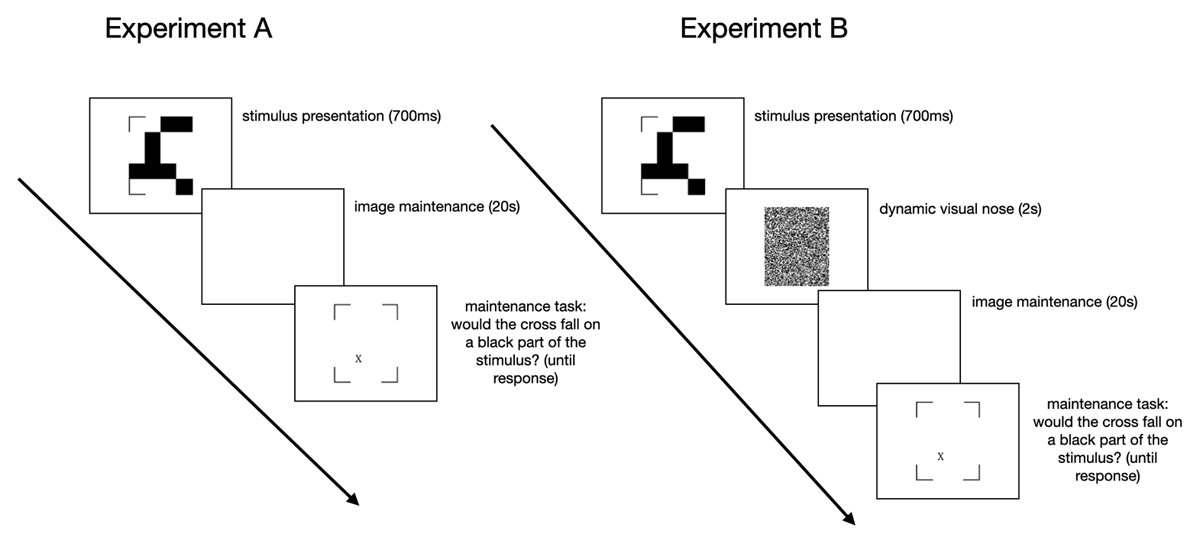
Figure 2
Timeline of the stimuli in the maintenance task.
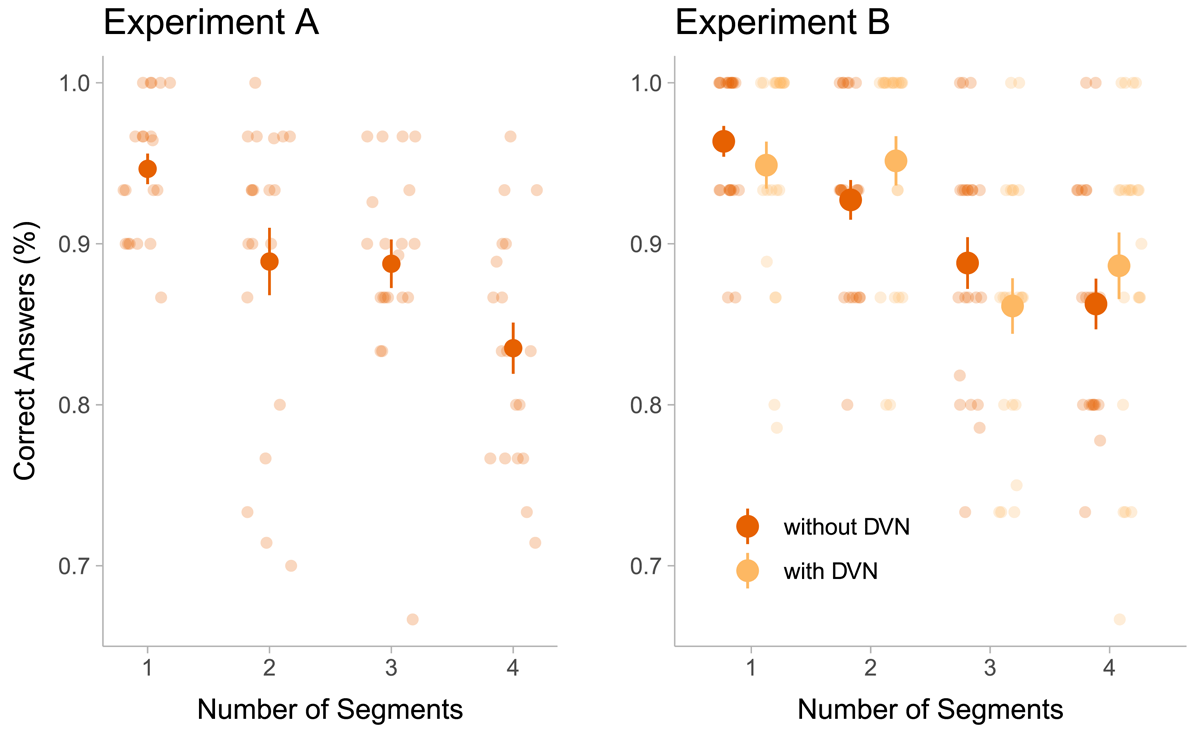
Figure 3
Performance in the maintenance task in Experiment A and B as a function of the number of segments in a stimulus. Opaque points indicate the mean across participants, and error bars indicate the standard error of the mean. In Experiment B, two seconds of dynamic visual noise (DVN) between the stimulus and the blank screen were introduced in half of the trials. The trials without DVN in Experiment B were identical to the trials in Experiment A. Transparent points show the average performance of individual participants over trials with the respective number of segments. Given that each participant absolved 120 trials in total, the points in the figure of Experiment A represent the average of 30 trials (120 trials/4 levels of segments), while the points in Experiment B represent the average accuracy of 15 trials (120 trials/4 levels of segments/2 levels of DVN).
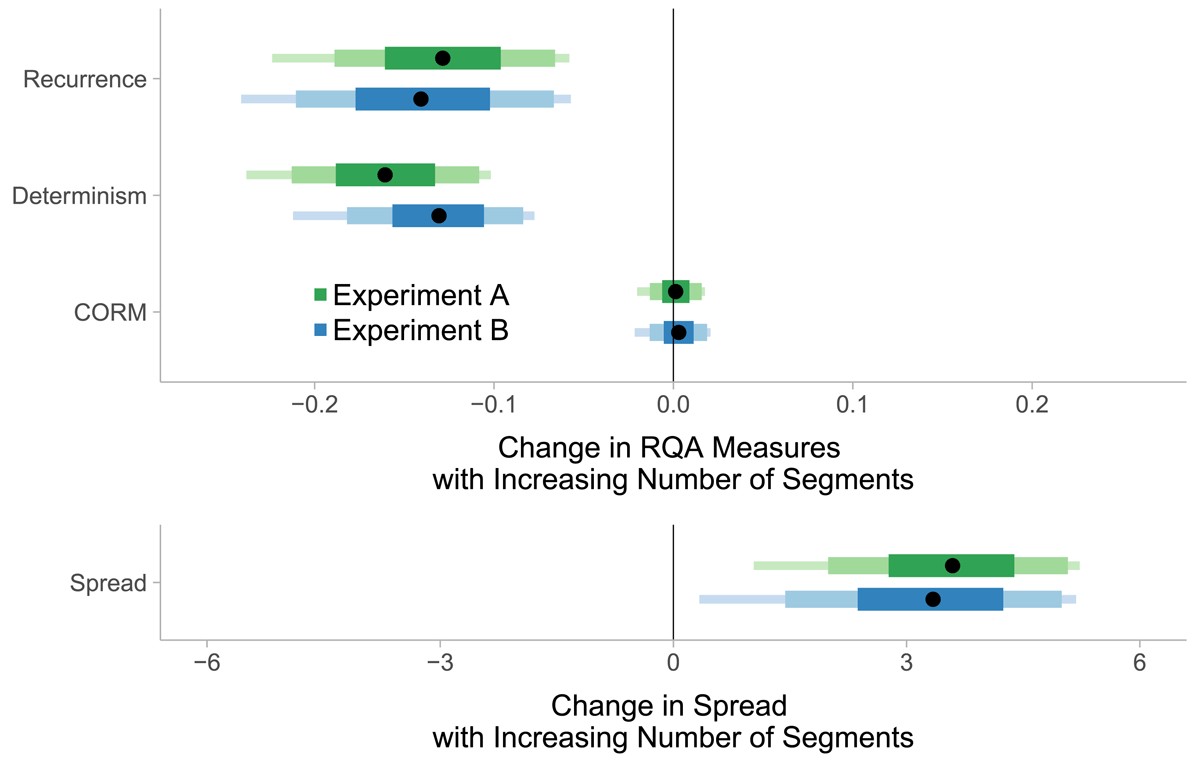
Figure 4
Estimated posterior distributions of the effect of number of segments on recurrence, determinism, CORM, and on the spread of fixations. The distributions indicate how the gaze dynamics and fixation spread change as the number of segments increases by one. Recurrence and determinism decrease and the spread of fixations increases as the number of segments increases, whereas the CORM value remains unaltered. The segments of the bars represent 90%, 80% and 50% of the posterior distributions and the black points represent their median.
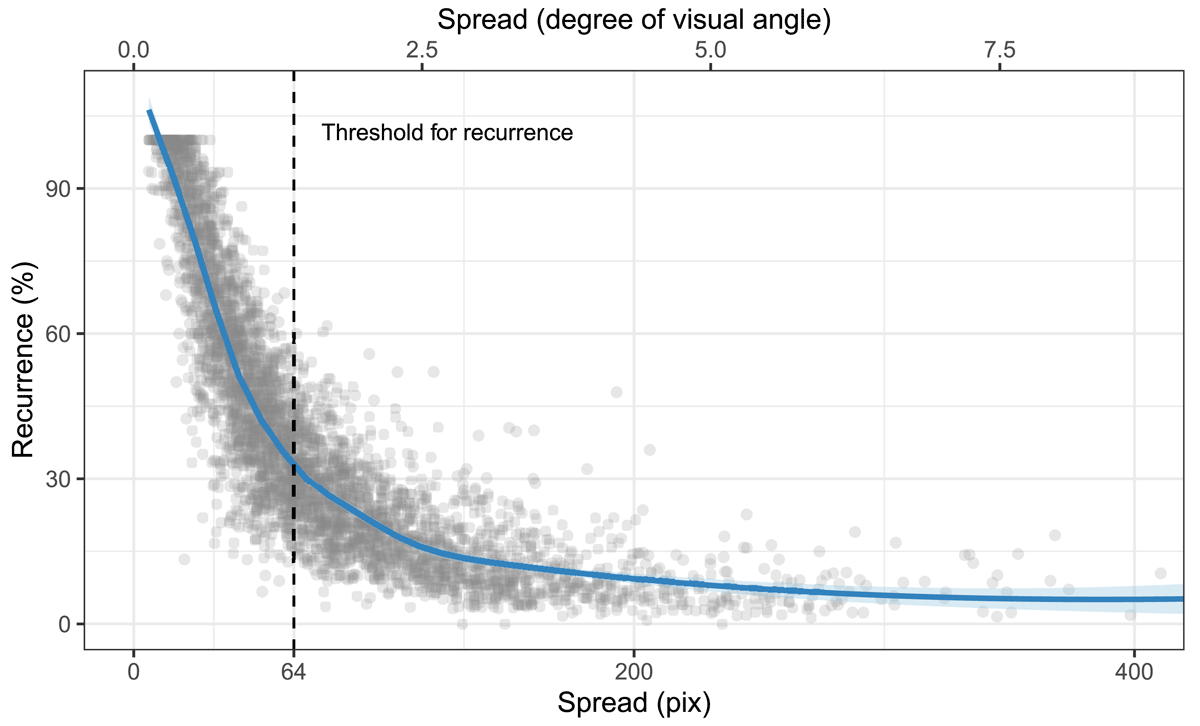
Figure 5
Relationship between the spread of fixations and recurrence. The dashed line shows the threshold distance between two fixations used to define refixations. Although theoretically possible, no trials show high recurrence and a high spread of fixations at the same time (no points are in the upper-right corner of the plot). Refixations in mental imagery happen predominantly in combination with low spread of fixations (gaze restriction). The plot has been truncated after 400.
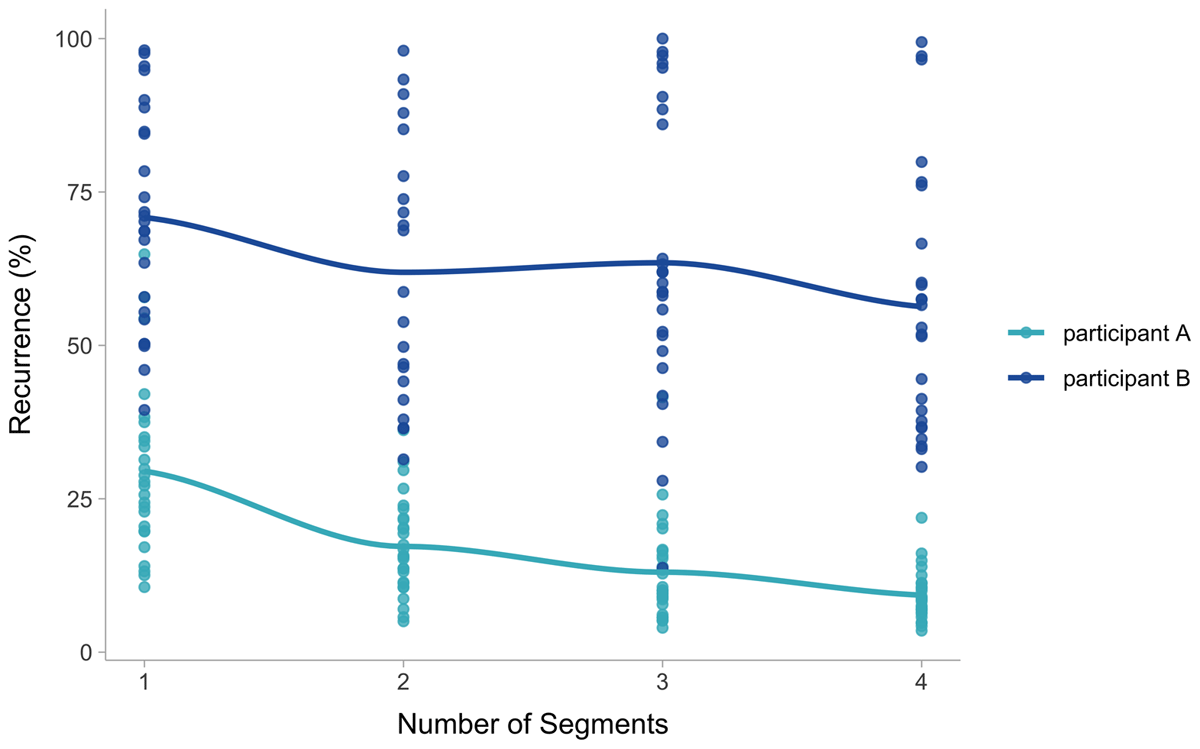
Figure 6
Differences between two participants. Although both show very different degrees of recurrence, the effect of the number of segments is similar. The two participants are chosen to optimally illustrate the statistical finding.
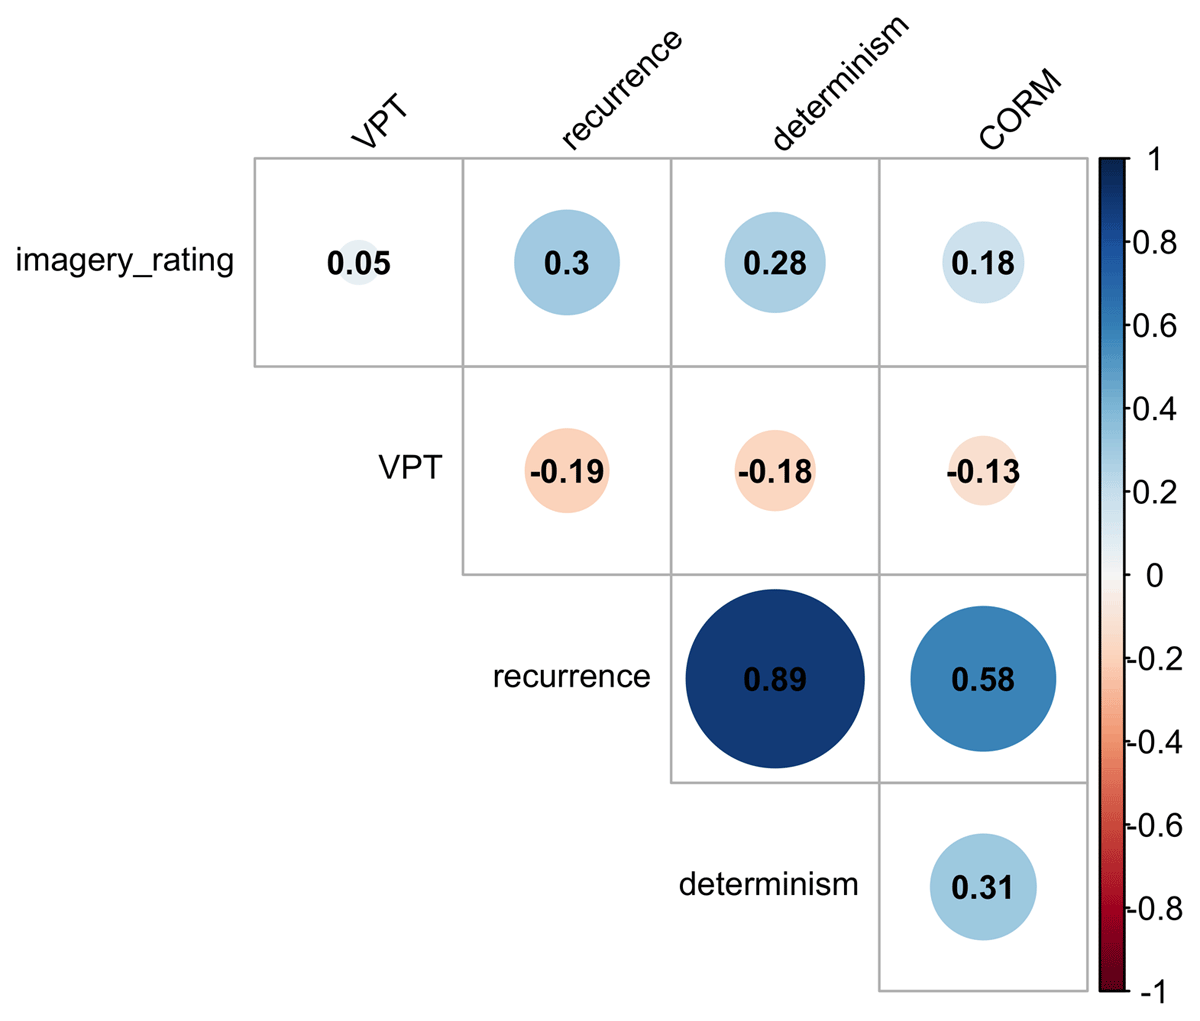
Figure 7
Correlations between measures of temporal gaze dynamics and mental imagery. VPT refers to participants’ score in the Visual Pattern Test. Only the RQA parameters recurrence, determinism and CORM correlate significantly (p < 0.01, adjusted for multiple comparisons).