
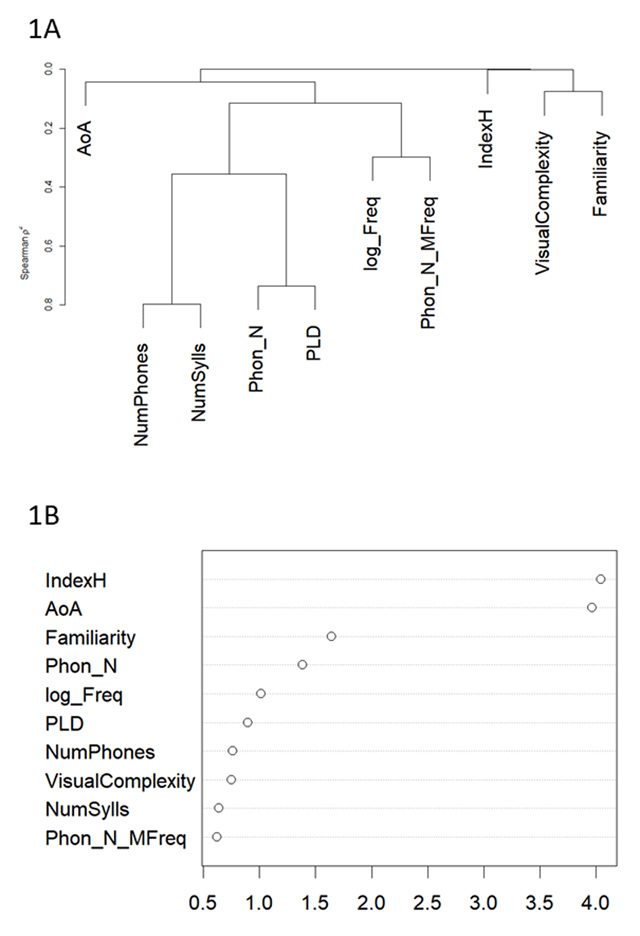
Figure 1
A: Hierarchical clustering analysis using Spearman’s p² for naming latencies within man-made items. B: Variable importance plot obtained through random forest analysis for the same set of predictors within man-made items.
Table 1
The fit indices on the naming latencies analysis on control predictors for man-made items.
| Model | Fixed effects | Model Df | χ2 | P | BIC | Δbic | Approx. BF |
|---|---|---|---|---|---|---|---|
| M0 | 4 | 1119 | |||||
| M1 | Visual complexity | 5 | <.01 | =.99 | 1127 | –8.43 | .014 |
| M2 | Fam | 5 | 13.09 | <.001 | 1114 | 4.65 | 10.27 |
| M3 | Fam + H | 6 | 54.57 | <.001 | 1068 | 46.13 | >10000 |
| M4 (Control) | Fam + H + AoA | 7 | 42.63 | <.001 | 1034 | 34.19 | >10000 |
| M5 | Fam + H + AoA + Log_Freq | 8 | 0.06 | =.79 | 1042 | –8.37 | 0.015 |
| M6 | Fam + H + AoA + NumPhones | 8 | 1.61 | =.2 | 1041 | –6.82 | 0.033 |
| M7 | Fam + H + AoA + Phon_N | 8 | 6.33 | =.011 | 1036 | –2.11 | 0.34 |
| M8 | Fam + H + AoA + Phon_N_MFreq | 8 | 1.52 | =.21 | 1041 | –6.82 | 0.031 |
[i] Note: Df = degree of freedom; P = probability value; BIC = Bayesian Information Criterion; Δbic = differences between the last model that displayed a significant increase in terms of explained variance and the current model; Approx. BF = Bayes Factor’s (BF) approximation, exp(Δbic/2). Fam = Familiariy. Log_Freq = log word frequency. In Bold the Control Model.
Table 2
The fit indices on the naming latencies analysis on manipulability predictors for man-made items. NumActions = Number of Actions.
| Model | Fixed effects | Model Df | Chisq | P | BIC | Δbic | Approx. BF |
|---|---|---|---|---|---|---|---|
| Control | Fam + H + AoA | 7 | |||||
| Grasp | Fam + H + AoA + Grasp | 8 | 17.587 | <.001 | 1025 | 9.13 | 96.39 |
| Pantomime | Fam + H + AoA + Pantomime | 8 | 22.56 | <.001 | 1020 | 14.12 | 1168.72 |
| Move | Fam + H + AoA + Move | 8 | 14.44 | <.001 | 1028 | 6.01 | 20.15 |
| NumActions | Fam + H + AoA + NumActions | 8 | 6.38 | =.011 | 1036 | –2.057 | 0.35 |

Figure 2
Effects of the predictors Grasp, Pantomime and Move on the naming latencies.
Table 3
The fit indices on the Accuracy analysis for man-made items.
| Model | Fixed effects | Model Df | Chisq | P | BIC | Δbic | Approx. BF |
|---|---|---|---|---|---|---|---|
| M0 | 3 | 3103 | |||||
| Control | Fam + H + AoA | 6 | 72.57 | <.001 | 3056 | 46.96 | >1000 |
| Grasp | Fam + H + AoA + Grasp | 7 | 6.02 | =.014 | 3058 | –2.52 | 0.283 |
| Pantomime | Fam + H + AoA + Pantomime | 7 | 5.46 | =.019 | 3059 | –3.08 | 0.214 |
| Move | Fam + H + AoA + Move | 7 | 3.99 | =.045 | 3060 | –4.54 | 0.102 |
| NumActions | Fam + H + AoA + NumActions | 7 | 3.52 | =.061 | 3061 | –5.02 | 0.081 |