
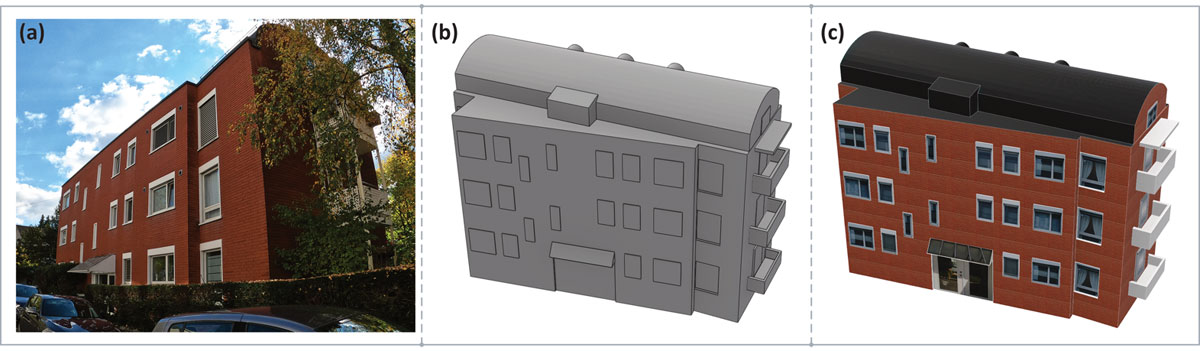
Figure 1
(a) Example landmark from the route. (b) Example depiction of the landmark in the abstract condition. (c) depiction of the landmark in the realistic condition.
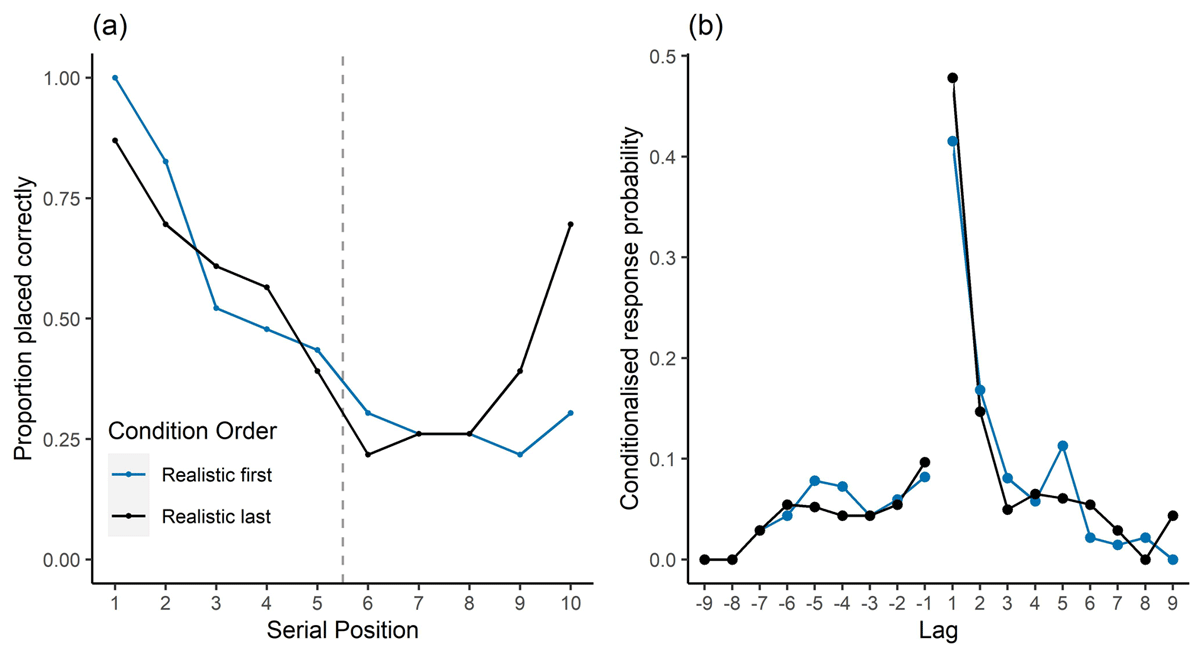
Figure 2
(a) Serial position curves revealing strong primacy effects for both conditions, but only recency in the realistic last condition. The dashed line indicates position where landmark visualisation style changed along the route; (b) Lag conditionalised response probabilities (lag-CRPs) with a peak at +1, showing forward contiguity effects in reconstruction of landmark order.