
Table 1
Overview of Cognitive Psychology Studies Comparing MTurk or Prolific Data to Students or the Literature.
| CROWDSOURCE VS. LITERATURE | MAIN OUTCOME |
|---|---|
| Barnhoorn, Haasnoot, Bocanegra, Steenbergen, 2014 | Successful replication of effects from the domain of experimental psychology on MTurk: Stroop, attentional blink, masked priming. |
| Bui, Myerson & Hale, 2015 | Successful replication of effects from the domain of cognitive aging on MTurk: age-related decline in processing speed, effect of practice on age differences, steeper decline in visuospatial processing, mediation of the link between age and working memory by processing speed. |
| Crump, McDonnell, & Gureckis, 2013 | Successful replication of effects from the domain of experimental psychology on MTurk: Stroop, Switching, Flanker, Simon, Posner Cuing, attentional blink, subliminal priming, and category learning. |
| Kochari, 2019 | Successful replication of effects from the domain of numerical cognition on Prolific: distance effect, congruity effect, priming effect. |
| Simcox & Fiez, 2014 | Successful replication of effects from the domain of experimental psychology on MTurk: Flanker, lexical decision. |
| Yang & Krajbich, 2021 | Successful replication of the effect of gaze duration in decision-making using an eye-tracking paradigm on MTurk. |
| Zwaan & Pecher, 2012 | Partial replication of mental simulation effects in language comprehension on MTurk: orientation match, shape match, color match. |
| CROWDSOURCE VS. LAB DATA | OUTCOME |
| Armitage & Eerola, 2020 | Testing an experimental effect in domain of musical cognition in the lab and on MTurk: music valence priming. The effect was consistently present and data characteristics were similar between MTurk and the lab. |
| Pauszek, Sztybel, & Gibson, 2017 | Successful replication of benchmark effects from the spatial cueing paradigm on MTurk: left/right advantage, cue type effect, cued axis effect, and cued endpoint effect. |
| Lumsden, Skinner, Woods, Lawrence, & Munafò, 2016 | Testing a Go-No-Go task in the lab and on MTurk. Reaction times were longer for MTurk, and accuracy was lower, but data quality remained acceptable. |
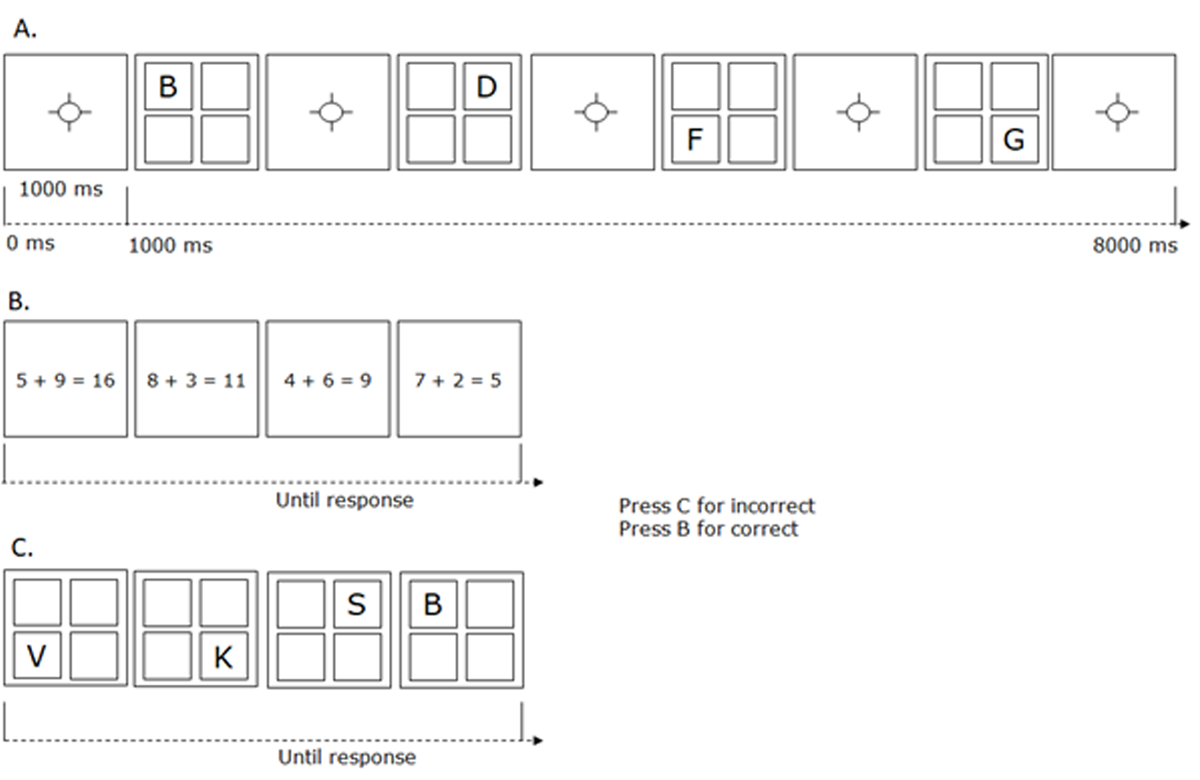
Figure 1
Schematic illustration of the experimental paradigm.
Note: Panel A shows the presentation phase of memory items. Panel B shows the processing phase. Panel C shows the memory testing phase. Responses to the processing and test items were provided by pressing the B-key with the right index finger for either a correct problem or test item, and the C-key with the left index finger for either an incorrect problem or test item. Of the processing episodes, 50% corresponded to a correct problem and 50% corresponded to an incorrect problem. Each of the four grid positions was probed at the end of each trial, 48.2% of these probes were items from the to-be-remembered list.
Table 2
Overview of the proportion of data patterns that do not meet our criteria for each participant pool.
| TESTING MODALITY | LAB-TESTED | WEB-TESTED | |||||
|---|---|---|---|---|---|---|---|
| PARTICIPANT POOL | STUDENTS | FISHER | STUDENTS | FISHER | PROLIFIC | FISHER | |
| Step 1 N | 40 | 215 | 300 | 196 | |||
| % anomalous samples | 7.5 | 8.4 | 9.3 | 17.3 | |||
| 95% CI | [2.6, 19.9] | ≈ | [5.4, 12.8] | ≈ | [6.5, 13.2] | p < .05 | [12.7, 23.3] |
| Step 2 N | 37 | 197 | 272 | 162 | |||
| % no verbal disruption effect | 0 | 16.2 | 16.9 | 42 | |||
| 95% CI | [0.0, 9.4] | p < .05 | [11.7, 22.0] | ≈ | [12.9, 21.8] | p < .001 | [34.6, 50.0] |
| Step 3 N | 37 | 165 | 226 | 94 | |||
| No rehearsal primacy effect | 5.4 | 5.5 | 5.3 | 27.7 | |||
| 95% CI | [1.5, 17.7] | ≈ | [2.9, 10.0] | ≈ | [3.1, 9.1] | p < .001 | [19.6, 37.4] |
| Final N | 35 | 156 | 214 | 68 | |||
| % of total remaining | 87.6% | 72.6% | 71.3% | 34.7% | |||
| 95% CI | [73.9, 94.5] | ≈ | [66.2, 78.1] | ≈ | [66.0, 76.2] | p < .001 | [28.4, 41.6] |
[i] Note: The comparisons between participant pools consisted of Fisher exact tests. For each criterion and for each participant pool, we indicated how many participants remained in the sample on which the criterion was evaluated. For each sample, we indicated what percentage did not meet the criterion. For each percentage of data patterns that did not meet the criterion, we presented the 95% Wilson confidence interval, suitable for binomial data and small samples.
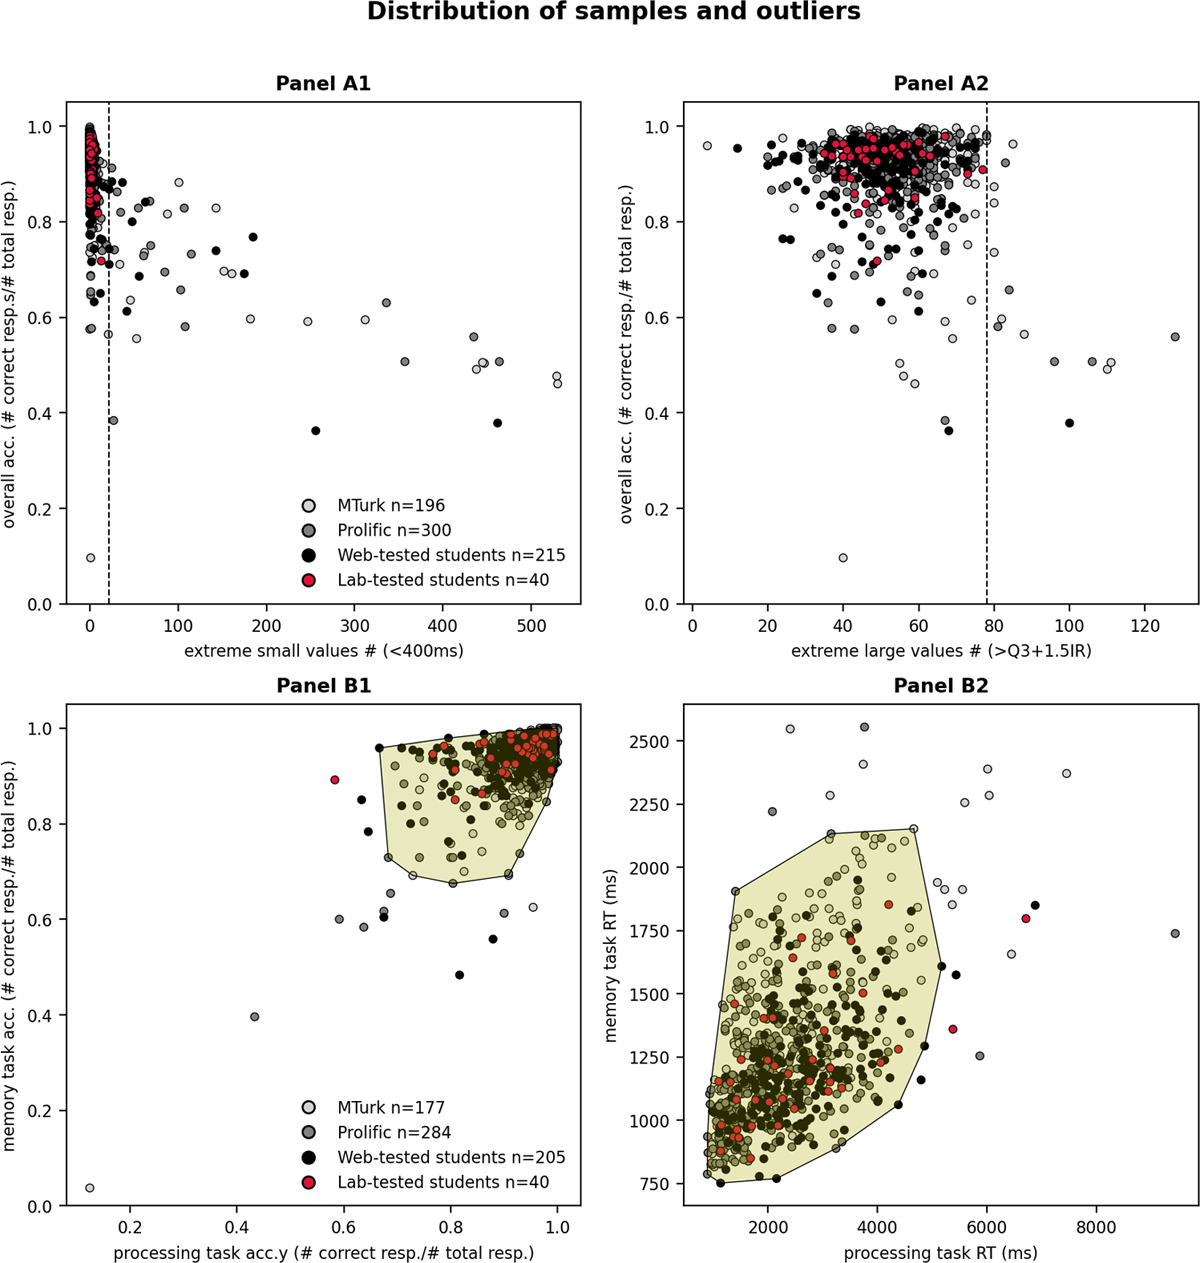
Figure 2
Distribution of data patterns with indication of anomalous data patterns in data from MTurk, Prolific, web-tested students and lab-tested students.
Note: Panel A1 x-axis contains the number of extremely small values for each data pattern (< 400 ms) and Panel A2 x-axis contains the number of extremely large values (>Q3 + 1.5IR) for each data pattern. Accuracy for all trials is plotted on the y-axis. The participant pool and testing modality of each data pattern is indicated by the colour according to the legend. Our clustering method identified anomalous patterns which had many extreme values as indicated by the dashed lines. Panel B1 x-axis contains the median processing accuracy, and the y-axis contains the median memory accuracy. Panel B2 x-axis contains the median processing RT, and the y-axis contains the median memory RT. Our clustering method identified all patterns outside of the yellow zone as outliers in terms of accuracy and RT.
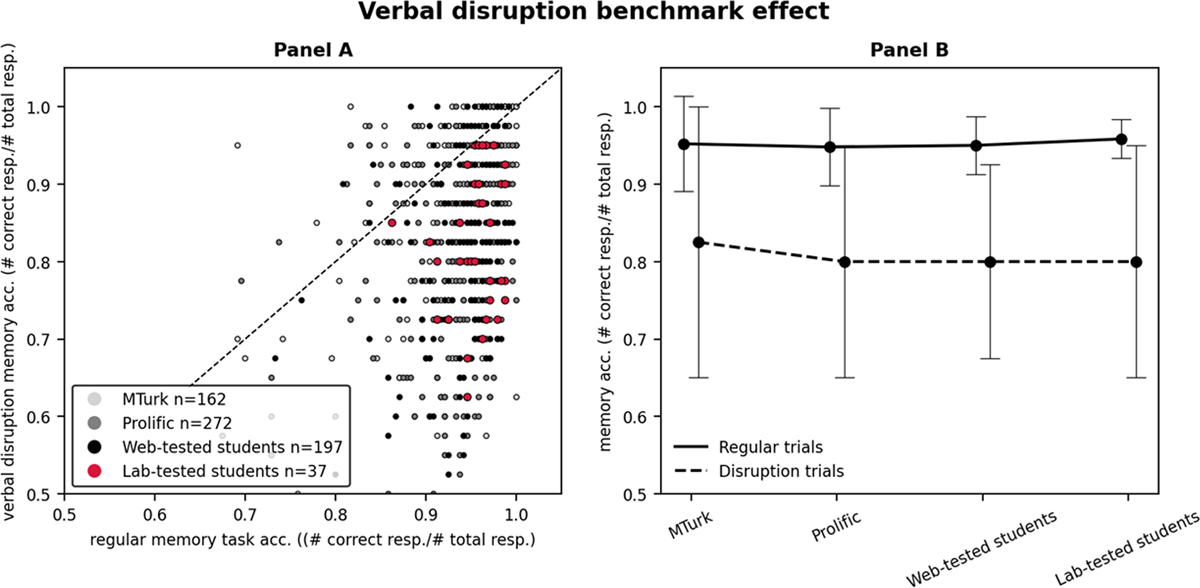
Figure 3
Verbal disruption benchmark effect.
Note: Panel A x-axis indicates the regular memory accuracy for each data pattern. The y-axis indicates the verbal disruption memory accuracy. Patterns below the diagonal line present the verbal disruption benchmark effect. Panel B contains the participant pools on the x-axis. The black lines show median memory accuracy on regular and verbal disruption trials, for patterns that showed this effect. The error bars are the interquartile range, to give an indication of the middle range of performance for regular and verbal disruption trials.
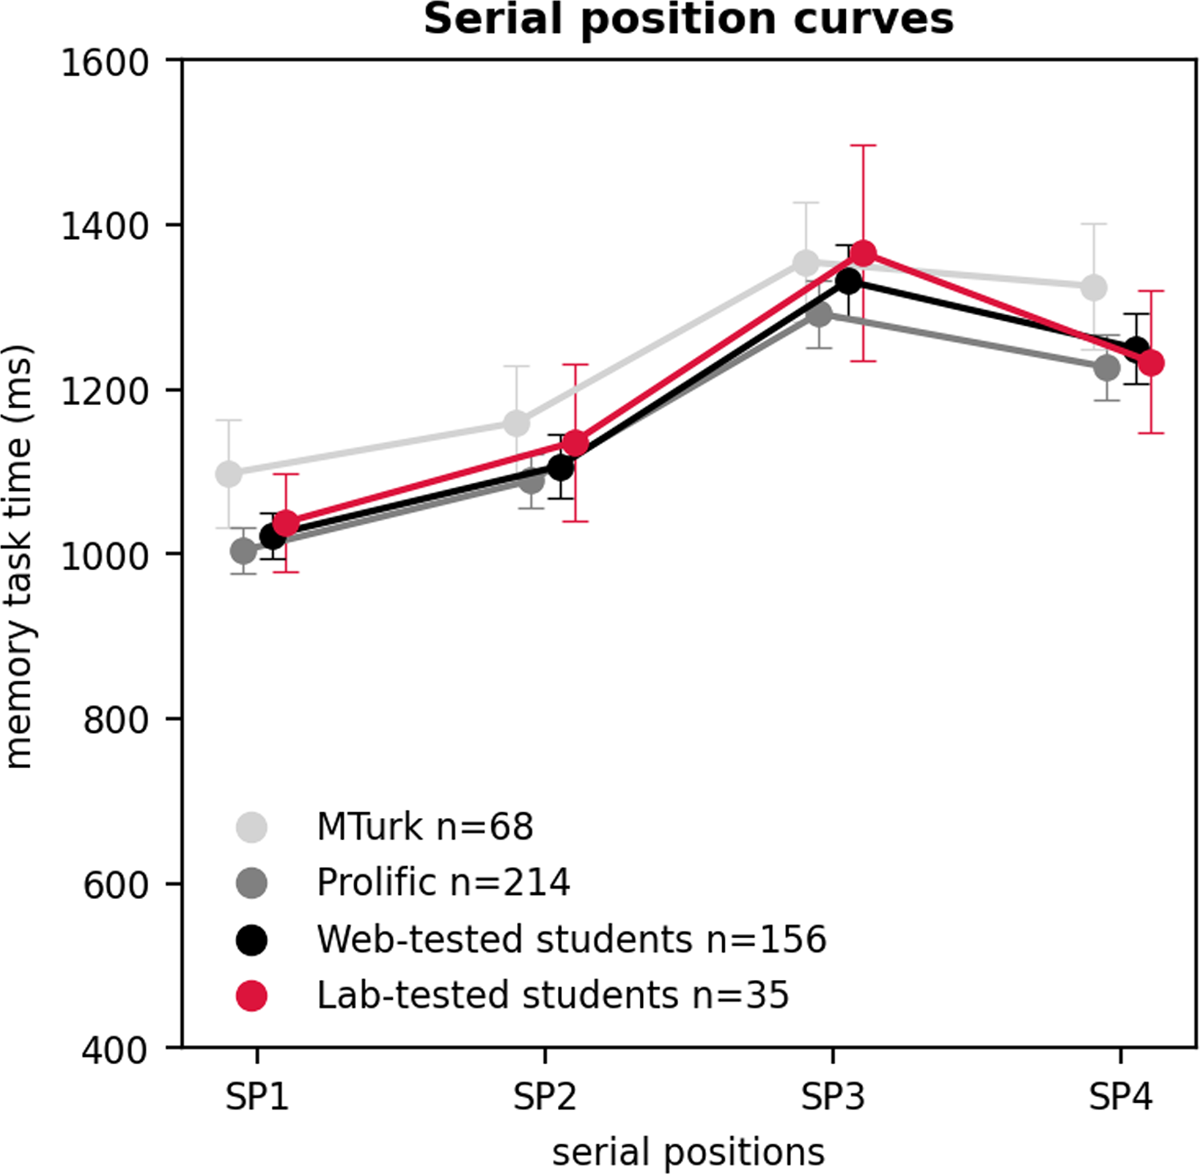
Figure 4
The serial position curves in MTurk participants, Prolific participants, web-tested students, and lab-tested students.
Note: The serial position curves are calculated on the remaining data patterns that showed a primacy effect (median RT first presented letter memory series < average median RT other letters). On the x-axis we plotted the serial positions (SP), which correspond to the place that a memory probe had in the memory list. On the y-axis we plotted the average of the median memory RT of all patterns for each participant pool. The pattern medians were calculated using trials where the probe was present in the memory list, and for which participants correctly responded. Error bars represent a 95% confidence interval around the mean.
Table 3
Summary of testing modality and participant pool effects.
| PARTICIPANT POOL | ANOMALOUS PATTERNS | VERBAL DISRUPTION BENCHMARK | REHEARSAL PRIMACY BENCHMARK |
|---|---|---|---|
| Lab-tested students | ++ | ++ | ++ |
| Web-tested students | ++ | +– | ++ |
| Prolific | ++ | +– | ++ |
| MTurk | –– | –– | –– |
[i] Note: Best data quality is indicated by ‘++’, worst data quality is indicated by ‘– –’, and when the observations are in-between, this is indicated by ‘+–’.