
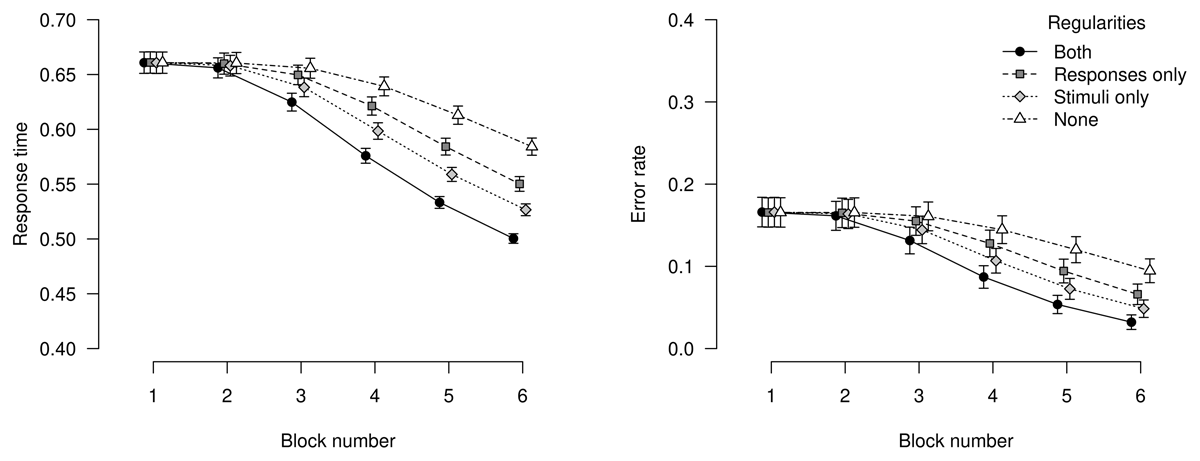
Figure 1
Response times and error rates from simulations. Left panel: Mean response times for non-error trials, averaged over simulations. Right panel: Proportion of erroneous responses, averaged over simulations. Error bars represent the average width of 95% within-subjects confidence intervals.