
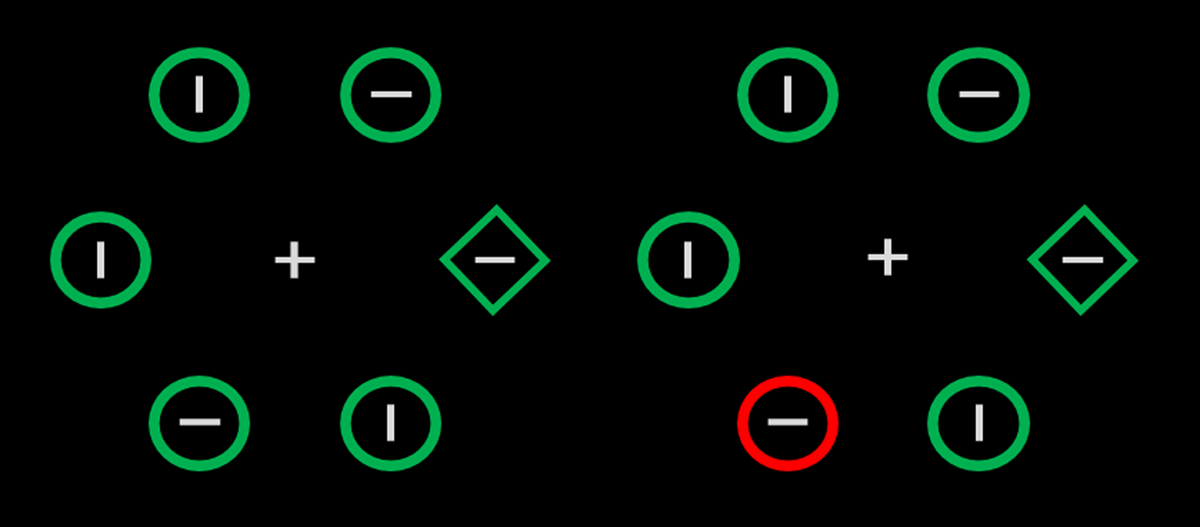
Figure 1
Sample displays in a typical additional singleton task. Participants search for the diamond, and the distractor (the unique red object) is either absent (left) or present (right).
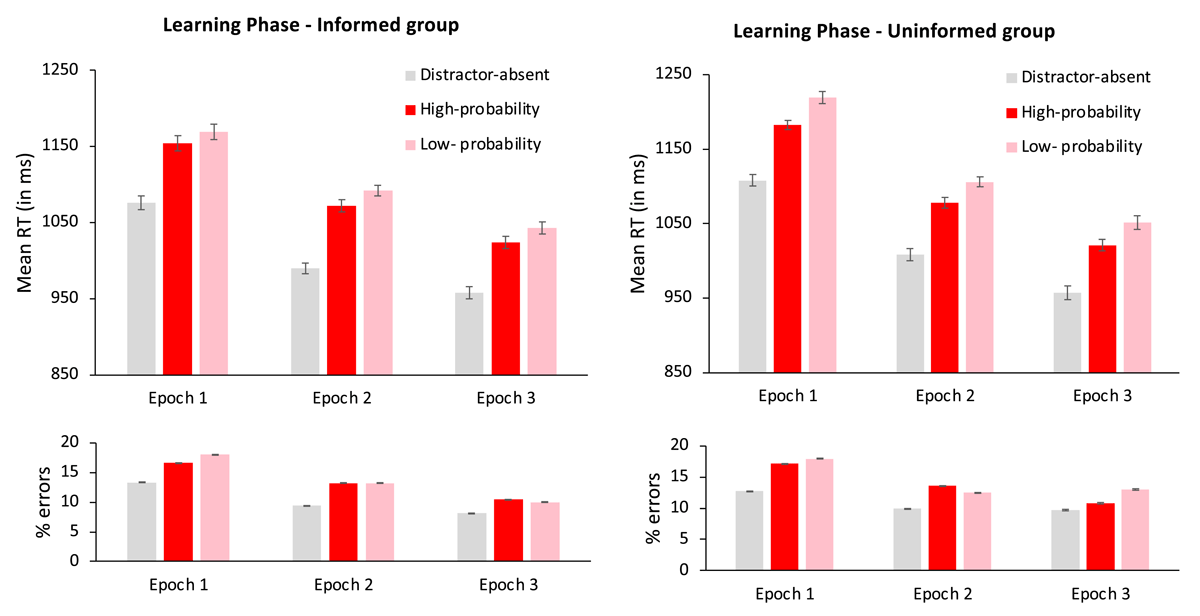
Figure 2
Mean reaction times (in milliseconds) in the learning phase, as a function of distractor condition (absent, present in the high-probability color and present in a low-probability color) and epoch (1–3), for the informed (left panel) and the uninformed (right panel) groups. Error bars denote within-subject standard errors (Morey, 2008).
Table 1
Mean reaction times (RTs, in milliseconds) in the three parts (1–40 trials, 41–80 and 81–120 trials) of the first epoch of the learning phase, as a function of distractor condition (distractor absent, present in the high-probability color, and present in a low-probability color) and epoch (1–3). The numbers in brackets denote within-subject standard errors (Morey, 2008).
| TRIALS 1–40 | TRIALS 41–80 | TRIALS 81–120 | |
|---|---|---|---|
| Distractor-absent | 1146 [9] | 1083 [8] | 1077 [8] |
| High-probability | 1232 [9] | 1142 [8] | 1132 [9] |
| Low- probability | 1258 [11] | 1174 [10] | 1155 [9] |
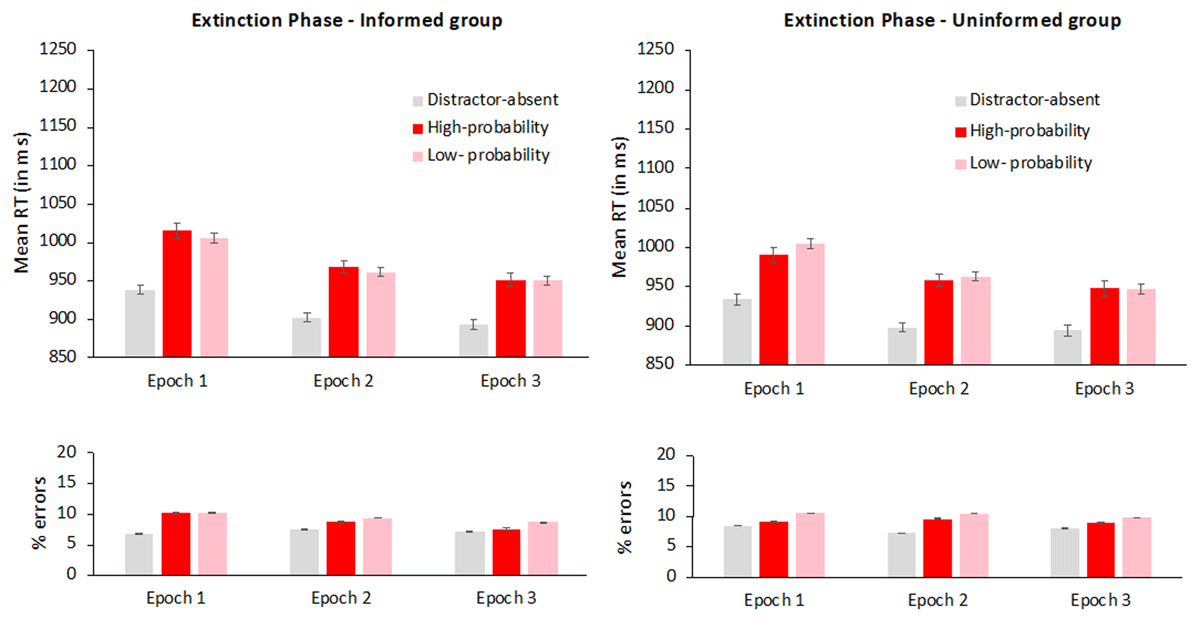
Figure 3
Mean reaction times (in milliseconds) in the extinction phase, as a function of distractor condition (absent, present in the high-probability color and present in a low-probability color) and epoch (1–3), for the informed (left panel) and the uninformed (right panel) groups. Error bars denote within-subject standard errors (Morey, 2008).
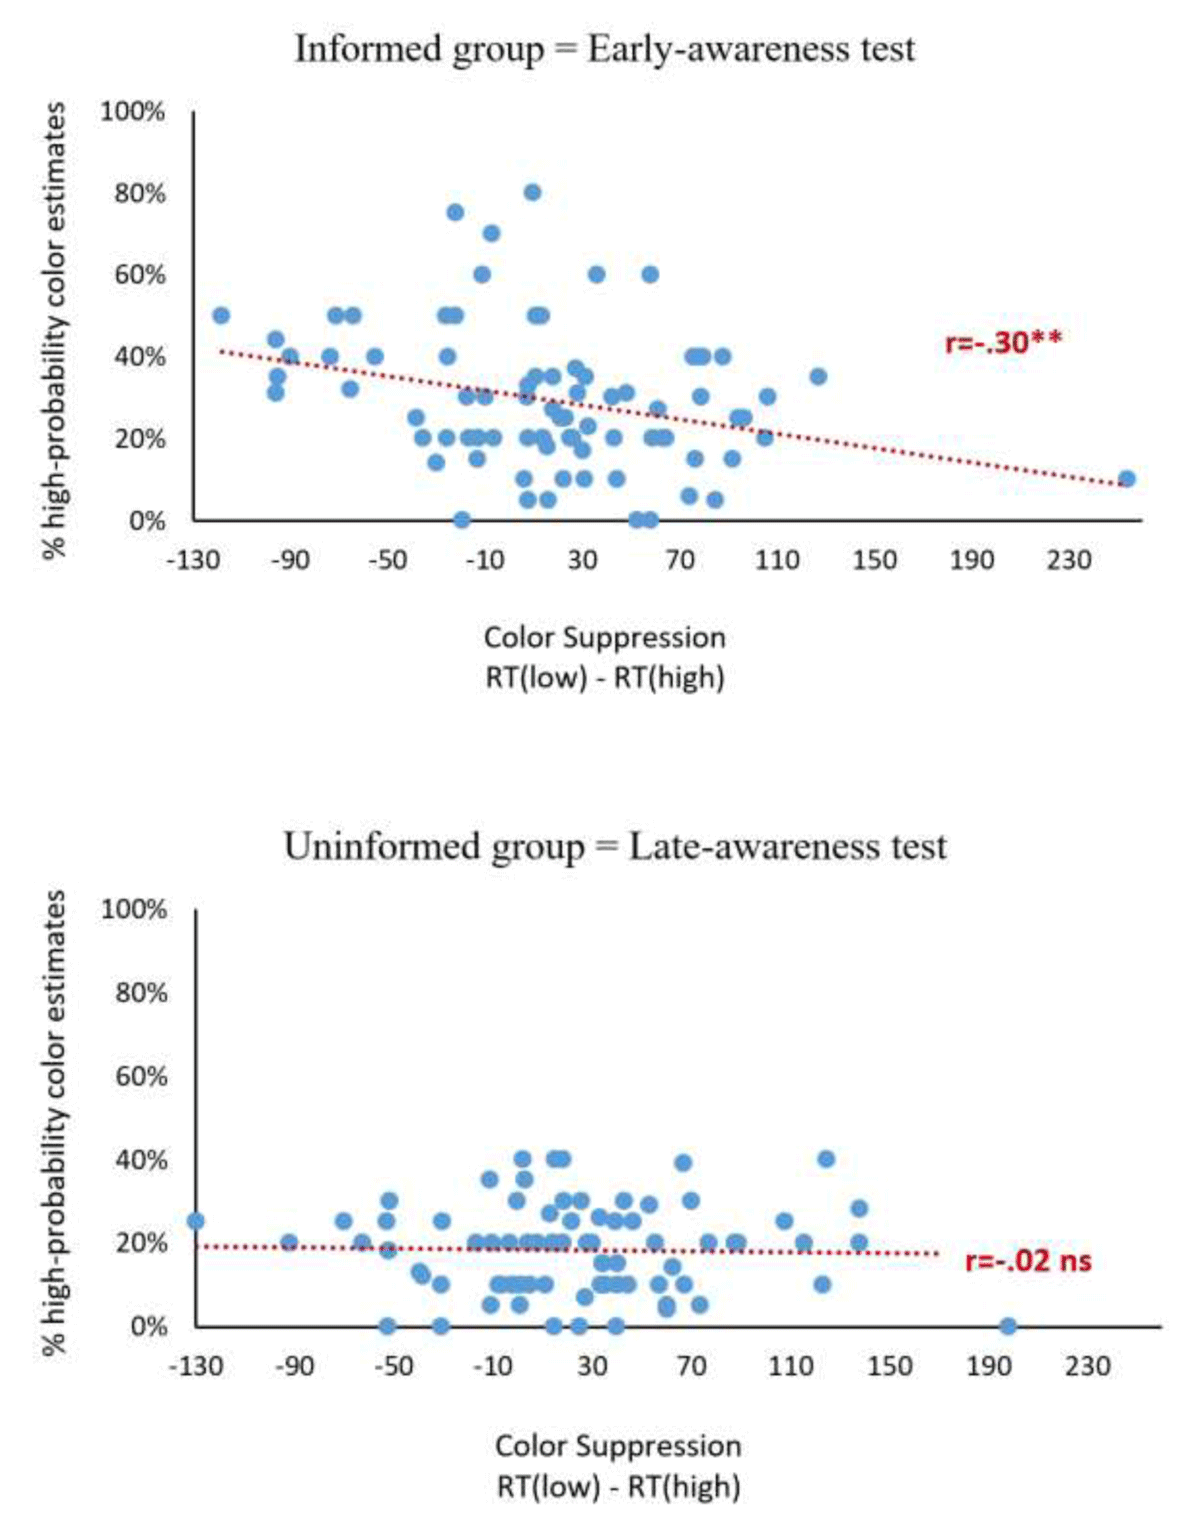
Figure 4
Scatter plot showing the correlation between the color suppression effect for the second half of the learning phase (x-axis) and the percentage assigned to the high-probability color (y-axis) for the informed group (upper panel) and the uninformed group (lower panel).