
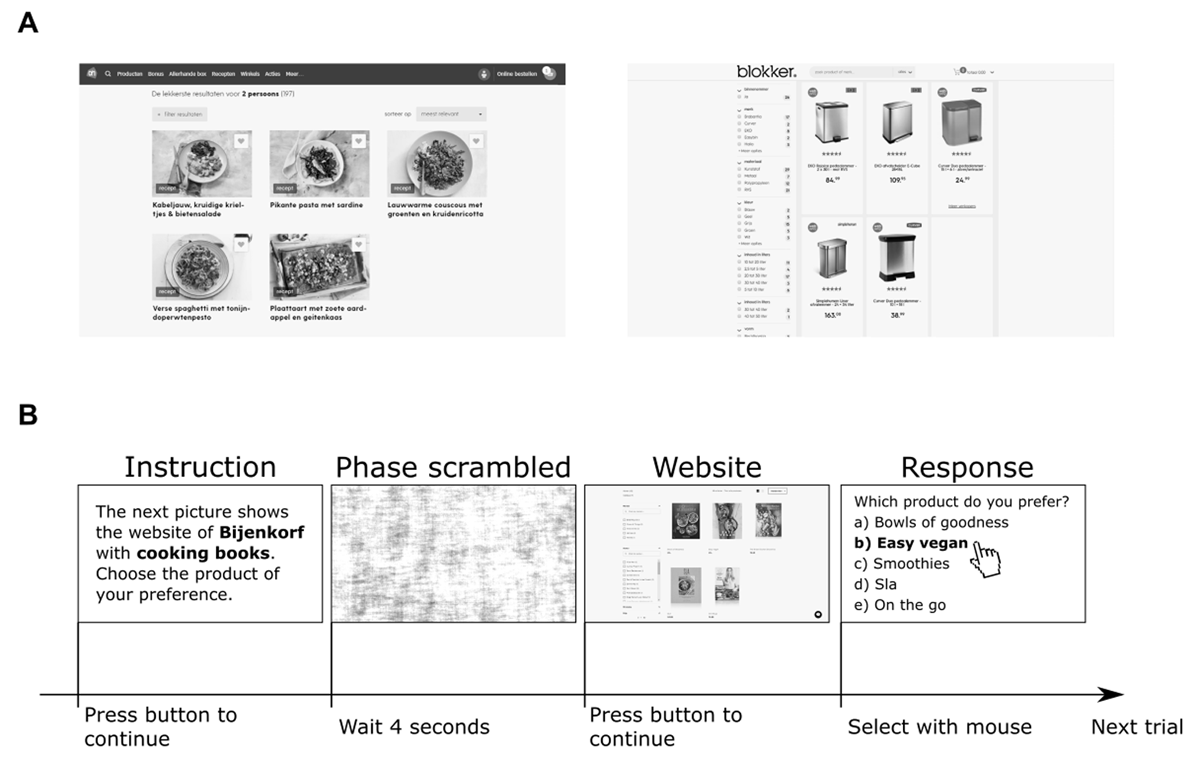
Figure 1
Stimuli and procedure. (A) Two examples of pictures shown to the participants. All pictures were equal in luminance. (B) Example procedure of a single trial. A trial started with the presentation of a short instruction, a phase-scrambled version of the web shop, the actual web shop, and then the multiple-choice question about which product is preferred by the participant.
Table 1
Means (M), standard deviation (SD), outcomes of paired t-tests (t, p), and effect sizes (AUC) of comparisons between preferred and nonpreferred products per independent variable.
| INDEPENDENT VARIABLE | M (SD) PREFERRED | M (SD) NONPREFERRED | t (DF) | p | AUC |
|---|---|---|---|---|---|
| Total dwell time | 3.937 (1.454) | 2.221 (0.845) | 19.16 (60) | <.001 | 0.75 |
| Median dwell duration | 0.509 (0.16) | 0.429 (0.123) | 7.68 (60) | <.001 | 0.53 |
| Number of dwells | 10.302 (4.915) | 6.546 (3.042) | 14.08 (60) | <.001 | 0.69 |
| Mean pupil size | 3.260 (0.455) | 3.242 (0.454) | 7.4 (60) | <.001 | 0.54 |
| Mean pupil size minus baseline | –0.008 (0.051) | –0.015 (0.038) | 1.91 (60) | .061 | 0.52 |
| Mean detrended pupil size | 3.399 (0.455) | 3.381 (0.453) | 7.45 (60) | <.001 | 0.54 |
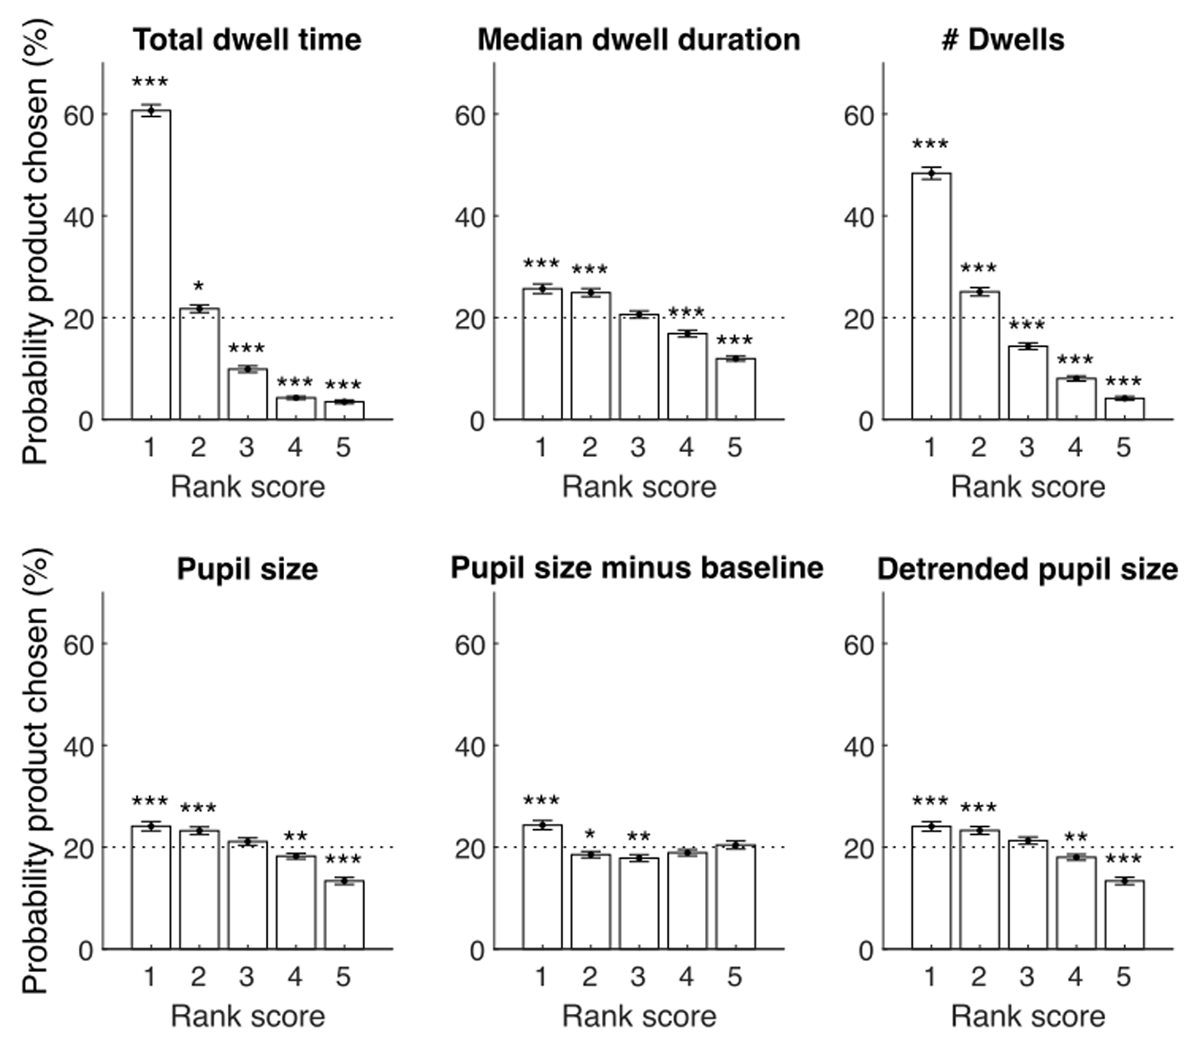
Figure 2
Rank score results. Percent of trials (y-axis) per rank score (x-axis) per independent variable (panel). A rank score of 1 means that the product was dwelled on most and longest, and evoked largest pupil size during viewing, while a rank score of 5 means it was dwelled on less often, shortest, and evoked smallest pupil size during viewing.
Table 2
Mean (M) and standard deviation (SD) of regression weights (betas, estimates) across participants of the probability to prefer a product per model that either uses all gaze angle variables or all gaze angle and pupil variables combined as predictors.
| MODEL | AUC (M ± SD) | INTERCEPT | VARIABLE | BETAS (M ± SD) |
|---|---|---|---|---|
| All gaze angle variables | 0.81 ± 0.05 | 0.03 (0.05) | Total dwell time | –1.19 (0.52) |
| Median dwell duration | –0.63 (0.41) | |||
| Number of dwells | –1.23 (0.56) | |||
| All gaze and pupil variables | 0.82 ± 0.05 | 0.92 (0.40) | Total dwell time | –1.19 (0.57) |
| Median dwell duration | –0.68 (0.46) | |||
| Number of dwells | –1.31 (0.63) | |||
| Mean pupil size | 1.56 (8.40) | |||
| Mean pupil size minus baseline | –0.07 (0.33) | |||
| Mean detrended pupil size | –1.69 (8.45) |