
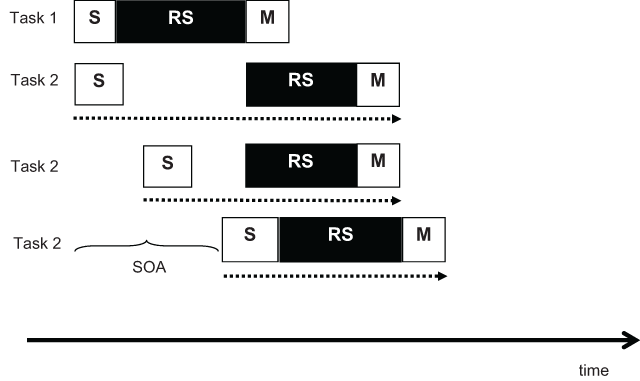
Figure 1
Illustration of the standard explanation of the PRP effect. The top two rows show the scheduling and durations of the processing stages (S = sensory, RS = response selection, M = motor execution) for Task 1 and Task 2, respectively, at SOA = 0: The central response-selection stage of Task 2 is delayed until the central process of Task 1 is completed, enforcing a delay (slack time) that is added to the RT of Task 2. The bottom two rows show task-2 processes at increasingly longer SOAs: As the SOA increases, the delay decreases, resulting in shorter task-2 RTs.
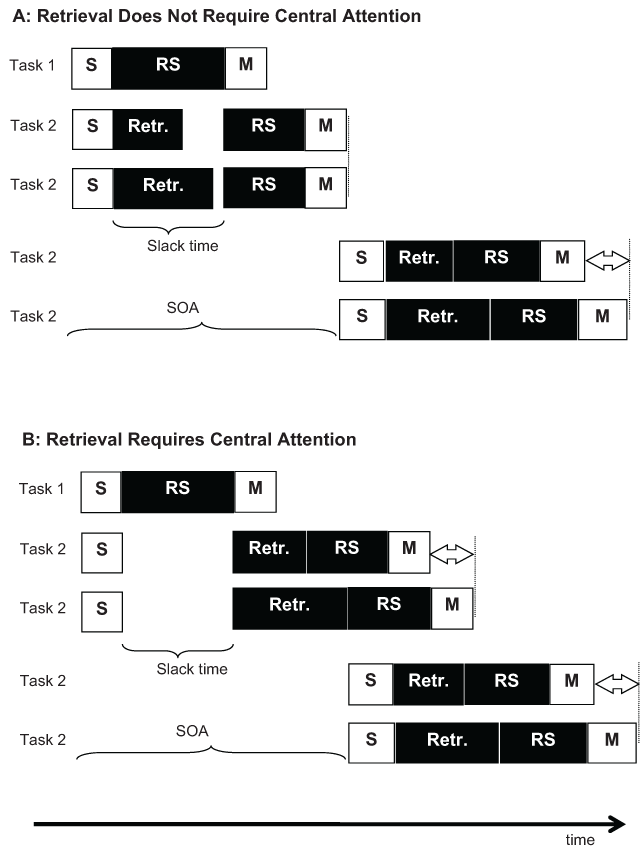
Figure 2
Hypothetical scheduling of processes for a retrieval task as Task 2 in the PRP paradigm. A: When retrieval does not require the bottleneck, it can be completed in the slack time at short SOAs, but not at long SOAs. Therefore, differences in retrieval duration between two conditions translate into RT differences at long SOAs (bottom two rows) but not short SOAs (rows 2 and 3). B: When retrieval requires the bottleneck, it can commence only after the slack period. Therefore, differences in retrieval duration manifest themselves fully in RT differences regardless of SOA.
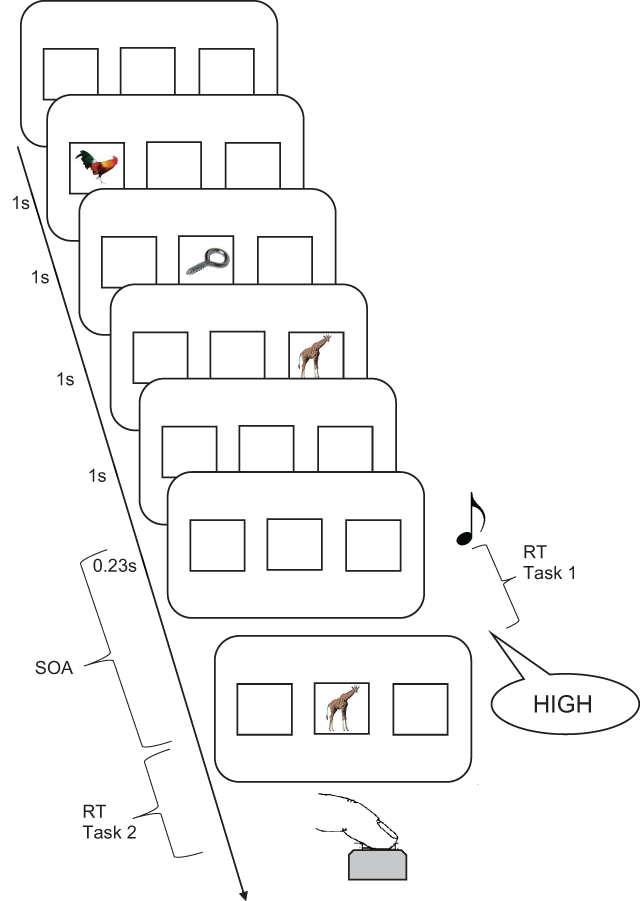
Figure 3
Flow of events in a trial of Experiment 1. The stimulus-onset-asynchrony (SOA) was varied (0.1, 0.3, 0.6, or 1.2s). The memory probe shown is an intrusion probe.
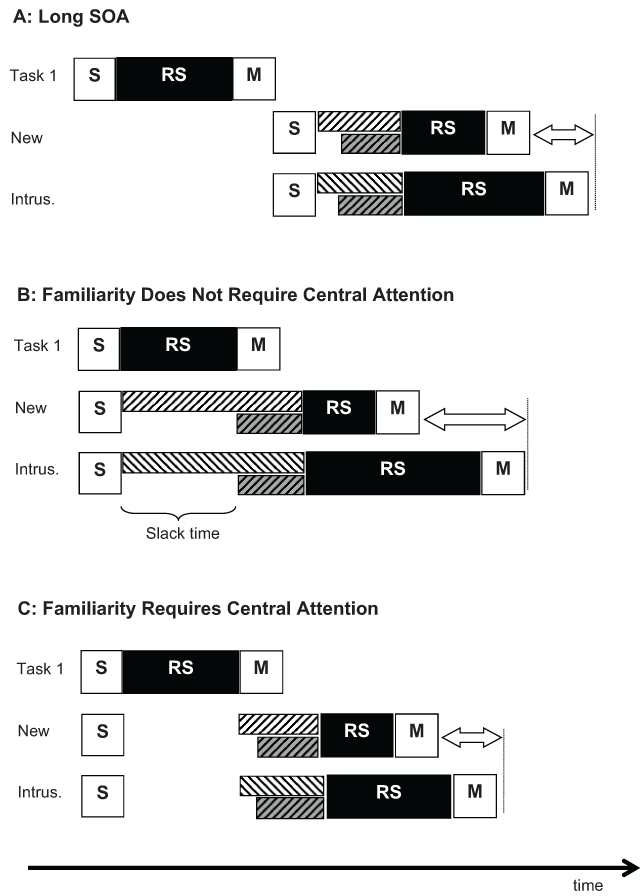
Figure 4
Two hypotheses about familiarity and recollection in the PRP paradigm. A: With a long SOA, no task-2 process is delayed by competition for the bottleneck. After sensory processing of the probe, familiarity (white striped bars) starts immediately. Recollection (grey striped bars), assumed to be a slower process, follows with a short delay. Response selection takes longer for intrusion probes than new probes due to the need to resolve the conflict between familiarity and recollection. B: Short SOA, scenario in which familiarity does not require the bottleneck. Familiarity receives a head start, accumulating more information before recollection sets in. This facilitates response selection for new probes but exaggerates the conflict for intrusion probes, resulting in a larger intrusion costs on task-2 RTs. C: Short SOA, scenario in which familiarity requires the bottleneck. Both familiarity and recollection are delayed equally, so that the intrusion cost is independent of SOA.
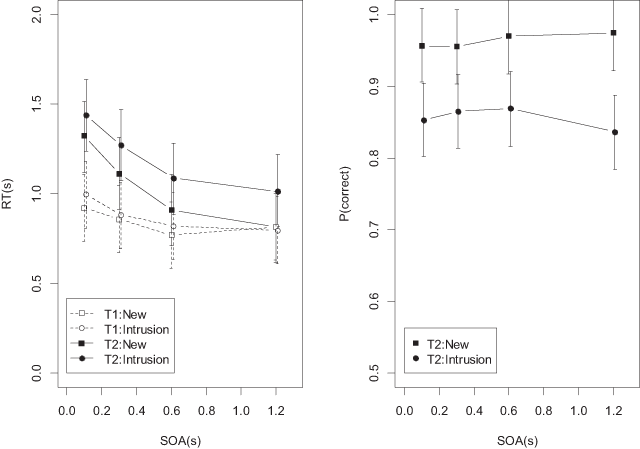
Figure 5
Mean RTs and accuracies from Experiment 1, new and intrusion probes. T1 = Task 1, T2 = Task 2. Error bars are 95% credible intervals of the posterior density of the mean, estimated from the full regression model.
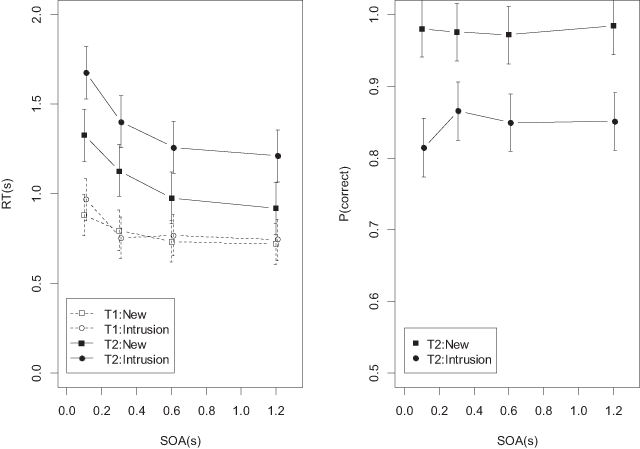
Figure 6
Mean RTs and accuracies from Experiment 2, new and intrusion probes.
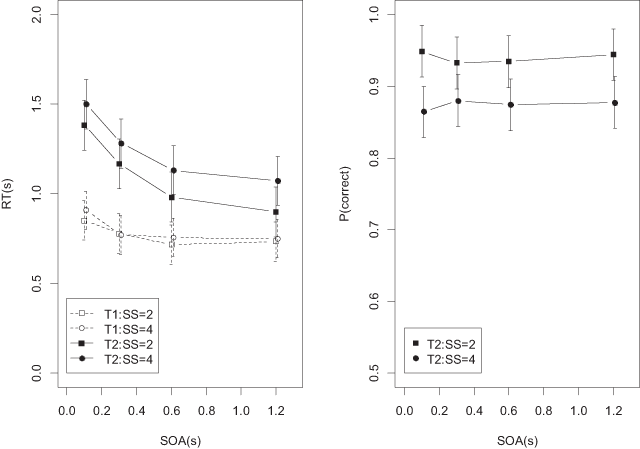
Figure 7
Mean RTs and accuracies of the recognition task in Experiment 2 as a function of set size, averaged over all probe types.
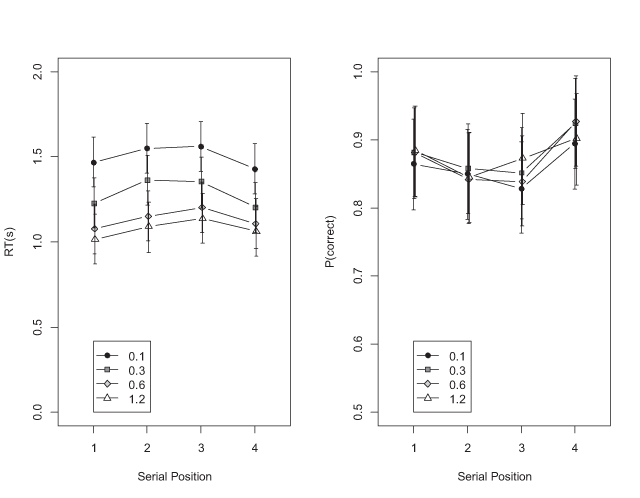
Figure 8
Mean RTs and accuracies of the recognition task in Experiment 2 as a function of serial position (set size 4), averaged over all probe types.
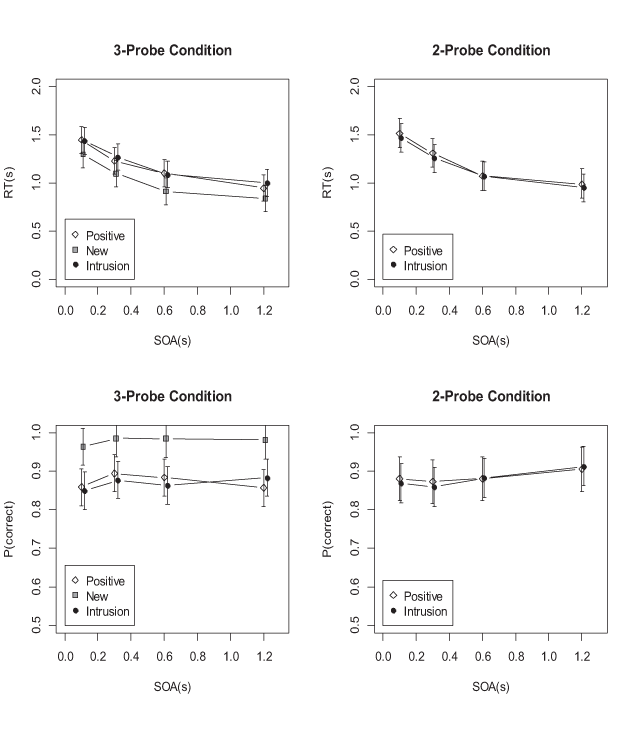
Figure 9
Mean RTs and accuracies of the recognition task in Experiment 3A.
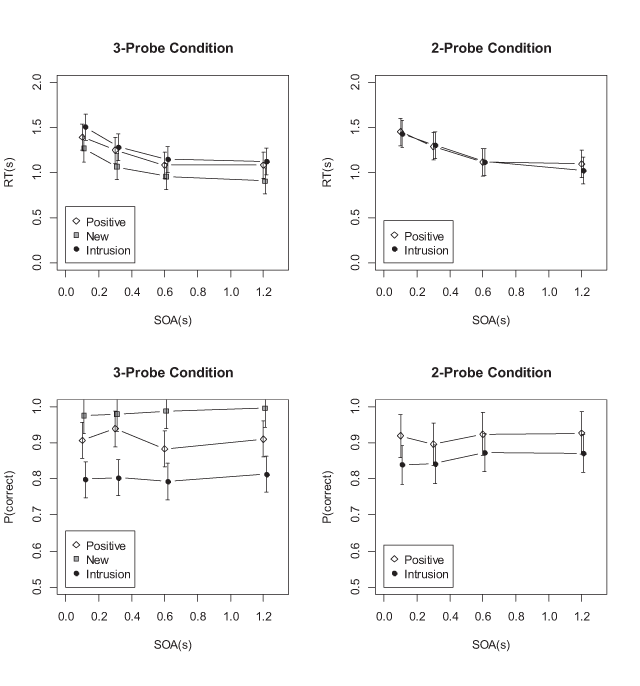
Figure 10
Mean RTs and accuracies of the recognition task in Experiment 3B.
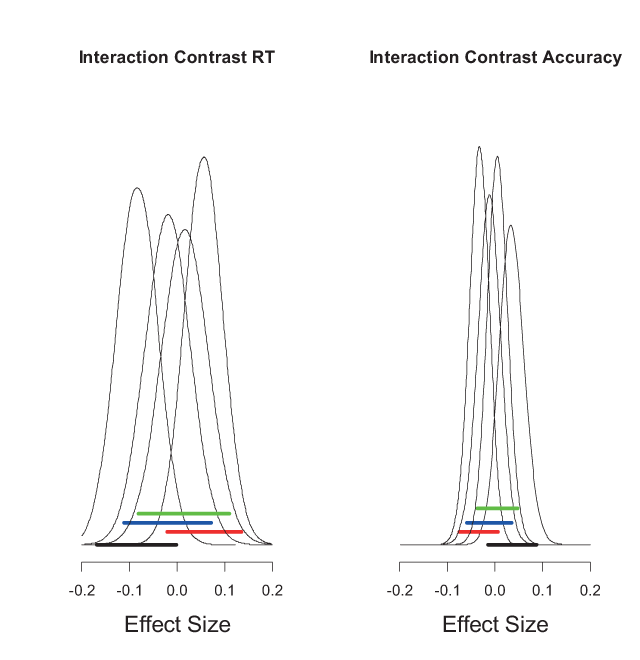
Figure 11
Posterior densities of the Probe Type × SOA interaction from the full linear model of the four experiments. Interaction contrasts were calculated as {(SOA = 0.1 & Intrusion) – (SOA = 0.1 & New)} – {SOA = 1.2 & Intrusion) – (SOA = 1.2 & New)}. The 95% credible intervals are given as thick horizontal bars (black, red, blue, and green for Experiments 1, 2, 3A, and 3B, respectively). The scale is the standardized effect size (i.e., Cohen’s d).