
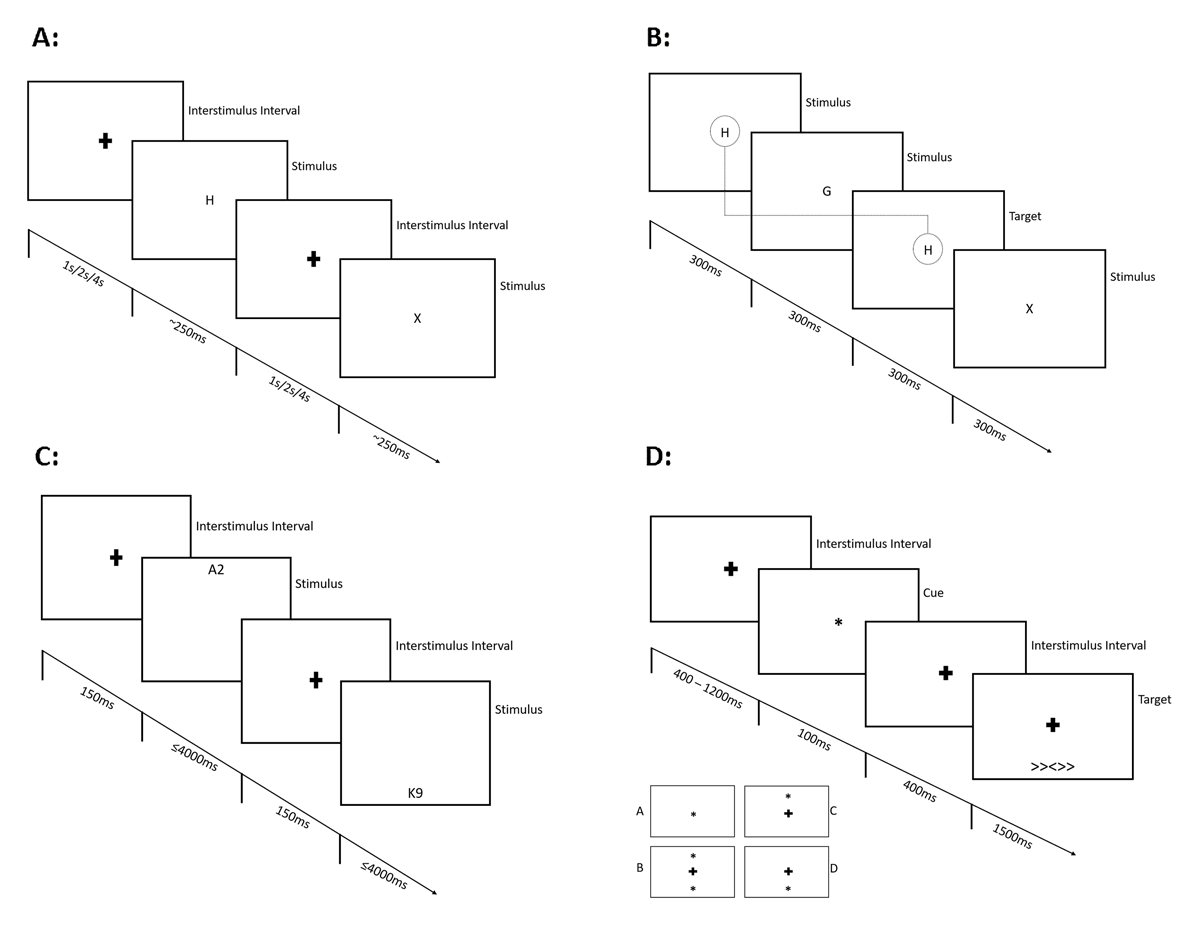
Figure 1
Display Sequences of the Reaction Time Tasks.
Note: Panel A: During the CPT-II, participants were presented with a consecutive stream of single capital letters (for example: H – O – T – X – Z) and were to press a button every time a letter appeared on the screen, except for the letter “X” (90% target trials; 10% non-target trials). Panel B: During the N-Back Task, in a 2-back block (n = 2), participants were to indicate a target trial if the following stream of letters occurred: H – G – H, but not if the presented letters were: H – G – X. Panel C: During the Number-Letter Task, if the number-letter combination appears in the upper half of the screen, participants are instructed to indicate whether the presented number is odd or even. If the number-letter combination appears in the lower half of the screen, participants are asked to indicate whether the letter is a consonant or a vowel. Panel D: During the Attention Network Task, in no cue trials, participants were presented with a fixation cross in the center of the screen prior to target onset. In center cue trials (A), an asterisk was shown in the center of the screen instead of a fixation cross. In double cue trials (B), two asterisks were presented simultaneously at the two possible target locations (above and below the fixation cross). In spatial cue trials (C and D), the cue was displayed at the position of the upcoming target.
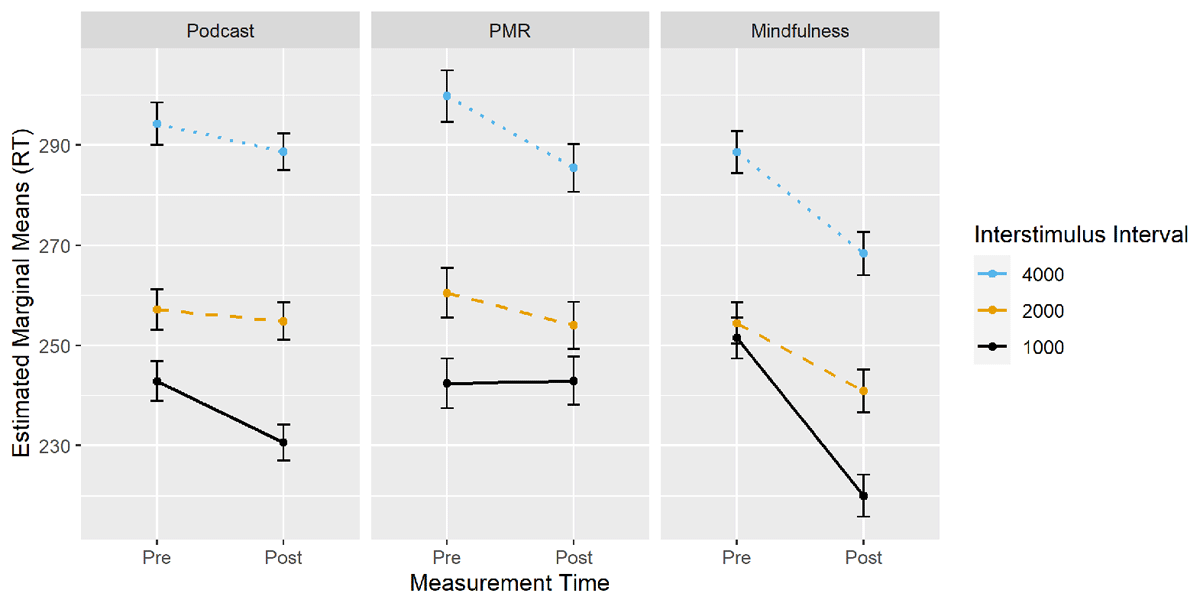
Figure 2
CPT-II: Changes in RT from Pre- to Post-Measurement by Condition and ISI.
Table 1
Planned Comparisons of Measures of Attention and Executive Control for Significant Interactions in Generalized Linear Mixed Models and Regression Analyzes.
| PODCAST – MINDFULNESS | PODCAST – PMR | MINDFULNESS – PMR | ||||||
|---|---|---|---|---|---|---|---|---|
| T1 – T0: ESTIMATE (SE) | p | T1 – T0: ESTIMATE (SE) | p | T1 – T0: ESTIMATE (SE) | p | |||
| CPT–II RT (ISI1000) | 19.22 (2.95) | <.001 | –12.86 (3.07) | <.001 | –32.08 (4.33) | <.001 | ||
| CPT–II RT (ISI2000) | 11.18 (3.36) | 0.003 | 4.25 (3.39) | 0.423 | –6.93 (4.43) | 0.260 | ||
| CPT–II RT (ISI4000) | 14.72 (3.43) | <.001 | 8.77 (3.73) | 0.049 | –5.95 (4.61) | 0.400 | ||
| CPT–II d’ | –0.30 (0.25) | 0.453 | –0.62 (0.24) | 0.028 | –0.32 (0.24) | 0.386 | ||
| CPT–II Errors of Omission | 0.04 (2.85) | 1.000 | 6.64 (2.75) | 0.043 | 6.60 (2.78) | 0.048 | ||
| N–Back RT | 36.00 (6.70) | <.001 | 21.20 (5.02) | <.001 | –14.70 (7.20) | 0.101 | ||
| N–Back d’ | – | – | – | – | – | – | ||
| N–Back Errors of Omission | –1.32 (1.01) | 0.396 | –2.06 (1.02) | 0.108 | –0.74 (1.05) | 0.762 | ||
| Number–Letter RT | 2.76 (6.68) | 0.910 | –29.40 (7.73) | <0.001 | –32.16 (9.75) | 0.003 | ||
| Number–Letter Accuracy | – | – | – | – | – | – | ||
| ANT Executive Network RT | 12.66 (2.58) | <.001 | 14.02 (2.57) | <.001 | 1.36 (3.33) | 0.913 | ||
| ANT Executive Network Accuracy | – | – | – | – | – | – | ||
| ANT Alerting Network RT | –3.51 (4.27) | 0.690 | –9.54 (4.39) | 0.076 | –6.03 (4.23) | 0.327 | ||
| ANT Alerting Network Accuracy | – | – | – | – | – | – | ||
| ANT Orienting Network RT | 3.13 (3.78) | 0.686 | –6.49 (4.54) | 0.326 | –9.61 (4.93) | 0.125 | ||
| ANT Orienting Network Accuracy | – | – | – | – | – | – | ||
[i] Note: T0 = pretest; T1 = posttest. P value adjustment: Tukey method for comparing a family of 3 estimates. Empty rows represent models that did not produce any significant effects of interest but are reported in the Results section.
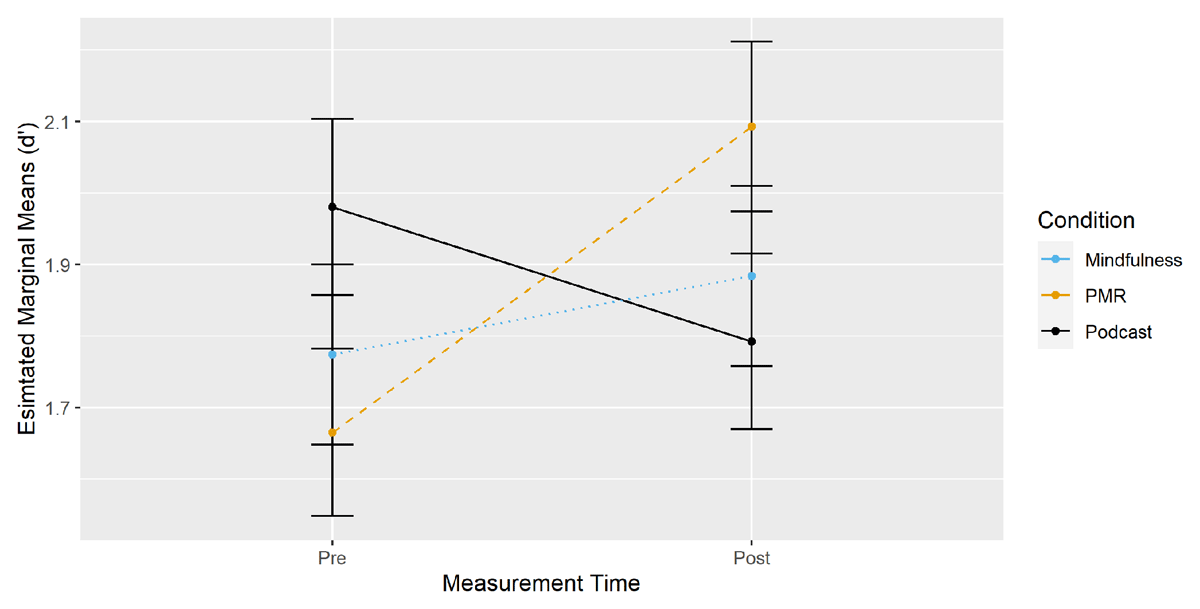
Figure 3
CPT-II: Changes in d’ from Pre- to Post-Measurement by Condition.
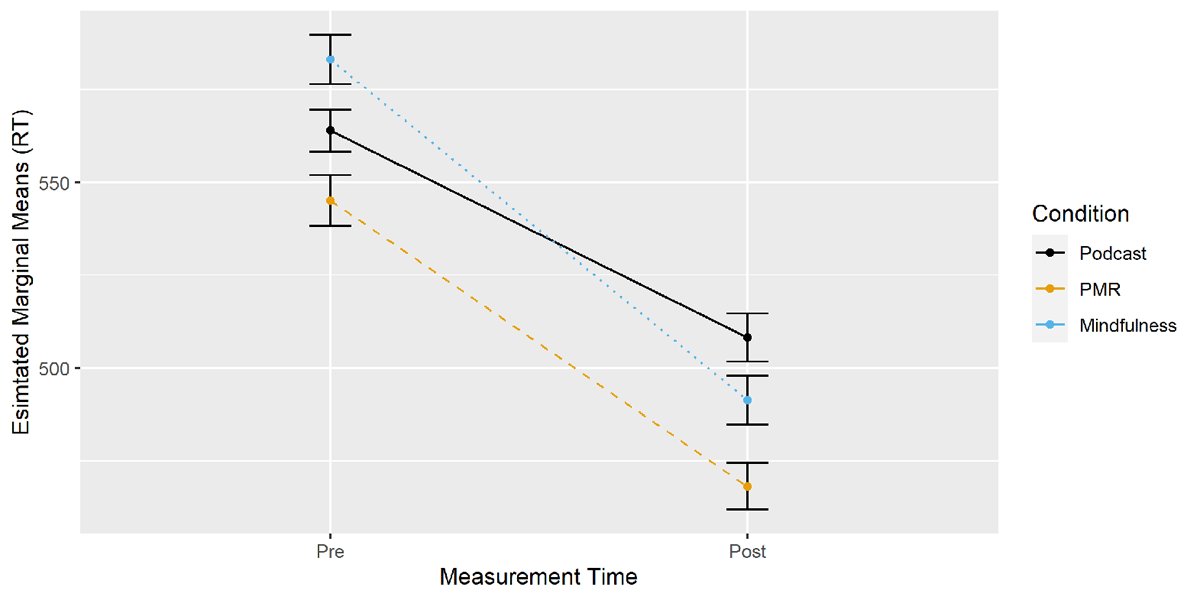
Figure 4
N-Back: Changes in RT from Pre- to Post-Measurement by Condition.
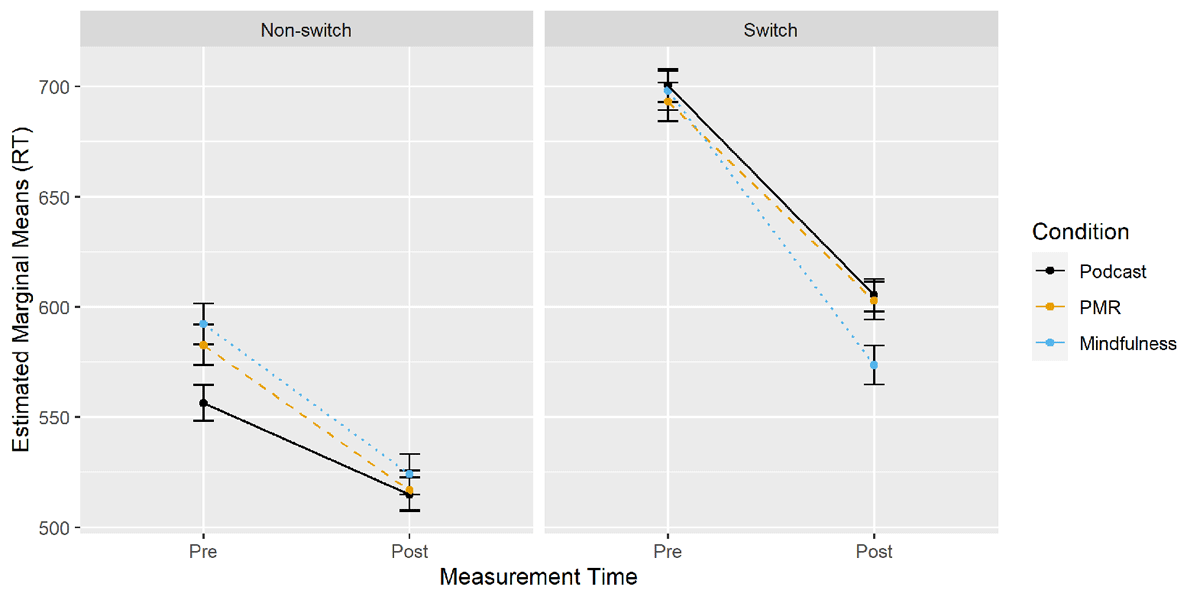
Figure 5
Number-Letter Task: Changes in RT from Pre- to Post-Measurement by Condition and Trial Type.
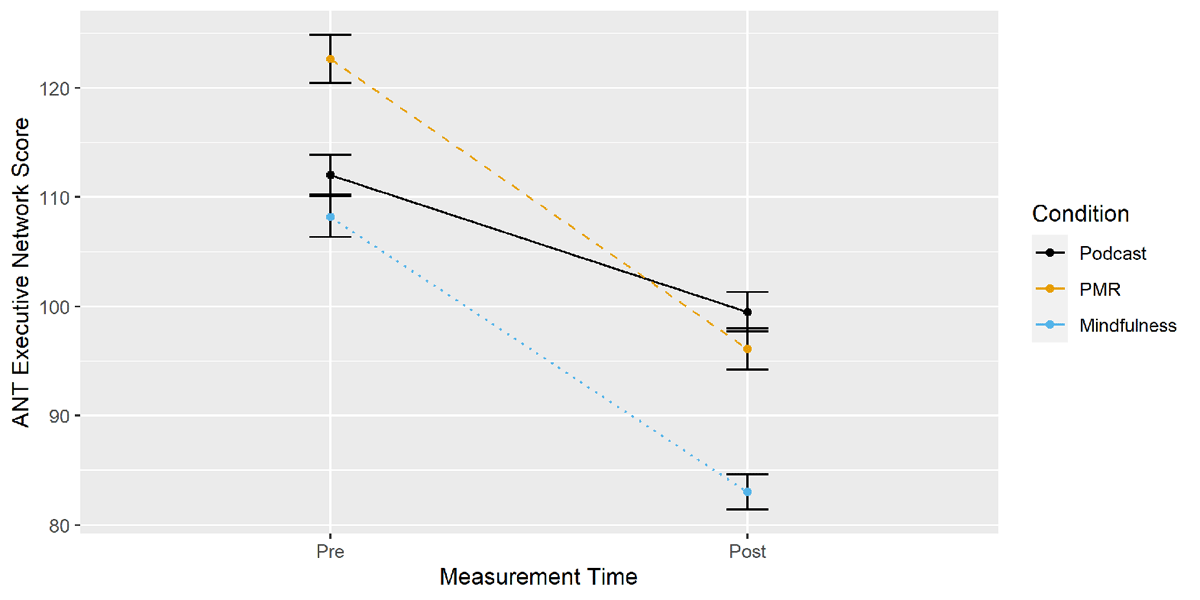
Figure 6
ANT: Executive Network Score from Pre- to Post-Measurement by Condition.
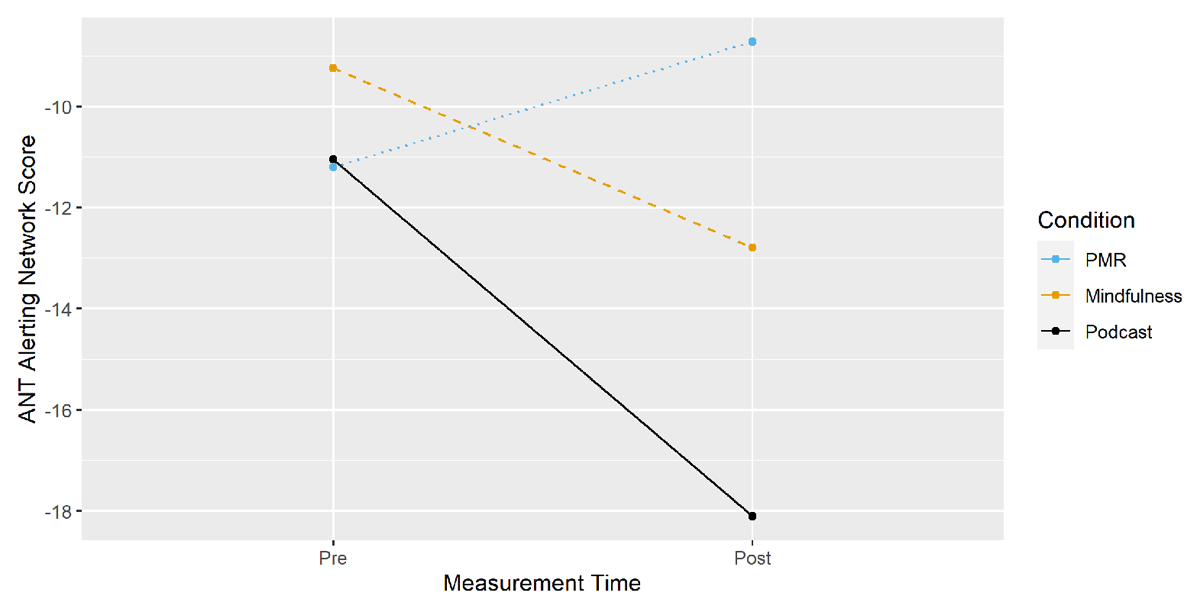
Figure 7
ANT: Alerting Network Score from Pre- to Post-Measurement by Condition.
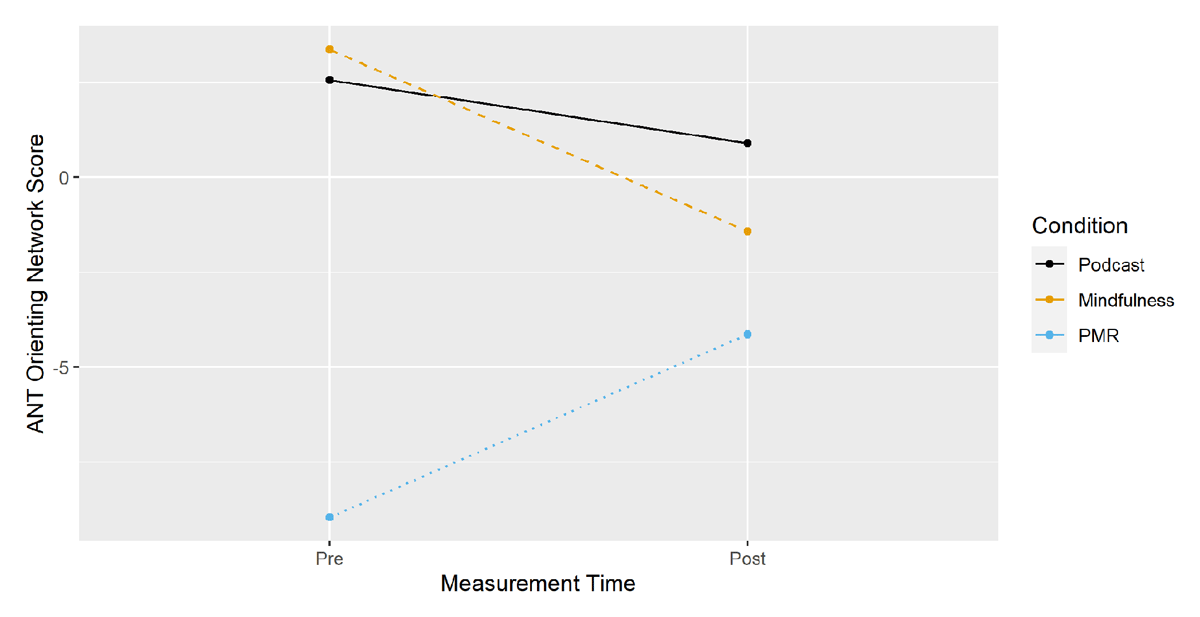
Figure 8
ANT: Orienting Network Score from Pre- to Post-Measurement by Condition.