
Table 1
Mean (SD) self-reported proficiency (1 = unable, 5 = expert) and LexTALE scores in L1 English and L2 Spanish.
| READING | SPELLING | SPEAKING | LISTENING | LEXTALE | |
|---|---|---|---|---|---|
| L1 English | 5.00 (0.00) | 4.55 (0.83) | 4.90 (0.31) | 4.95 (0.22) | 93.94 (7.02) |
| L2 Spanish | 3.80 (0.77) | 4.05 (1.15) | 3.80 (0.77) | 3.70 (0.66) | 65.92 (7.58) |
Table 2
Characteristics of the L1 English and L2 Spanish targets and primes [mean (SD)].
| TARGET | OLD20 | OLD20(L1 LEXICON) | OLD20(L2 LEXICON) | FREQUENCY | TL PRIME OLD20 | SUB PRIME OLD20 |
|---|---|---|---|---|---|---|
| L1 English | 1.66 (.17) | 1.74 (.14) | 2.08 (.29) | 64.11 (113.63) | 1.98 (.18) | 2.03 (.18) |
| L2 Spanish | 1.66 (.17) | 2.14 (.35) | 1.73 (.14) | 64.86 (132.67) | 1.95 (.16) | 2.01 (.20) |
[i] Note: Unless otherwise specified, OLD20 was calculated from a lexicon that includes both L1 English and L2 Spanish words to best approximate the bilingual lexicon of our participants.
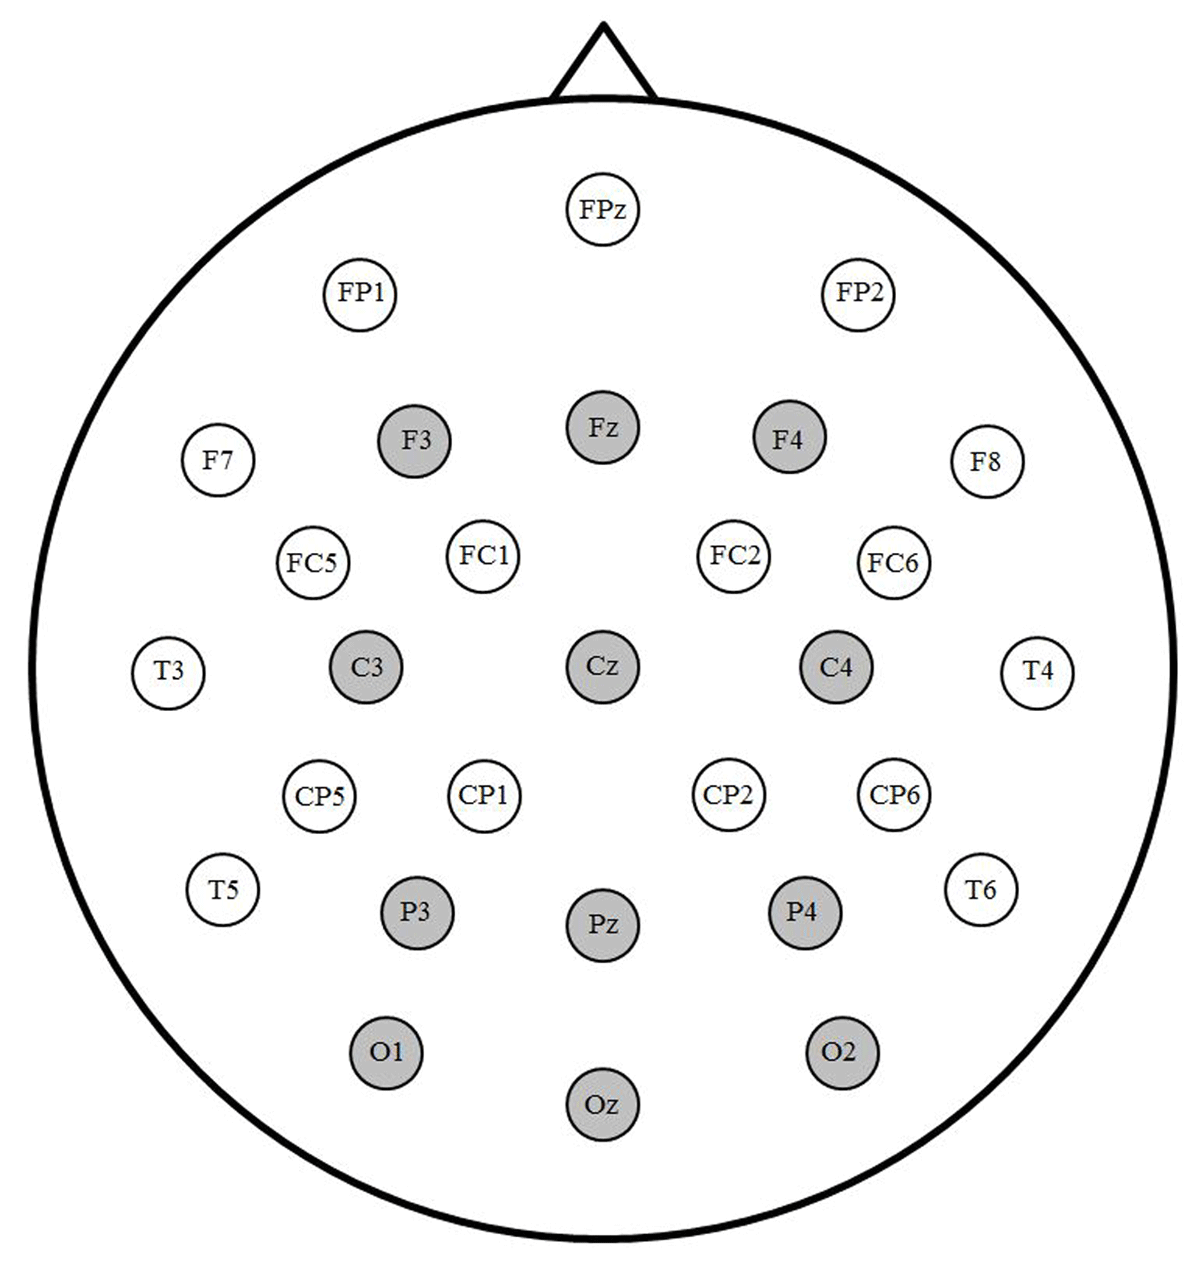
Figure 1
Electrode montage. Sites highlighted in gray were included in analyses.
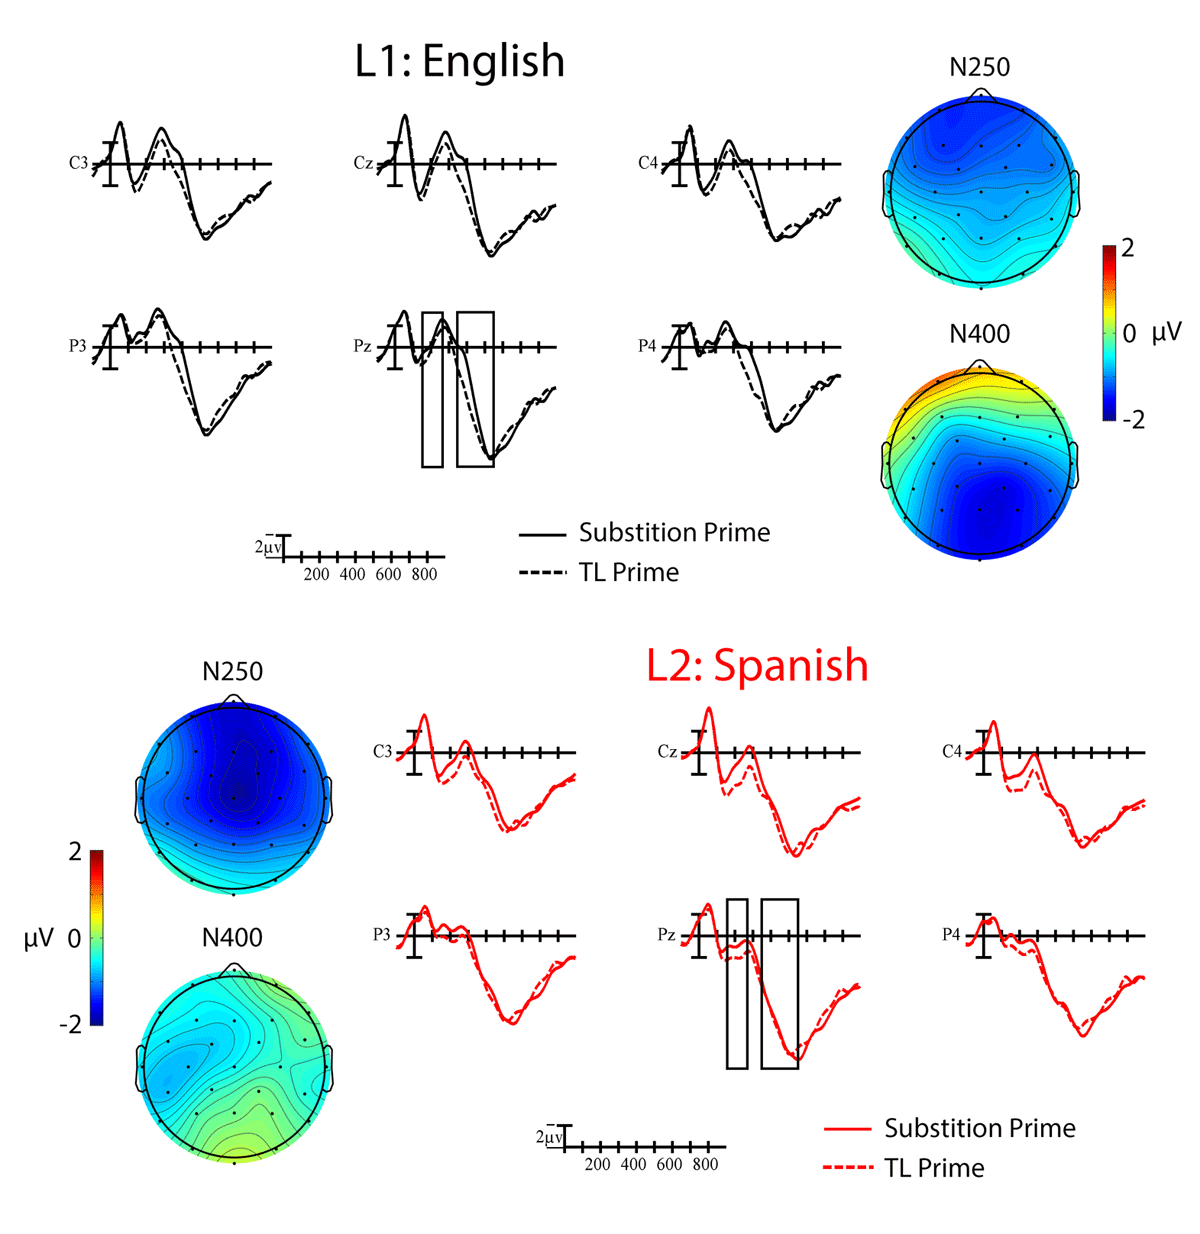
Figure 2
Grand average ERP waveforms showing the main effect of TL priming for word targets in L1 English (black) and L2 Spanish (red). Targets preceded by TL primes (dotted lines) elicited smaller amplitude negativities than those preceded by substitution lines (solid lines). Each vertical tick marks 100 ms and negative is plotted up. The vertical line marks target onset and the calibration bar marks 2 µV. The N250 and N400 windows that were analyzed are indicated with the black boxes. The scalp voltage maps show the distribution of the priming effects (substitution-TL) in each time window for the two languages.
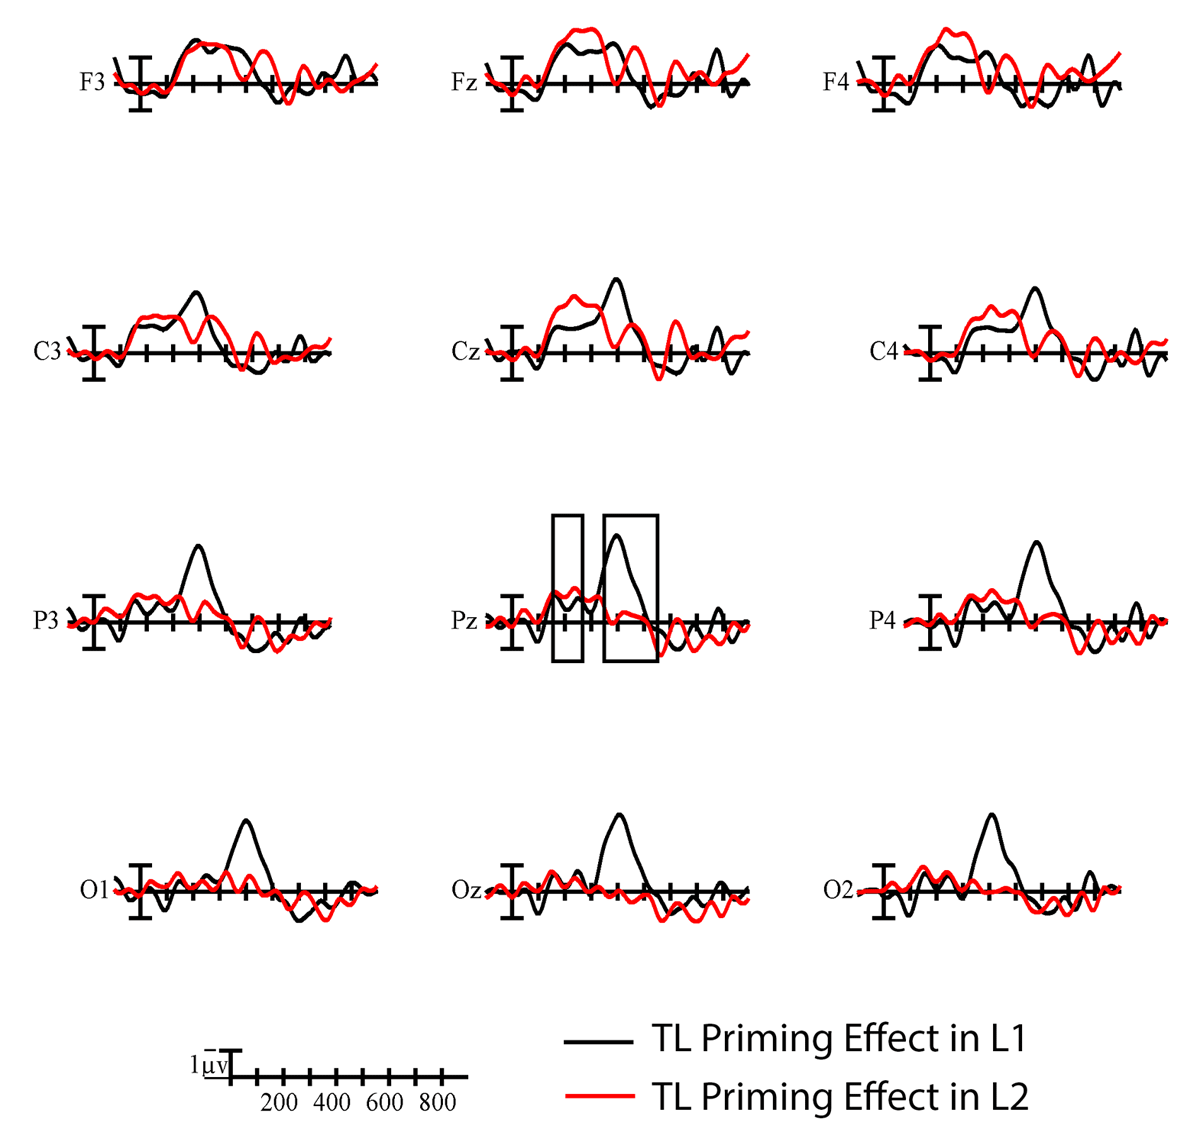
Figure 3
Difference waves showing the time course of TL priming effects (substitution-TL) in L1 English (black) and L2 Spanish (red) at all analyzed electrode sites. Each vertical tick marks 100 ms and negative is plotted up. The calibration bar marks 1 µV. The N250 and N400 windows are indicated by the black boxes at representative site Pz.
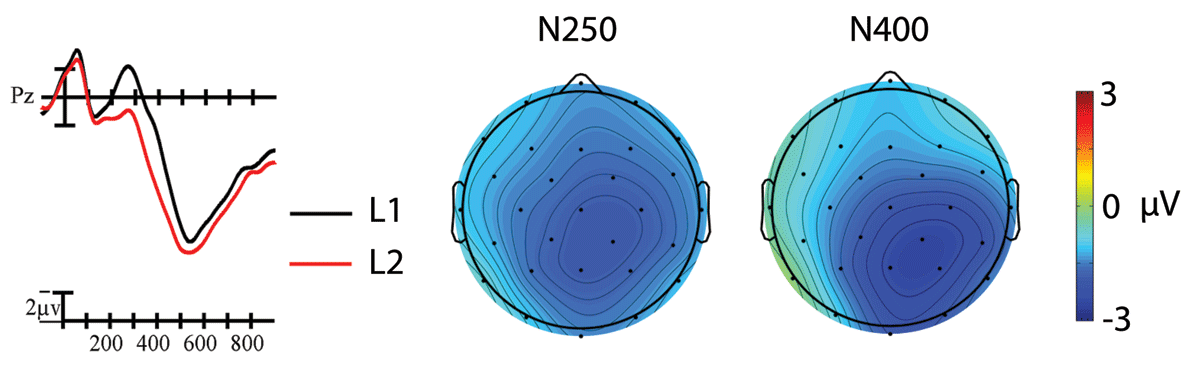
Figure 4
The main effect of Language at representative site Pz. L1 targets (black line) elicited larger amplitude negativities than L2 targets (red line) overall. Each vertical tick marks 100 ms and negative is plotted up. The vertical line marks target onset and the calibration bar marks 2 µV. The scalp voltage maps show the distribution of the effects (L1-L2) within the N250 and N400 windows that were analyzed.