
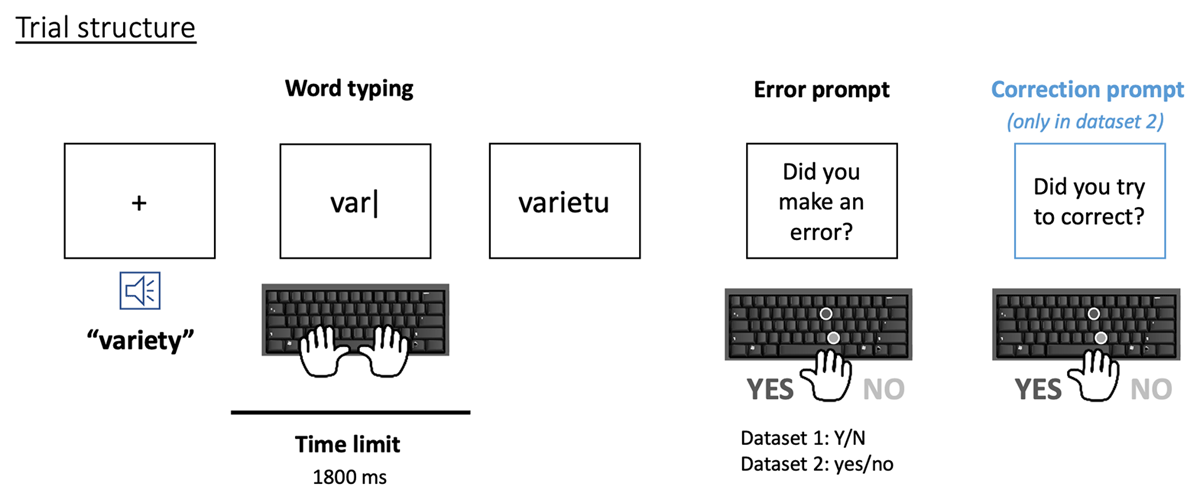
Figure 1
Trial structure for both datasets: a word typing period (under a time limit) is followed by an error prompt, and eventually a correction prompt (in Dataset 2 only).
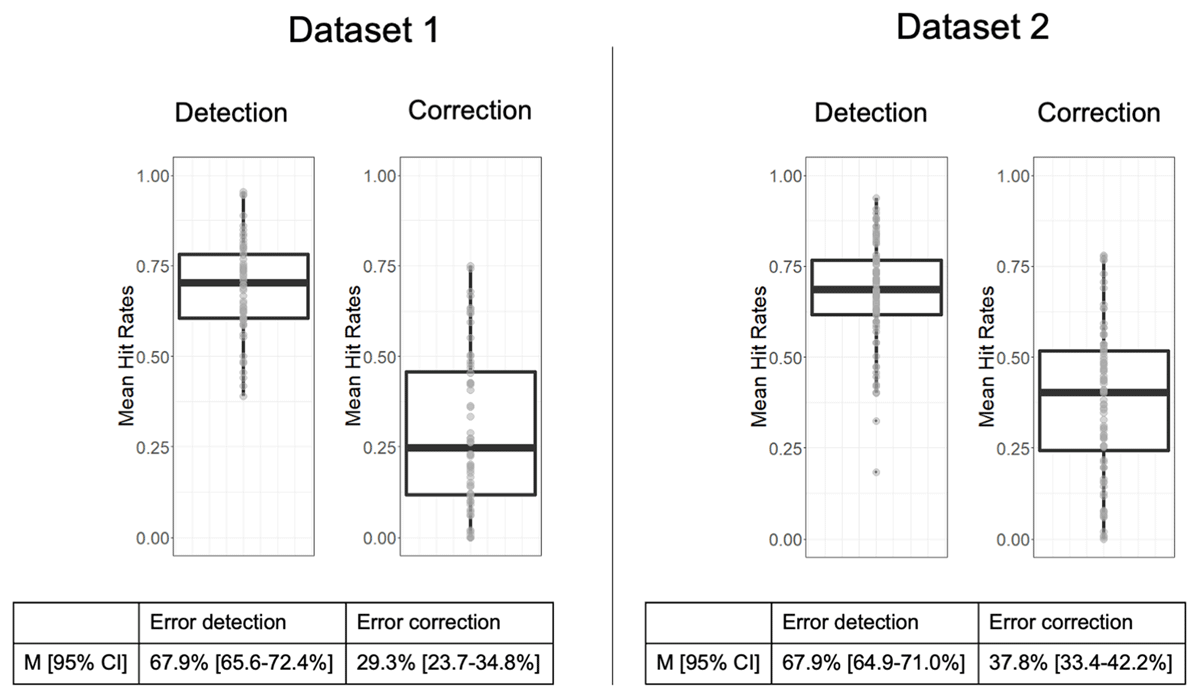
Figure 2
Distributions of hit rates for error detection and error correction attempt over subjects for each dataset. Confidence intervals (95%) are presented in square brackets.
Table 1
Raw counts and percentages of trials with correction attempts, broken down by whether an error was reported or not. Cells in bold cells correspond to unreported correction attempts (percentage computed out of the total number of trials with correction attempt).
| DATASET 1 | DATASET 2 | |||
|---|---|---|---|---|
| ERROR REPORTED | ERROR NOT REPORTED | ERROR REPORTED | ERROR NOT REPORTED | |
| Correction attempt | 727 (80.8%) | 173 (19.2%) | 3423 (89.7%) | 394 (10.3%) |
| No correction attempt | 1647 (64.4%) | 912 (35.6%) | 3998 (56.1%) | 3128 (43.9%) |
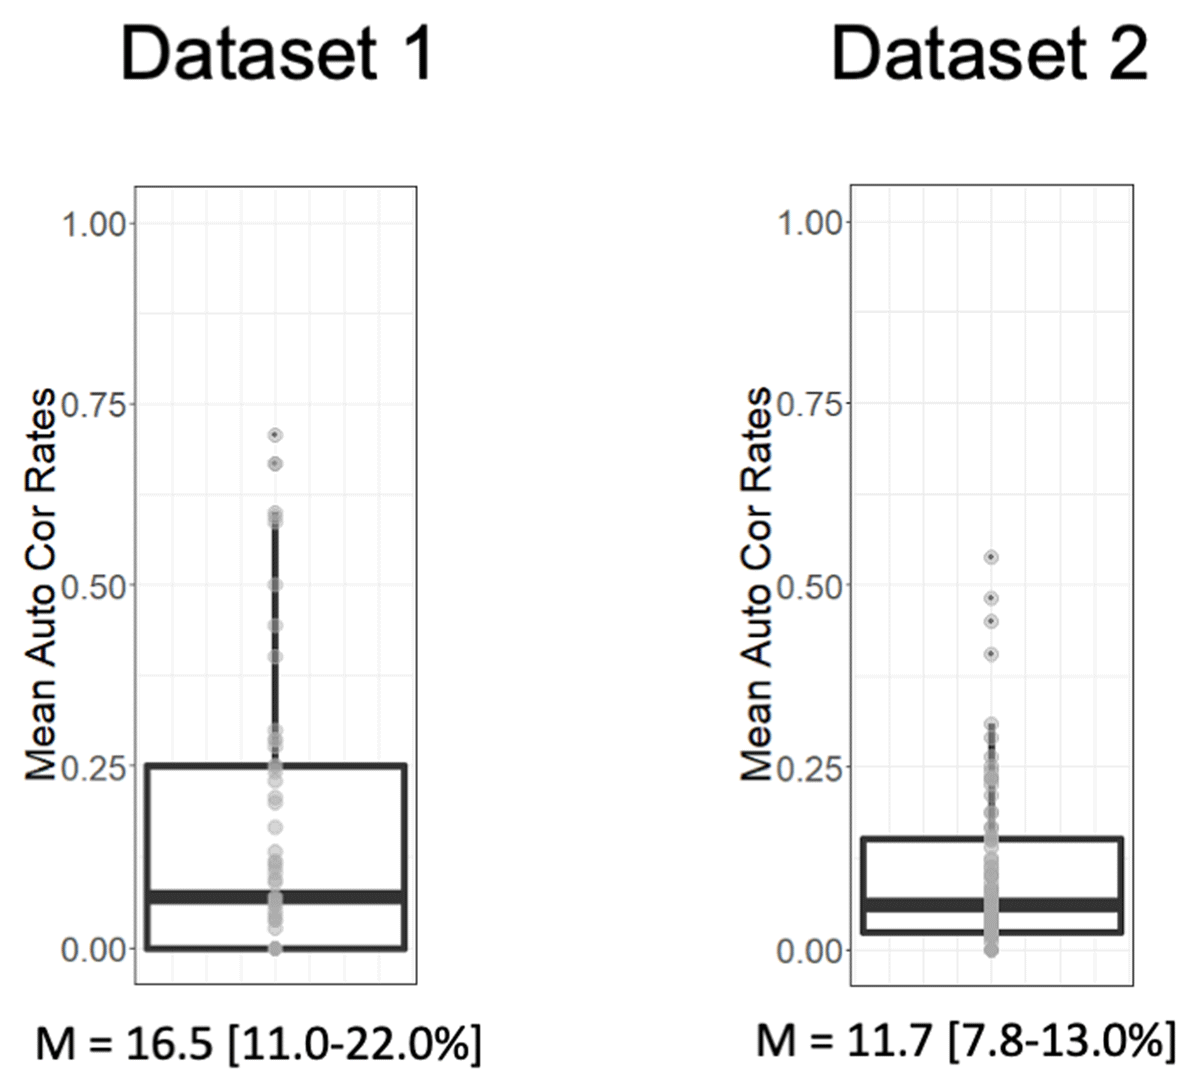
Figure 3
Distributions of the percentage of unreported correction attempts over subjects for each dataset. Median, Q1, and Q3 values are plotted as a boxplot, and given below each graph.
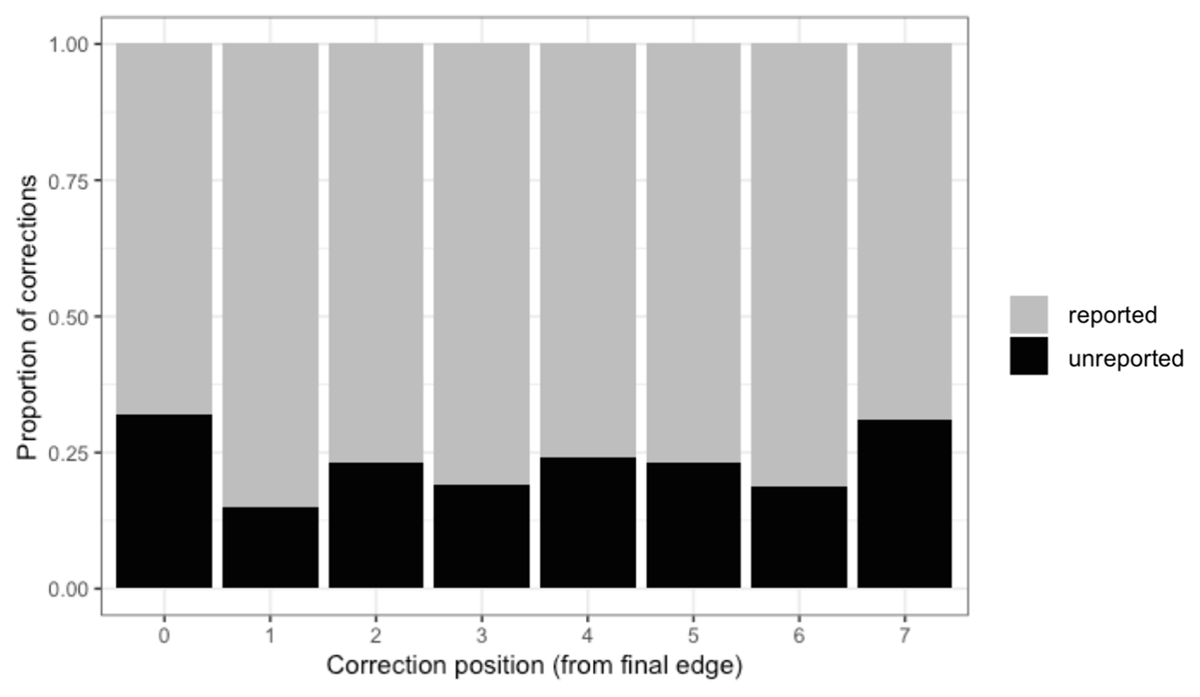
Figure 4
Stacked bars of reported (grey) and unreported (black) correction attempts by position. Position is coded as the distance from the final edge of the word, with position 0 being the final letter. Only responses that had the same number of characters as the target word were included, whether the final outcome was correct or not.
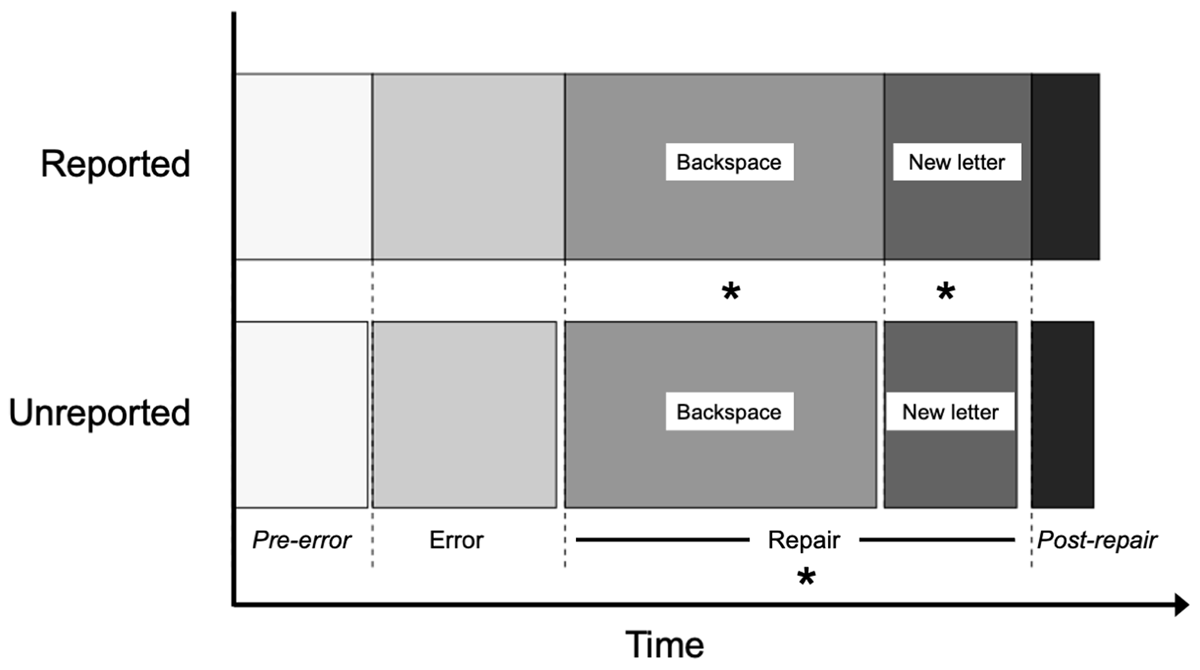
Figure 5
Timeline of trials with and without reported correction attempts. The IKI (or mean IKI if there are several keystrokes) is shown for each region. Asterisks indicates the region where the difference between reported and unreported correction attempts was significant.
Table 2
Results of statistical analyses comparing timing measures between reported and unreported correction attempts. All comparisons were run using mixed-effect linear models. Numbers in the parentheses are SD.
| REPORTED | NOT REPORTED | COHEN’S D | ß | t | P | 95%CI BOOTSTRAP | |||
|---|---|---|---|---|---|---|---|---|---|
| General | Mean IKI (ms) | 233.7 (84.9) | 206.2 (49.7) | 0.409 | 11.8 | 5.72 | <.001 | 7.39 | 15.9 |
| Pre-error | Mean IKI before error (ms) | 173.2 (39.0) | 167.4 (52.8) | 0.126 | 3.51 | 1.41 | 0.159 | –1.61 | 8.59 |
| Error | Error IKI (ms) | 238 (63.5) | 227.3 (116.8) | 0.119 | 6.38 | 1.47 | 0.142 | –1.94 | 14.6 |
| Repair | Backspace IKI (ms) | 394.8 (104.6) | 385 (153.6) | 0.076 | 18.0 | 2.94 | 0.0034 | 5.54 | 30.1 |
| IKI after backspace (ms) | 182.3 (65.6) | 163.8 (70.7) | 0.271 | 11.7 | 3.64 | <.001 | 5.2 | 18.5 | |
| Post-correction | Mean IKI after repair (ms) | 83.7 (36.5) | 76.7 (47.5) | 0.167 | 2.71 | 0.971 | 0.332 | –2.79 | 8.1 |
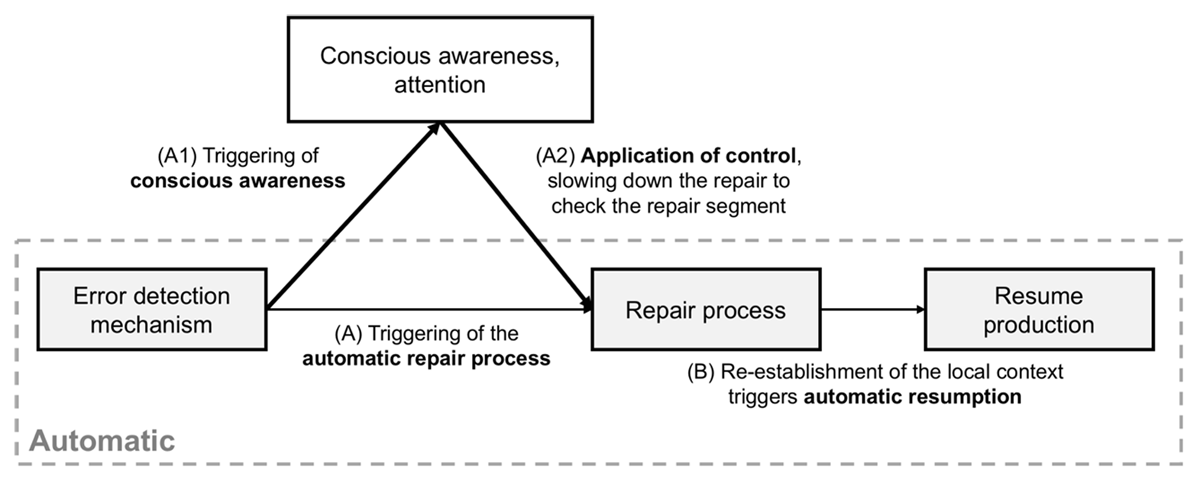
Figure 6
A schematic model of error detection, repair, and resumption. The process (A,B) can be completed without conscious awareness (dashed grey box). However, attentional processes are usually triggered by the detection mechanism (A1) and can override the automatic repair process or modify it (A2). (A) In typing, this corresponds to a backspace and a new letter. It replaces the current segment with the next most highly activated segment. (B) see G. D. Logan (2018) for an account of automatic resumption.
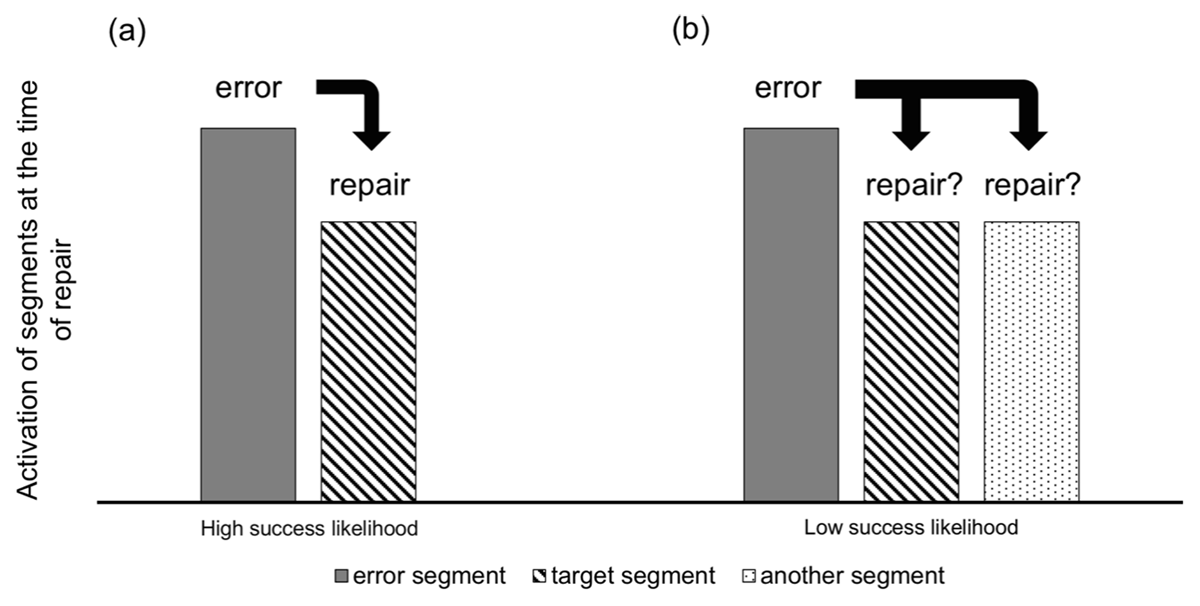
Figure 7
Schematics of activations of error and (potential) repair segments in trials with high (a) and low (b) rates of successful repairs. The repair process attempts to replace the error with the next most highly activated representation. In healthy systems, the target is almost always activated along with the error. If it is the only alternative, repair is quick and most likely successful (a). If more alternatives are simultaneously activated, the system must resolve the competition. This is time-consuming and the outcome is less certain to be the target (b).