
Table 1
Number of the participants.
| GENDER LANGUAGE | FEMALE | MALE | TOTAL |
|---|---|---|---|
| Monolingual | 13 | 21 | 34 |
| Bilingual | 36 | 14 | 50 |
| Multilingual | 24 | 9 | 33 |
| Total | 73 | 44 | 117 |
Table 2
Descriptive Statistics.
| N | MINIMUM | MAXIMUM | MEAN | STD. DEVIATION | |
|---|---|---|---|---|---|
| AGE | 117 | 11 | 14 | 12,44 | 1,132 |
| GENDER | 117 | *1,00 | **2,00 | 1,3761 | ,48648 |
| Valid N (listwise) | 117 |
[i] *Female **Male.
Table 3
Model Summaryb of multiple regression of non-gifted group.
| MODEL | R | R SQUARE | ADJUSTED R SQUARE | STD. ERROR OF THE ESTIMATE | CHANGE STATISTICS | DURBIN-WATSON | ||||
|---|---|---|---|---|---|---|---|---|---|---|
| R SQUARE CHANGE | F CHANGE | DF1 | DF2 | SIG. F CHANGE | ||||||
| 1 | ,732a | ,536 | ,510 | 18,993 | ,536 | 20,546 | 4 | 71 | ,000 | 1,922 |
[i] a. Predictors: (Constant), MULTI, WM, VOC, MONO.
b. Dependent Variable: MeLA.
Table 4
ANOVAa table of the multiple regression of non-gifted group.
| MODEL | SUM OF SQUARES | DF | MEAN SQUARE | F | SIG. | |
|---|---|---|---|---|---|---|
| 1 | Regression | 29644,864 | 4 | 7411,216 | 20,546 | ,000b |
| Residual | 25611,175 | 71 | 360,721 | |||
| Total | 55256,039 | 75 | ||||
[i] a. Dependent Variable: MeLA
b. Predictors: (Constant), MULTI, WM, VOC, MONO
Table 5
Correlations of the multiple regression model of non-gifted group.
| MELA | WM | VOC | MONO | BI | MULTI | ||
|---|---|---|---|---|---|---|---|
| Pearson Correlation | MeLA | 1,000 | ,336 | ,562 | –,461 | –,119 | ,620 |
| WM | ,336 | 1,000 | ,067 | –,348 | ,054 | ,307 | |
| VOC | ,562 | ,067 | 1,000 | –,549 | ,171 | ,388 | |
| MONO | –,461 | –,348 | –,549 | 1,000 | –,579 | –,406 | |
| BI | –,119 | ,054 | ,171 | –,579 | 1,000 | –,510 | |
| MULTI | ,620 | ,307 | ,388 | –,406 | –,510 | 1,000 | |
| Sig. (1-tailed) | MeLA | . | ,002 | ,000 | ,000 | ,153 | ,000 |
| WM | ,002 | . | ,284 | ,001 | ,323 | ,003 | |
| VOC | ,000 | ,284 | . | ,000 | ,070 | ,000 | |
| MONO | ,000 | ,001 | ,000 | . | ,000 | ,000 | |
| BI | ,153 | ,323 | ,070 | ,000 | . | ,000 | |
| MULTI | ,000 | ,003 | ,000 | ,000 | ,000 | . | |
Table 6
Coefficientsa table of the multiple regression for non- gifted participants.
| MODEL | UNSTANDARDIZED COEFFICIENTS | STANDARDIZED COEFFICIENTS | T | SIG. | CORRELATIONS | ||||
|---|---|---|---|---|---|---|---|---|---|
| B | STD. ERROR | BETA | ZERO-ORDER | PARTIAL | PART | ||||
| 1 | (Constant) | 47,290 | 10,215 | 4,629 | ,000 | ||||
| WM | ,343 | ,158 | ,183 | 2,170 | ,033 | ,336 | ,248 | ,174 | |
| VOC | ,825 | ,184 | ,390 | 4,472 | ,000 | ,562 | ,466 | ,359 | |
| MULTI | 25,221 | 5,601 | ,412 | 4,503 | ,000 | ,620 | ,469 | ,361 | |
[i] a. Dependent Variable: MeLA
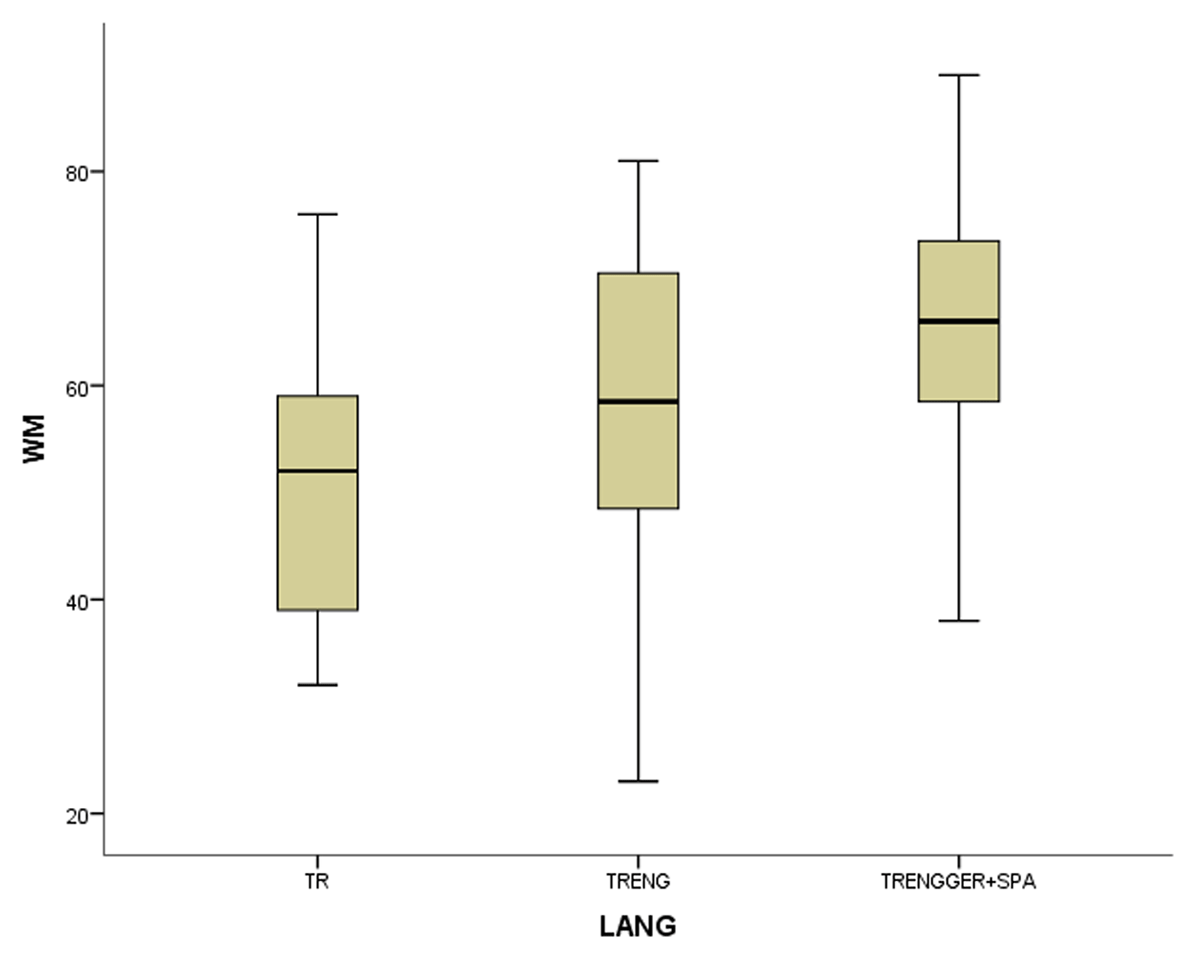
Figure 1
The boxplots of variables (WM for working memory, MeLA for metalinguistic awareness and VOC for vocabulary) in non-gifted group.
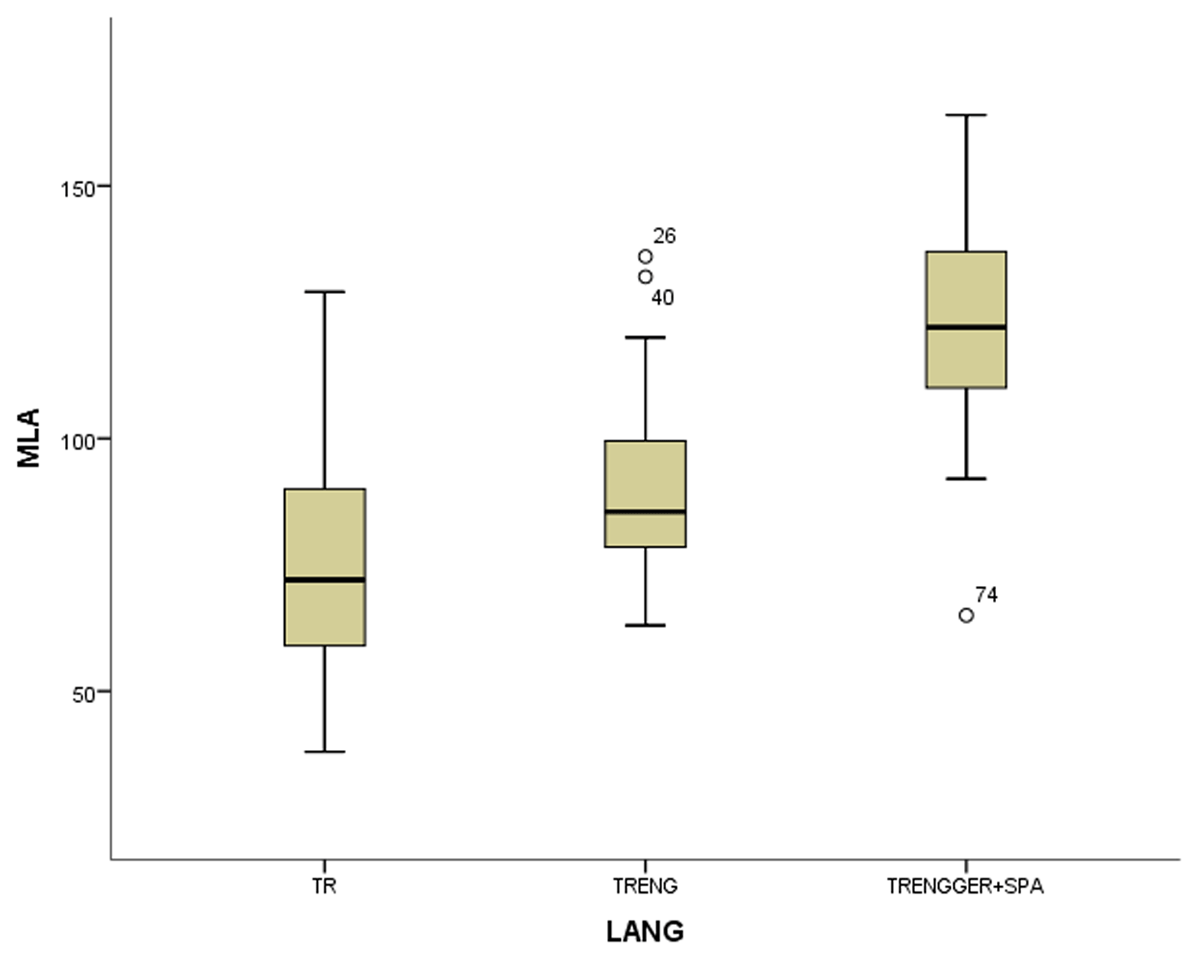
Figure 2
The boxplots of variables (WM for working memory, MeLA for metalinguistic awareness and VOC for vocabulary) in non-gifted group.
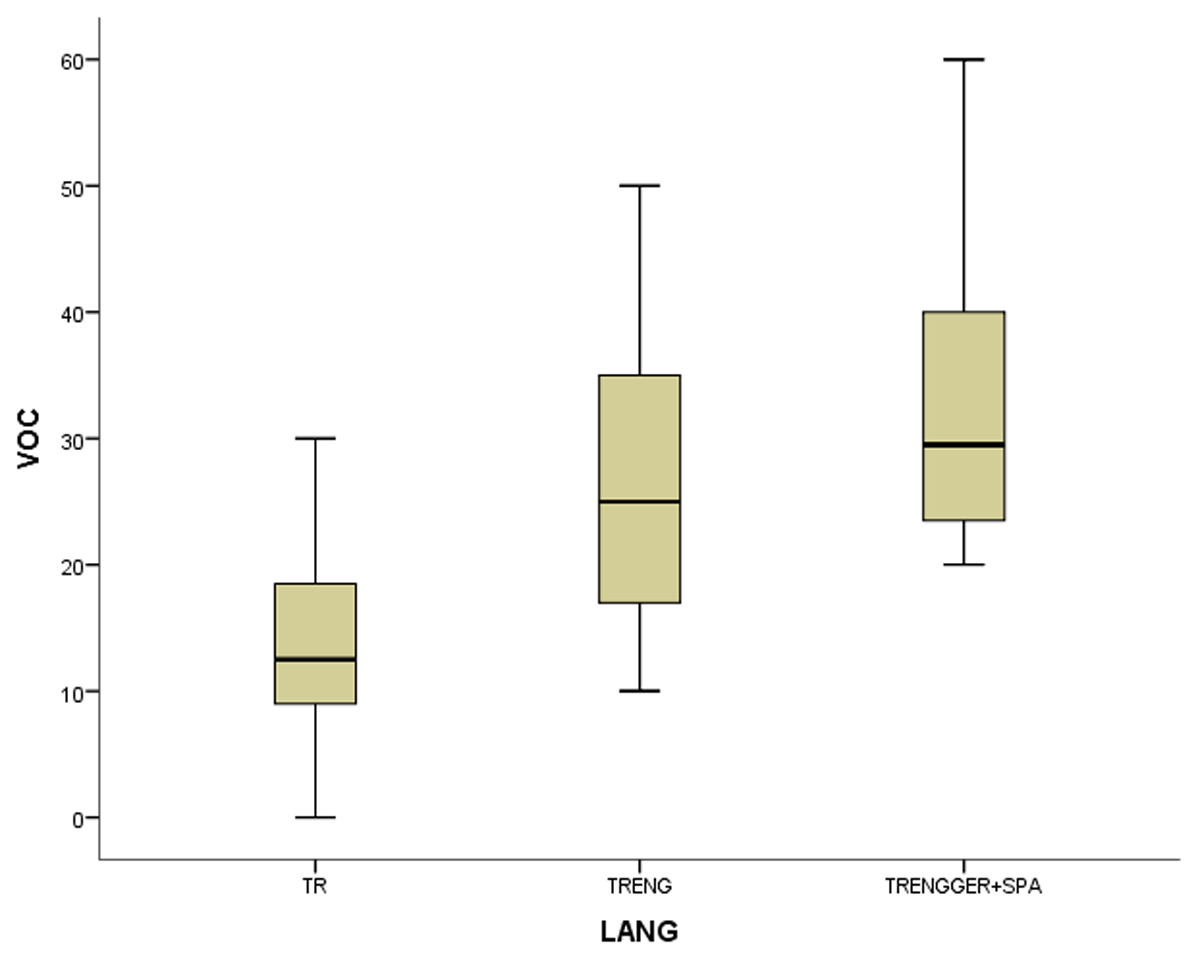
Figure 3
The boxplots of variables (WM for working memory, MeLA for metalinguistic awareness and VOC for vocabulary) in non-gifted group.
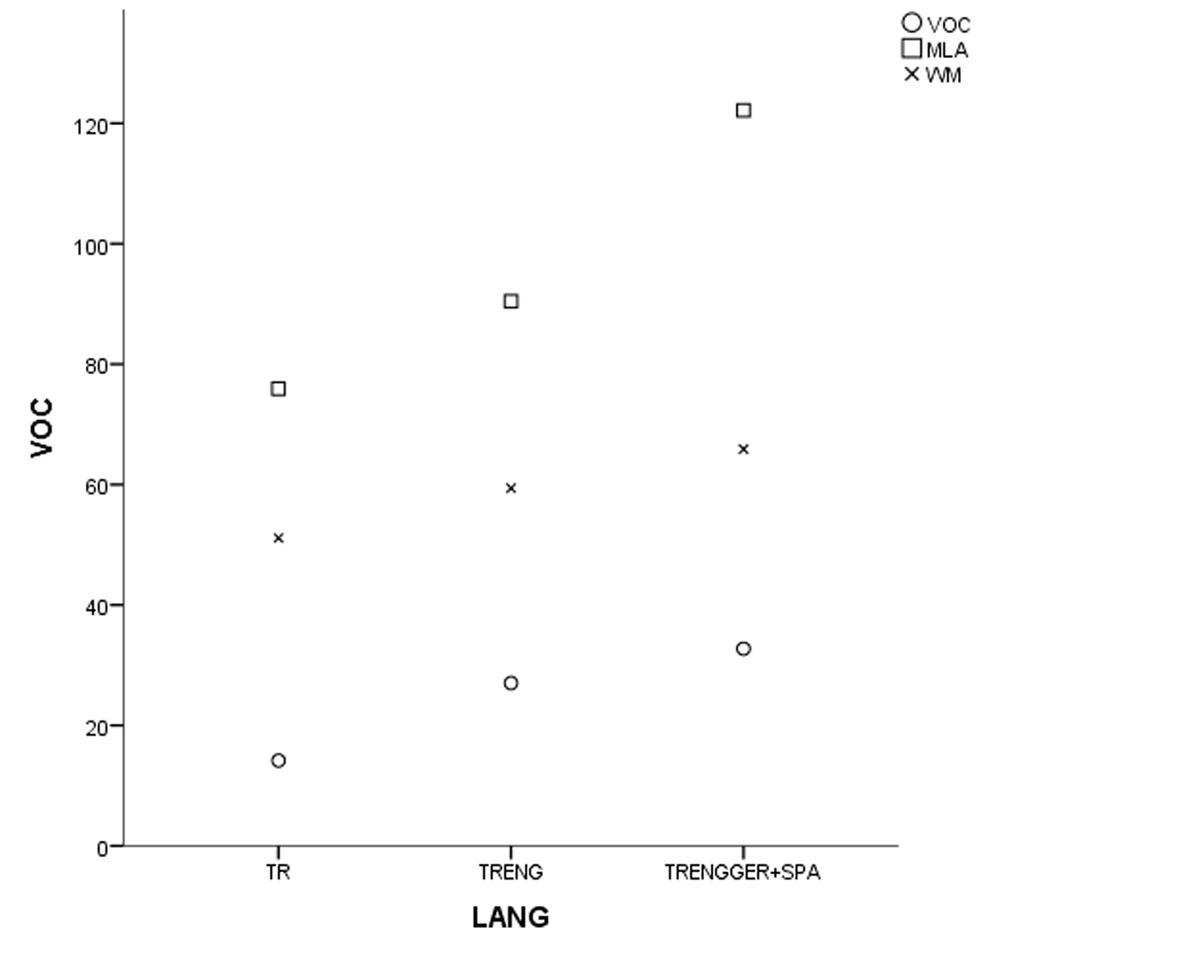
Figure 4
Grouped scatter-plot of the variables in non-gifted participants (TR for monolinguals, TRENG for bilinguals and TRENGGER+SPA for multilinguals).
Table 7
Model Summaryb of multiple regression of the gifted participants.
| MODEL | R | R SQUARE | ADJUSTED R SQUARE | STD. ERROR OF THE ESTIMATE | CHANGE STATISTICS | DURBIN-WATSON | ||||
|---|---|---|---|---|---|---|---|---|---|---|
| R SQUARE CHANGE | F CHANGE | DF1 | DF2 | SIG. F CHANGE | ||||||
| 1 | ,667a | ,445 | ,411 | 11,706 | ,445 | 13,205 | 2 | 33 | ,000 | 1,730 |
[i] a. Predictors: (Constant), MULTI, VOC. b. Dependent Variable: MeLA.
Table 8
ANOVAa table of the multiple regression for gifted participants.
| MODEL | SUM OF SQUARES | DF | MEAN SQUARE | F | SIG. | |
|---|---|---|---|---|---|---|
| 1 | Regression | 3827,143 | 3 | 1275,714 | 9,462 | ,000b |
| Residual | 4314,496 | 32 | 134,828 | |||
| Total | 8141,639 | 35 | ||||
[i] a. Dependent Variable: MeLA.
b. Predictors: (Constant), MULTI, WM, VOC.
Table 9
Correlations of the multiple regression model of gifted participants.
| MELA | WM | VOC | MONO | BI | MULTI | ||
|---|---|---|---|---|---|---|---|
| Pearson Correlation | MeLA | 1,000 | ,193 | ,511 | –,368 | –,198 | ,533 |
| WM | ,193 | 1,000 | –,108 | –,059 | –,133 | ,188 | |
| VOC | ,511 | –,108 | 1,000 | –,239 | –,011 | ,227 | |
| MONO | –,368 | –,059 | –,239 | 1,000 | –,461 | –,434 | |
| BI | –,198 | –,133 | –,011 | –,461 | 1,000 | –,600 | |
| MULTI | ,533 | ,188 | ,227 | –,434 | –,600 | 1,000 | |
| Sig. (1-tailed) | MELA | . | ,130 | ,001 | ,014 | ,123 | ,000 |
| WM | ,130 | . | ,264 | ,366 | ,220 | ,136 | |
| VOC | ,001 | ,264 | . | ,080 | ,474 | ,092 | |
| MONO | ,014 | ,366 | ,080 | . | ,002 | ,004 | |
| BI | ,123 | ,220 | ,474 | ,002 | . | ,000 | |
| MULTI | ,000 | ,136 | ,092 | ,004 | ,000 | . | |
Table 10
Coefficientsa table of the multiple regression for gifted participants.
| MODEL | UNSTANDARDIZED COEFFICIENTS | STANDARDIZED COEFFICIENTS | T | SIG. | CORRELATIONS | ||||
|---|---|---|---|---|---|---|---|---|---|
| B | STD. ERROR | BETA | ZERO-ORDER | PARTIAL | PART | ||||
| 1 | (Constant) | 81,748 | 6,927 | 11,801 | ,000 | ||||
| VOC | ,878 | ,284 | ,412 | 3,090 | ,004 | ,511 | ,474 | ,401 | |
| MULTI | 13,758 | 4,170 | ,439 | 3,299 | ,002 | ,533 | ,498 | ,428 | |
[i] a. Dependent Variable: MeLA.
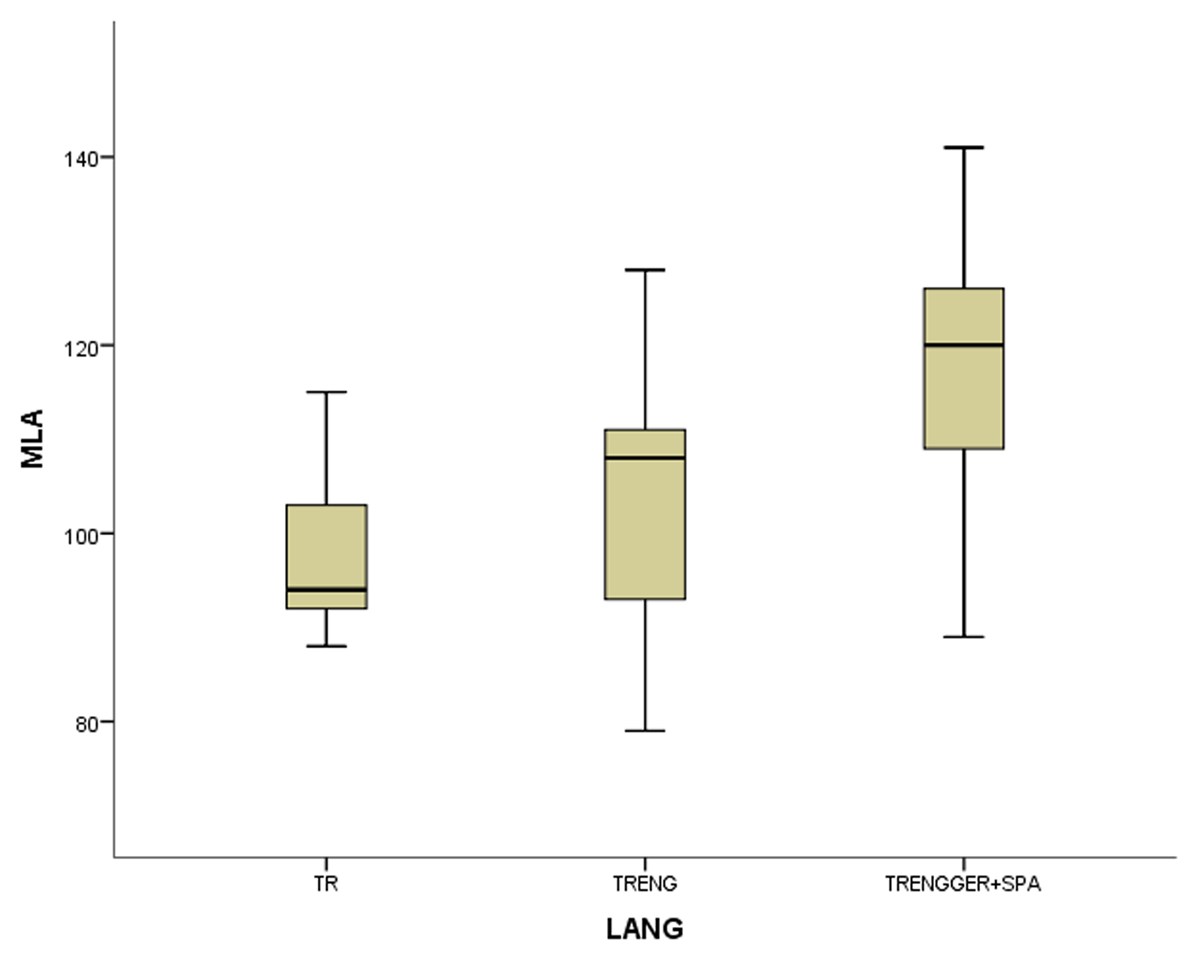
Figure 5
The boxplot of MeLA of gifted participants.
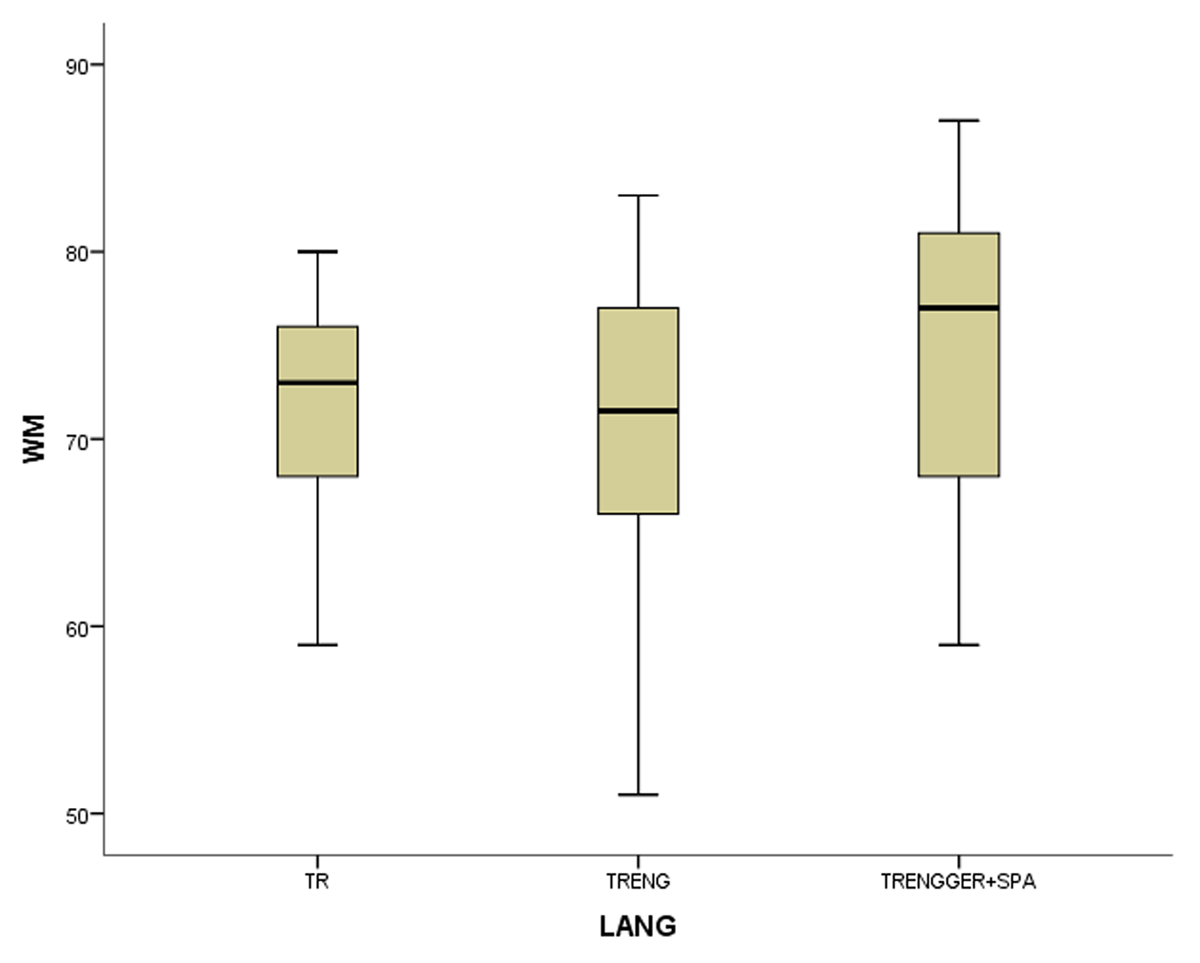
Figure 6
The boxplot of WM of gifted participants (TR for monolinguals, TRENG for bilinguals and TRENGGER+SPA for multilinguals).
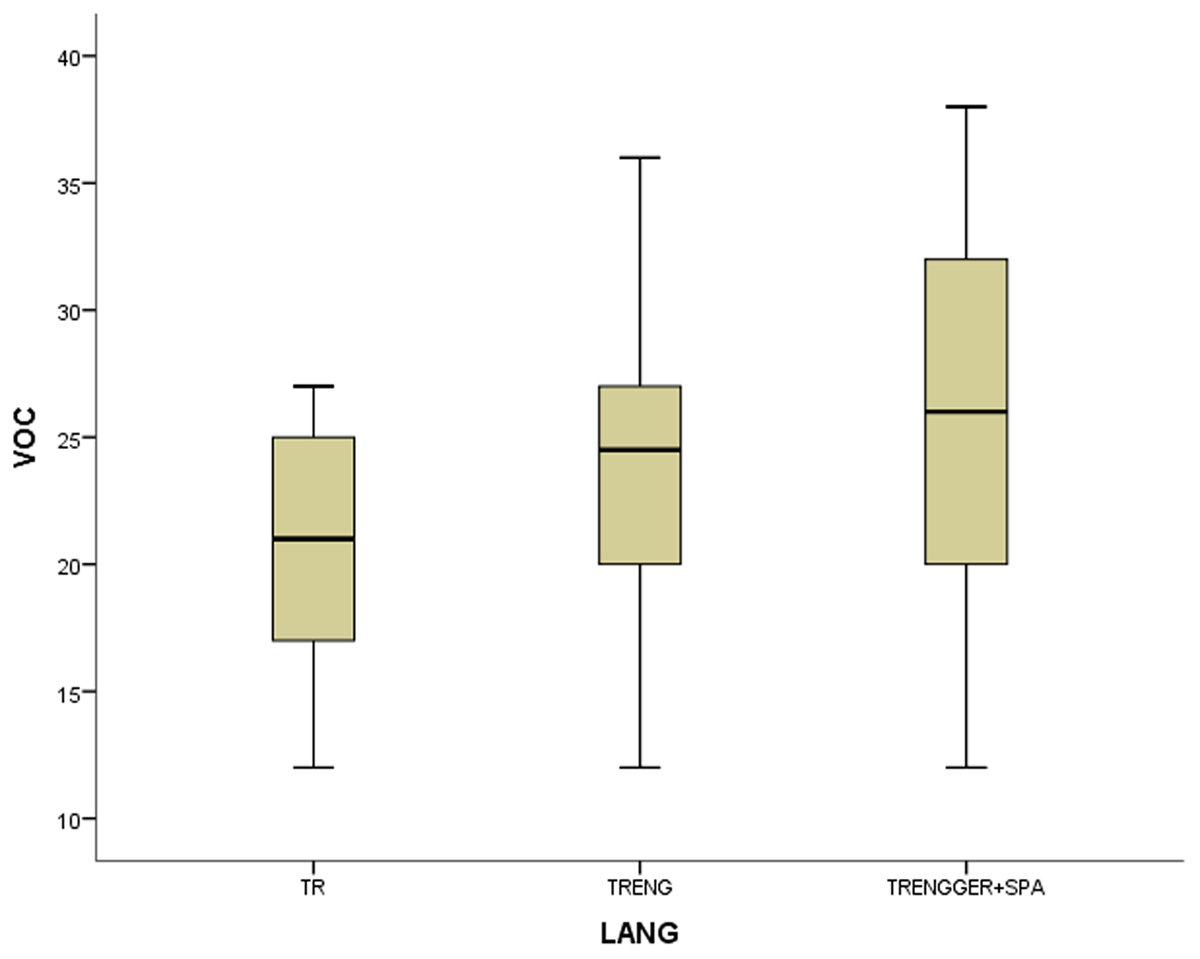
Figure 7
The boxplot of VOC-vocabulary variable of gifted participants.
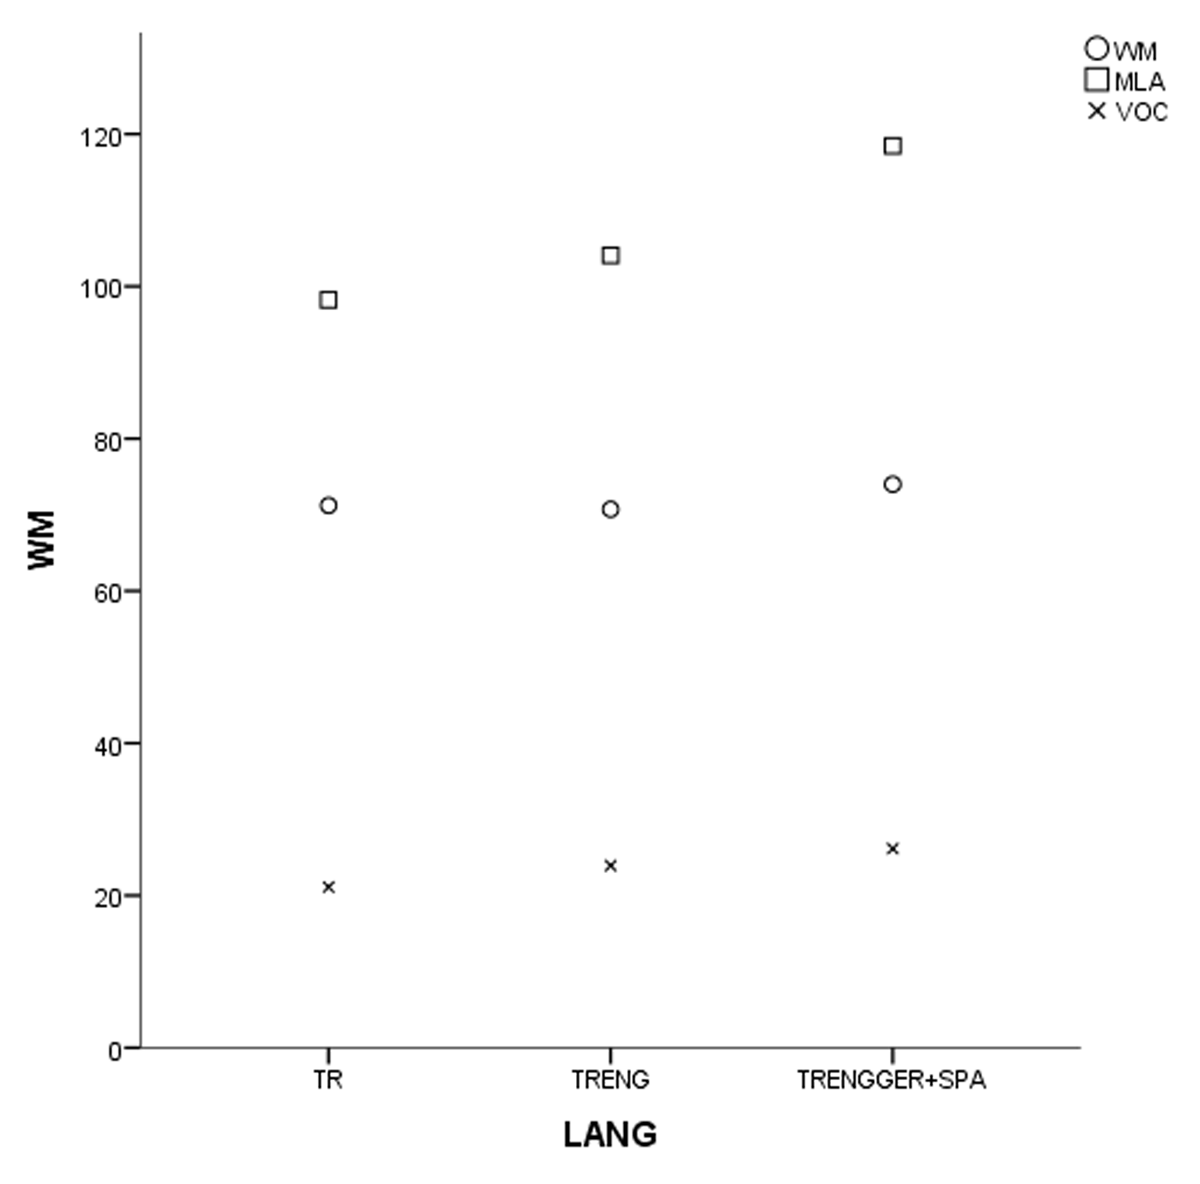
Figure 8
Grouped scatter-plot of the variables in gifted participants (TR for monolinguals, TRENG for bilinguals and TRENGGER+SPA for multilinguals).