
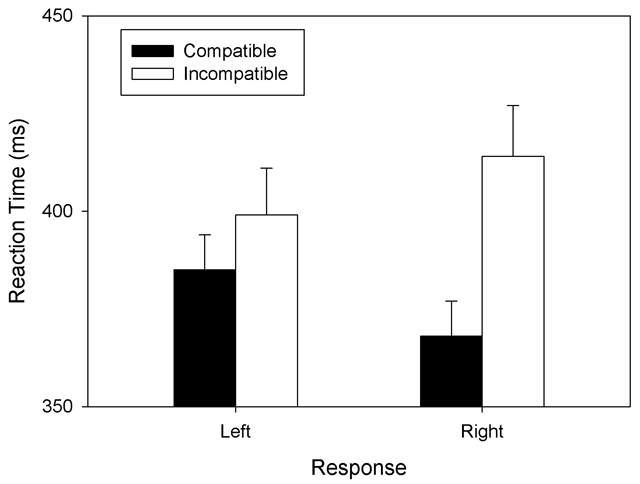
Figure 1
Mean RTs observed in Experiment 1.
Legend: Mean RTs as a function of S-R Mapping (compatible: small-left; large-right; incompatible: large-left; small-right) and Response (left vs. right) of Experiment 1. Error bars represent standard errors between participants.
Table 1
Percentages of errors observed in Experiment 1 as a function of S-R Mapping and Response (N = 24). Standard deviations are given in parentheses.
| Compatible | Incompatible | |
|---|---|---|
| Left Response | 3.19 (4.45) | 2.50 (3.96) |
| Right Response | 1.67 (2.60) | 4.72 (6.44) |
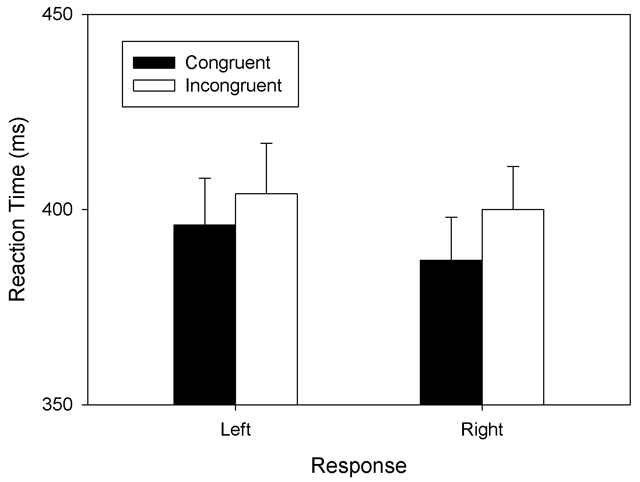
Figure 2
Mean RTs observed in Experiment 2.
Legend: Mean RTs as a function of S-R Congruency (congruent: small-left; large-right; incongruent: large-left; small-right) and Response (left vs. right) in the color-discrimination task of Experiment 2. Error bars represent standard errors between participants.