
Table 1
Overview of studies using an item-recognition task, together with the duration of Item presentation and of Delay, and whether or not a last-presented benefit was observed. Studies are listed from the shortest (0 ms) to longest (4800 ms) Delay duration.
| AUTHOR | ITEM PRESENTATION | DELAY | LAST-PRESENTED BENEFIT | |
|---|---|---|---|---|
| Morin, DeRosa, & Stultz, 1967 | 500 ms | 0 ms | Yes | |
| Monsell, 1978 | 400 ms | 100 ms | Yes | |
| Vergauwe & Langerock, 2017 | 250 ms | 150 ms | Yes | |
| McElree & Dosher, 1989 | 500 ms | 300 ms | Yes | |
| Nee & Jonides, 2008 | 500 ms | 300 ms | Yes | |
| Corballis, 1967 | 150 ms | 450 ms | Yes | |
| Burrows & Okada, 1971 | 500 ms | 500 ms | Yes | |
| Donskin & Nosofsky, 2012 | 500 ms | 600 ms | Yes | |
| Monsell, 1978 | 400 ms | 600 ms | Yes | |
| Clifton & Birenbaum, 1970 | 1500 ms | 800 ms | Yes | |
| Corballis, 1967 | 300 ms | 900 ms | Yes | |
| Vergauwe & Langerock, 2017 | 250 ms | 1150 ms | No | |
| Donskin & Nosofsky, 2012 | 1000 ms | 2000 ms | No | |
| Burrows & Okada, 1971 | 1200 ms | 2400 ms | Yes | |
| Clifton & Birenbaum, 1970 | 1500 ms | 2800 ms | No | |
| Clifton & Birenbaum, 1970 | 1500 ms | 4800 ms | No | |
[i] Note: Studies included in the table were item-recognition tasks with sequential item presentation, sub-span memory lists, simple verbal materials, single probes and healthy young adults as participants. Duration delay runs from the offset of the last memory item to the presentation of the probe and thus includes the sum of empty delays, and potential sensory masks or warning images for the test images.
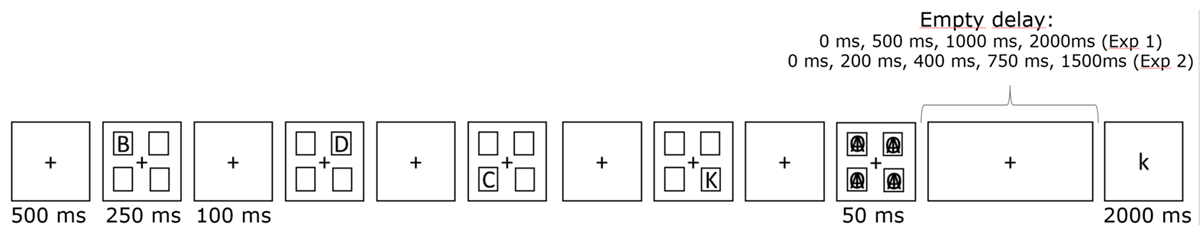
Figure 1
Illustration of the events on a single trial in Experiments 1 and 2.
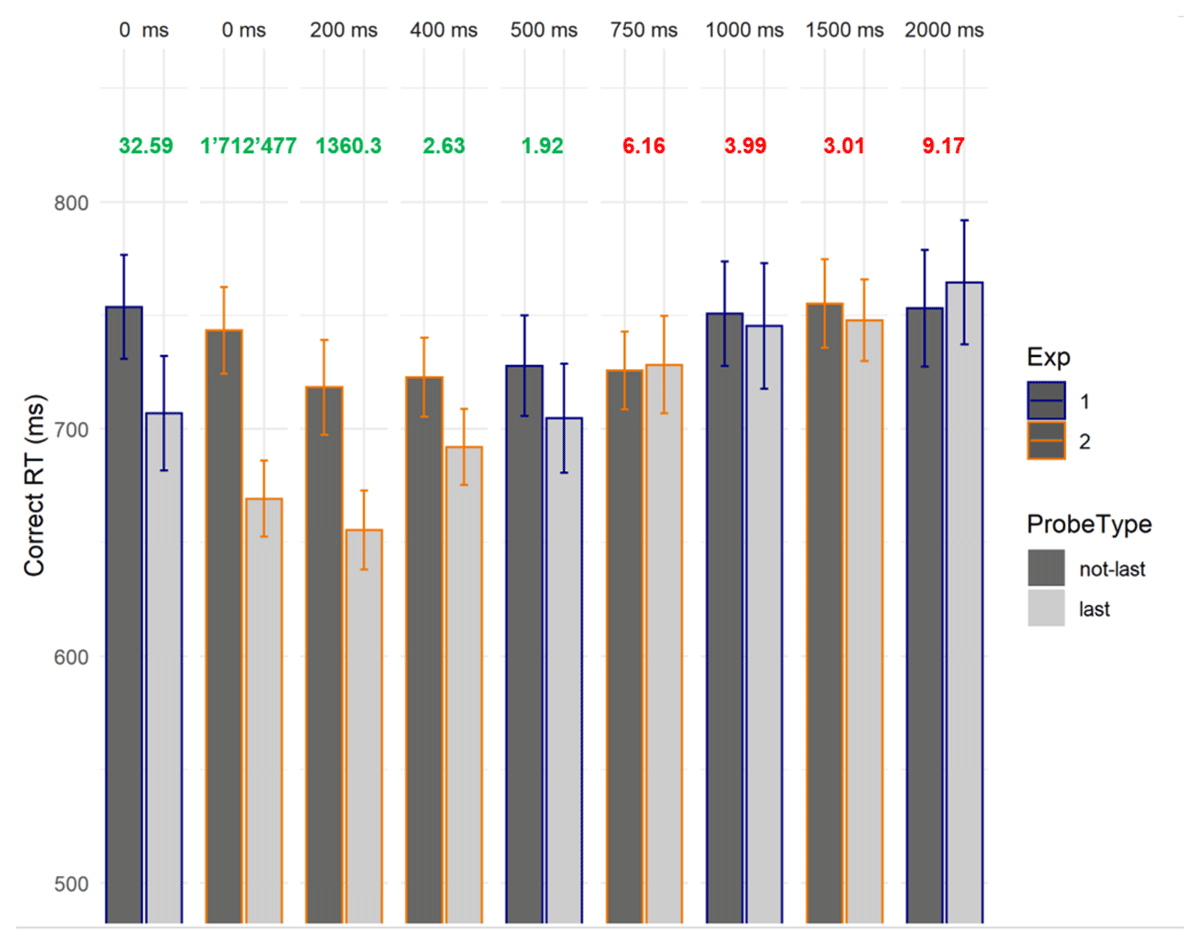
Figure 2
Mean response times in ms for probes matching the last-presented item (“last”) vs. probes matching other list items (“not-last”) in Experiments 1 and 2, together with the evidence in the data (Bayes factors) for (in green) or against (in red) the last-presented benefit in each delay condition. Note that the bars showing data from Experiment 1 have a blue border, while bars showing data from Experiment 2 have an orange border. Error bars represent standard errors of the mean.